

California Real Estate | 3 minute read
San Francisco Home Prices Reach All-Time High
BY PropertyShark Staff | Aug 4, 2015
San Francisco’s residential market not only remained strong in the second quarter of 2015, but hit an all-time high: the median sale price reached $1,185,000, a 20% increase over Q2 2014.
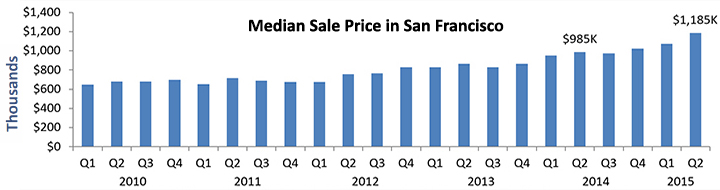
The median price per sq. ft. ($915) — up 10% Q-o-Q and 15% Y-o-Y — mirrors the trend for median sale prices and marks another record for the SF housing market.
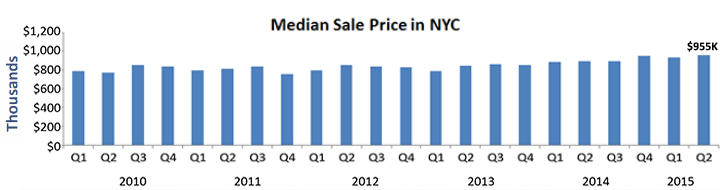
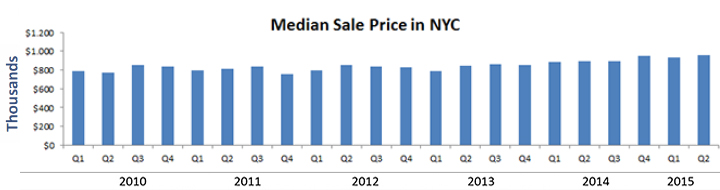
San Francisco home prices even exceed Manhattan numbers, where the median sale price for residential properties hasn’t reached $1M yet.
Residential market highlights:
- total number of transactions: 1691 (5% decrease Y-o-Y);
- sales volume exceeded $2.5 billion;
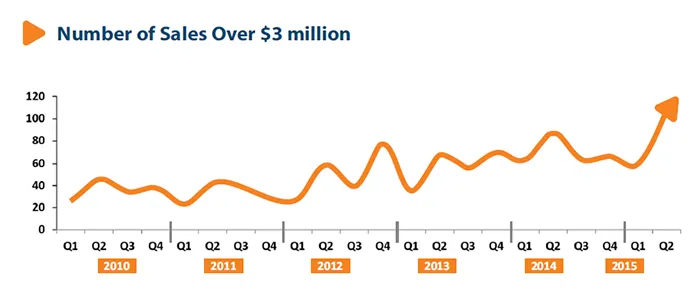
- luxury sales (over $3 million) rose to 108 sales, up 24% Y-o-Y;
- most expensive sale in Q2 was a 25-bedroom mansion; sale closed at $31 million, $8M less than its initial asking price;
- most expensive zip code: 94123 , average home sold for over $2.2M;
- least expensive zip code: 94124, median home sale price around $650K.
House versus Condo Sales
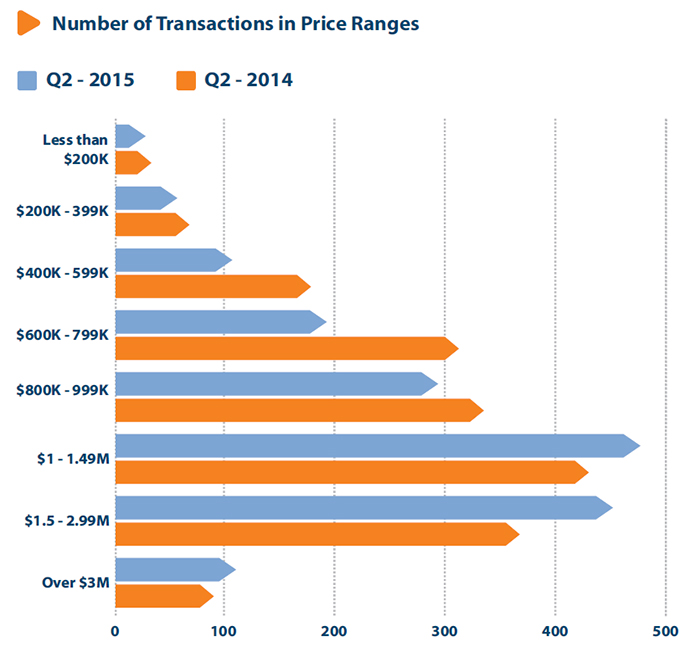
In Q2 2015, median prices were up for all property classes. The median price for single-family homes was $1,250,000, just $150K over the median sale price for condos. The price per sq.ft, however, was significantly higher in the case of condominiums than the price per sq.ft. for single-family homes. 57% of the transactions were houses, while 43% condos.
Transaction Price Ranges
Luxury Market
The number of home sales over $3M has skyrocketed in Q2 compared to the previous quarter. The 108 sales closed this quarter represent an increase of 83% Q-o-Q and an increase of 24% Y-o-Y.
Top 10 Residential Sales by Sale Price
| No. | Property Address | Sale Price | Property Type |
|---|---|---|---|
| 1 | 2701 Broadway | $31,000,000 | Single Family Residence |
| 2 | 2950 Vallejo Street | $16,760,000 | Single Family Residence |
| 3 | 3385 Jackson Street | $13,500,000 | Single Family Residence |
| 4 | 3015 Pacific Avenue | $12,000,000 | Single Family Residence |
| 5 | 2939 Vallejo Street | $12,000,000 | Single Family Residence |
| 6 | 2010 Jackson Street | $11,500,000 | Single Family Residence |
| 7 | 178 Seacliff Avenue | $11,000,000 | Single Family Residence |
| 8 | 3636 Clay Street | $9,000,000 | Single Family Residence |
| 9 | 870 El Camino Del Mar | $8,500,000 | Single Family Residence |
| 10 | 24 Presidio Terrace | $8,000,000 | Single Family Residence |
Top Zip Codes by Median Sale Price in Quarter 2 2015
94123 topped the list of the most expensive zip codes in the city,where the average home was sold for over $2.2M. See the top 10 Zip Codes by Median Sale Price in Q2:
| Rank | Zip Codes | No. of transactions | Median Sale Price | Median Price per sq. ft. |
|---|---|---|---|---|
| 1 | 94123 | 55 | $2,275,000 | $1,196 |
| 2 | 94104 | 6 | $1,800,000 | $1,132 |
| 3 | 94118 | 71 | $1,780,000 | $891 |
| 4 | 94114 | 117 | $1,680,000 | $1,053 |
| 5 | 94133 | 27 | $1,675,000 | $1,063 |
| 6 | 94127 | 68 | $1,590,000 | $884 |
| 7 | 94158 | 32 | $1,372,500 | $1,141 |
| 8 | 94121 | 85 | $1,351,000 | $783 |
| 9 | 94117 | 81 | $1,340,000 | $972 |
| 10 | 94115 | 65 | $1,328,000 | $1,040 |

In the cheapest zip code – 94124 – the median home sale price was slightly over $650K.
| Rank | Zip codes | No. of transactions | Median sale price | Median price per sq. ft. |
|---|---|---|---|---|
| 1 | 94124 | 57 | $653,000 | $521 |
| 2 | 94134 | 63 | $710,000 | $567 |
| 3 | 94132 | 41 | $760,000 | $604 |
| 4 | 94112 | 111 | $807,000 | $592 |
| 5 | 94102 | 23 | $825,000 | $898 |
| 6 | 94103 | 54 | $900,000 | $975 |
| 7 | 94108 | 18 | $940,000 | $1,104 |
| 8 | 94109 | 86 | $980,000 | $978 |
| 9 | 94116 | 84 | $1,083,000 | $794 |
| 10 | 94122 | 97 | $1,105,000 | $709 |
Download our complete San Francisco Report for Q2 here.
Latest Posts
Want to stay on top of the real estate market?
Access comprehensive property data and ownership information with intuitive research tools.
POSTED IN: California Real Estate, San Francisco Real Estate

Recent Reports
Locked-In Owners, Mobile Renters: Homeowners Stay Put as Renters Move 3.7x More Across Largest U.S. Cities
Renters became the primary drivers of long-distance mobility across the largest U.S. cities, moving 3.7 times more than owners in 2024, as high mortgage rates and housing costs kept many homeowners in place.
$4.6M Hudson Yards Maintains Top Spot, Luxury Sales in Malba Set $2.5M Price Record for Queens
Despite prices declining, Hudson Yards remained the most expensive NYC neighborhood, but TriBeCa’s growth closed the gap to under $400,000, while Malba set a new historic price record for Queens at $2.5 million, securing the highest ranking ever for the borough at #5.
2026 Q1 Foreclosure Report: Brooklyn Filings Fall Sharply, Bronx & Staten Island Hit New Peaks
Behind a deceptively mild citywide downtick, borough foreclosure markets pulled into significantly diverging paths as Brooklyn cases were nearly halved and the Bronx hit a new, record high. Meanwhile, Queens remained unchanged, Staten Island surged back up and Manhattan cooled slowly.