

RELEASED ON September 10, 2019
Gramercy Park Median Home Prices Go Up 87% in Q2 2019, Brooklyn’s Cobble Hill Surges 171%
Patrick McGregor | 4 minute read
Key takeaways: Hudson Yards enters the list as the 2nd most expensive NYC neighborhood in Q2 2019 Little Italy prices increase 153%, landing the neighborhood in the 3rd spot Cobble Hill jumps 171% to secure the 7th position DUMBO continues its slide, down another 40% Y-o-Y The top 50 most expensive neighborhoods in New York City had some new entrants and big shifts in Q2 2019. Sales in prominent buildings and shifting volume account for the change. Tribeca remains the priciest neighborhood, but the newly constructed Hudson Yards neighborhood has entered the list at #2, with sales occurring in its first completed residential building. Little Italy, Cobble Hill and Prospect Park South all jumped multiple spots as their prices more than doubled year-over-year. New York City’s approved “Mansion Tax” took effect on July 1st, encouraging buyers to close on purchases to avoid paying the new tax. The largest decline was DUMBO, falling 40% Y-o-Y to a low of $1.5 million with just 12 transactions. There were no sales in the Clock Tower building which assuredly drew down the median. Battery Park City, Brooklyn Heights and Manhattan Beach also dropped by more than 14% all on low volume. Manhattan neighborhoods accounted for almost…
Key takeaways:
- Hudson Yards enters the list as the 2nd most expensive NYC neighborhood in Q2 2019
- Little Italy prices increase 153%, landing the neighborhood in the 3rd spot
- Cobble Hill jumps 171% to secure the 7th position
- DUMBO continues its slide, down another 40% Y-o-Y
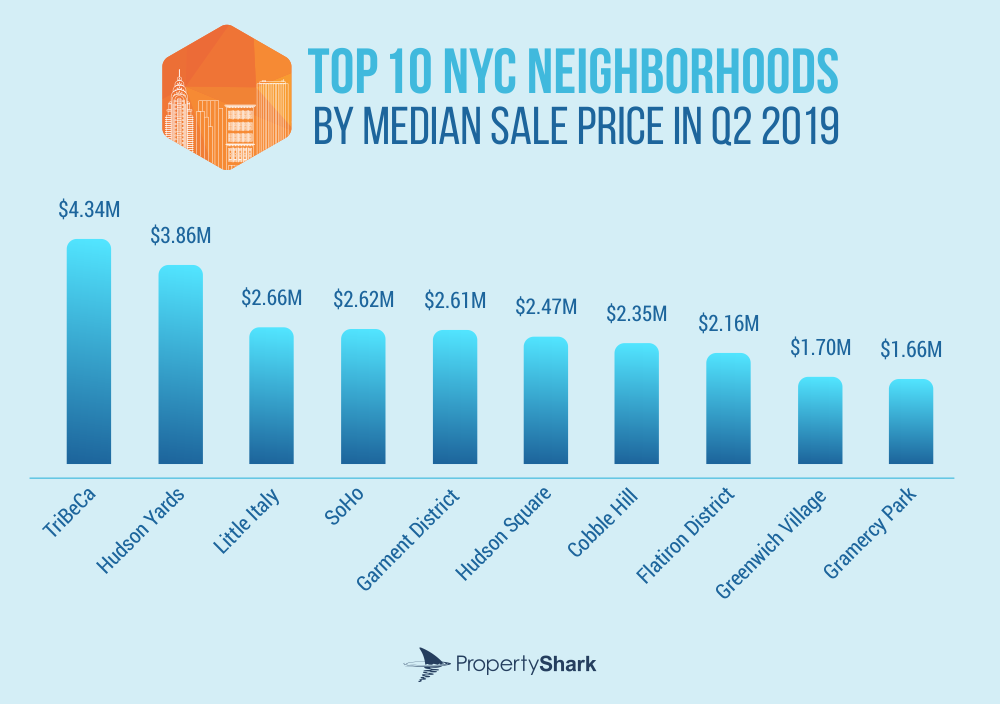
The top 50 most expensive neighborhoods in New York City had some new entrants and big shifts in Q2 2019. Sales in prominent buildings and shifting volume account for the change. Tribeca remains the priciest neighborhood, but the newly constructed Hudson Yards neighborhood has entered the list at #2, with sales occurring in its first completed residential building. Little Italy, Cobble Hill and Prospect Park South all jumped multiple spots as their prices more than doubled year-over-year.
New York City’s approved “Mansion Tax” took effect on July 1st, encouraging buyers to close on purchases to avoid paying the new tax.
The largest decline was DUMBO, falling 40% Y-o-Y to a low of $1.5 million with just 12 transactions. There were no sales in the Clock Tower building which assuredly drew down the median. Battery Park City, Brooklyn Heights and Manhattan Beach also dropped by more than 14% all on low volume.
Manhattan neighborhoods accounted for almost half of the list. 24 entries in the top 50 were in Manhattan with Hudson Yards and Roosevelt Island as the two new entrants. Brooklyn came in second occupying 21 spots, followed by Queens with 7. Due to several ties, the list adds up to a total of 52 neighborhoods.
Manhattan neighborhoods dominated the top 10 spots. Brooklyn’s Cobble Hill is the only neighborhood outside of Manhattan in the top 10. Little Italy jumped 20 spots to the 3rd position on our list, while SoHo relinquished the 2nd position and fell to the 4th with a 10% decline year-over-year.
Read on to see some of the highlights of the study and scroll to the end of the article to view the top-50 chart.
Manhattan Highlights: Little Italy Jumps to #3 with Puck Building Sales
Little Italy – The redeveloped Puck Building had two sales, which helped Little Italy register a 153% increase year-over-year to almost $2.7 million and the 3rd spot on our list.
A total of nine residential transactions were closed in the neighborhood—including the two sales from the Puck Building. One of the key contributing factors to the increase in the median were these two units which sold for $18 million each. Even so, the median sale price without those sales was still $2.2 million, which is still a steep jump.
Even though the Flatiron District registered a 32% increase year-over-year, it fell two spots from last year to the 8th position. Notable sales at 277 Fifth Ave. and Jeff Bezos’ purchase of three units, including the penthouse, at 212 Fifth Ave for $80 million boosted the median sale price to $2.16 million in Q2.
Another neighborhood where prices went up significantly is Gramercy Park. Year-over-year the neighborhood’s median sale price increased 87% to almost $1.7 million. This was partly due to 33 transactions closing at 121 E. 22nd St. with a median of over $2 million, and 21 transactions closing at 200 E. 21st St with a median over $2.5 million.
TriBeCa and Hudson Yards took the top 2 most expensive neighborhoods. Prices increased 14% year-over-year to almost $4.35 million in TriBeCa. Hudson Yards entered the list this quarter with a median home sale price of just under $3.9 million.
In the Lower East Side, over half of the sales that occurred were at One Manhattan Square. The median price of those 85 sales was over $1.4 million, a 45% increase year-over-year, and moved up 12 spots on our list to the 16th position.
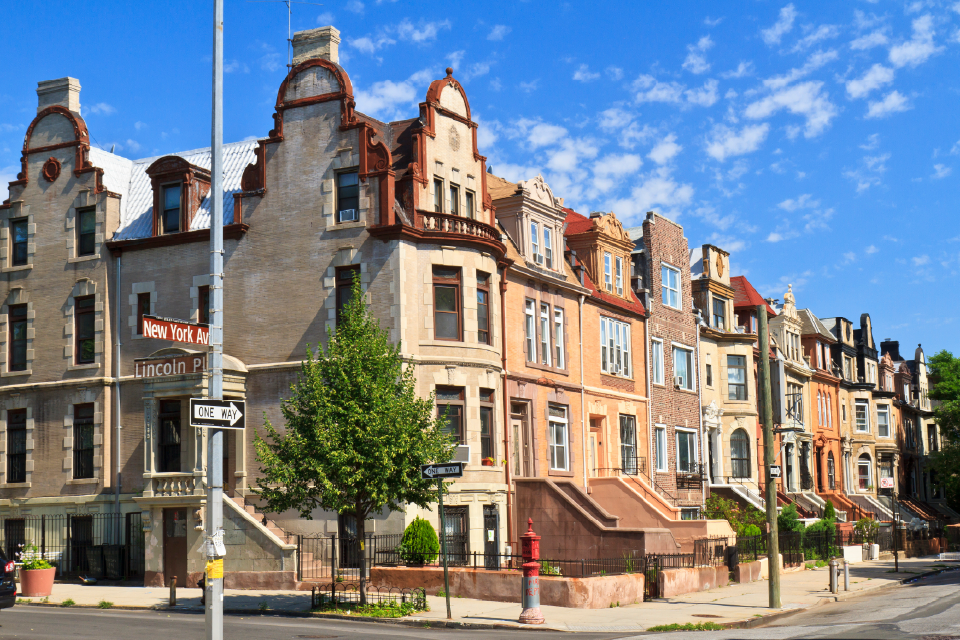
Brooklyn Highlights: Only One Brooklyn Neighborhood Made It into the Top 10
Cobble Hill was the only Brooklyn neighborhood to make it into the top 10. The Cobble Hill House accounted for 17 of the total 29 transactions in the neighborhood. Those sales alone had a median home sale price of over $2.3 million, pushing the neighborhood to the 7th position on our list.
Prospect Park South experienced an increase of 142% Y-o-Y to $1.23 million. While the sale volume was low with just seven sales, three of them were houses, which is the likely cause of the overall increase.
Another interesting development occurred in the Columbia Street Waterfront District, where prices rose 86% year-over-year to $1.2 million. While the neighborhood only registered nine total transactions, three of them were at the boutique condo development at 161-163 Columbia Street.
Queens Highlights: Ditmars–Steinway’s Median Grows 79% Y-o-Y
Ditmars – Steinway’s median home sale price still hasn’t yet reached $1 million. However, year-over-year, the neighborhood saw a 79% increase, with the median price reaching $964,500. Rockwood Park experienced an increase as well, climbing 23% Y-o-Y to $845,000.
While Queensboro Hill was flat year-over-year, both Hunters Point and East Flushing experienced declines of 11% and 5%, respectively.
Methodology
Median home sale prices were calculated based on residential property sales closed between April 1, 2019 and June 30, 2019. The residential properties included in the stats are single-family homes, condos and co-ops. Package deals were excluded.
Only neighborhoods with more than 5 residential sales were included.
Sales from the Civic Center neighborhood were excluded due to the largely commercial make-up of the neighborhood.
The boundaries to some of the neighborhoods in Manhattan vary. Data on several small neighborhoods is included in stats for larger areas. For example, Central Park South is included in Theatre District – Times Square, NoLita is included in Little Italy; NoHo is included in Greenwich Village; Carnegie Hill, Lenox Hill and Yorkville are included in the Upper East Side.
Want to stay on top of the real estate market?
Access comprehensive property data and ownership information with intuitive research tools.
POSTED IN: Market Studies, New York Real Estate

Patrick McGregor is a senior writer covering the real estate industry and overall economic trends in the United States for several Yardi product publications. He also holds an MBA from Thunderbird School of Global Management. Patrick was previously a commercial real estate analyst at Yardi Matrix for five years. His work has appeared in the New York Times, Bisnow, GlobeSt, The Real Deal, Business Insider, The Denver Post, The Motley Fool, and more.
Recent Reports

Locked-In Owners, Mobile Renters: Homeowners Stay Put as Renters Move 3.7x More Across Largest U.S. Cities
Renters became the primary drivers of long-distance mobility across the largest U.S. cities, moving 3.7 times more than owners in 2024, as high mortgage rates and housing costs kept many homeowners in place.

$4.6M Hudson Yards Maintains Top Spot, Luxury Sales in Malba Set $2.5M Price Record for Queens
Despite prices declining, Hudson Yards remained the most expensive NYC neighborhood, but TriBeCa’s growth closed the gap to under $400,000, while Malba set a new historic price record for Queens at $2.5 million, securing the highest ranking ever for the borough at #5.
2026 Q1 Foreclosure Report: Brooklyn Filings Fall Sharply, Bronx & Staten Island Hit New Peaks
Behind a deceptively mild citywide downtick, borough foreclosure markets pulled into significantly diverging paths as Brooklyn cases were nearly halved and the Bronx hit a new, record high. Meanwhile, Queens remained unchanged, Staten Island surged back up and Manhattan cooled slowly.