

RELEASED ON November 6, 2019
Hudson Valley Residential Price Evolution 2014-2018: Prices Contract in 39% of Hudson Valley Markets
Eliza Theiss | 5 minute read
Key Takeaways: Stanford leads Hudson Valley price evolution with 36% median growth. Deerpark undergoes biggest price contraction at 27%. Sales activity more than doubles in Union Vale and Dover Town. At $1.85 million, Rye has the highest median sale price in the Hudson Valley. Located on the doorstep of one of the most dynamic real estate markets in the world and home to a number of New York City’s inner suburbs, we were curious to see the Hudson Valley’s recent price evolution. Analyzing all residential sales in 2014 and 2018 in Dutchess, Orange, Putnam, Rockland, Ulster and Westchester counties, we found a mix of trends. Adjusting 2014 medians for inflation to home in on pure price trends, we found that the median sale price contracted in 45 of the 116 Hudson Valley hamlets, towns and cities we analyzed. While 66 markets – 57% – experienced growth, most of their medians went up by less than 10%. In fact, medians grew by 20% or more in only eight Hudson Valley markets; of these, only two climbed by more than 30%. The median sale price remained unchanged in five markets. Stanford and Beacon Grow Median by More Than 30% The most significant…
Key Takeaways:
- Stanford leads Hudson Valley price evolution with 36% median growth.
- Deerpark undergoes biggest price contraction at 27%.
- Sales activity more than doubles in Union Vale and Dover Town.
- At $1.85 million, Rye has the highest median sale price in the Hudson Valley.
Located on the doorstep of one of the most dynamic real estate markets in the world and home to a number of New York City’s inner suburbs, we were curious to see the Hudson Valley’s recent price evolution. Analyzing all residential sales in 2014 and 2018 in Dutchess, Orange, Putnam, Rockland, Ulster and Westchester counties, we found a mix of trends.
Adjusting 2014 medians for inflation to home in on pure price trends, we found that the median sale price contracted in 45 of the 116 Hudson Valley hamlets, towns and cities we analyzed. While 66 markets – 57% – experienced growth, most of their medians went up by less than 10%. In fact, medians grew by 20% or more in only eight Hudson Valley markets; of these, only two climbed by more than 30%. The median sale price remained unchanged in five markets.
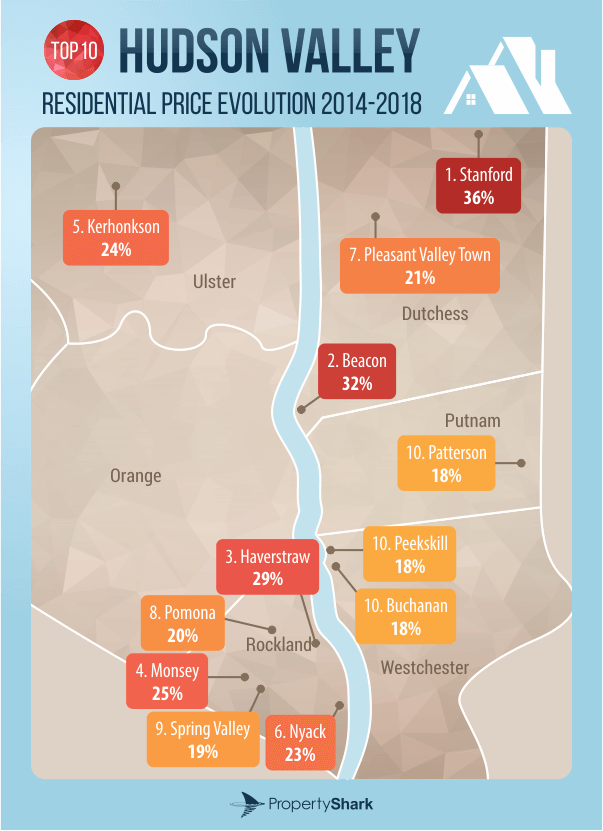
Stanford and Beacon Grow Median by More Than 30%
The most significant price growth took place in Dutchess County’s Stanford, where the median sale price jumped 36%, closing 2018 at $329,950. What’s more, Stanford’s median growth was also accompanied by a 17% spike in sales activity. The second-highest growth rate was recorded in Beacon, another Dutchess County market. Its sales activity was also on an upward curve, strengthening 35%.
Not to be outdone, Rockland County was the setting for the third-highest median sale price growth in the Hudson Valley: Haverstraw closed 2018 with a $255,000 median – 29% higher than in 2014.
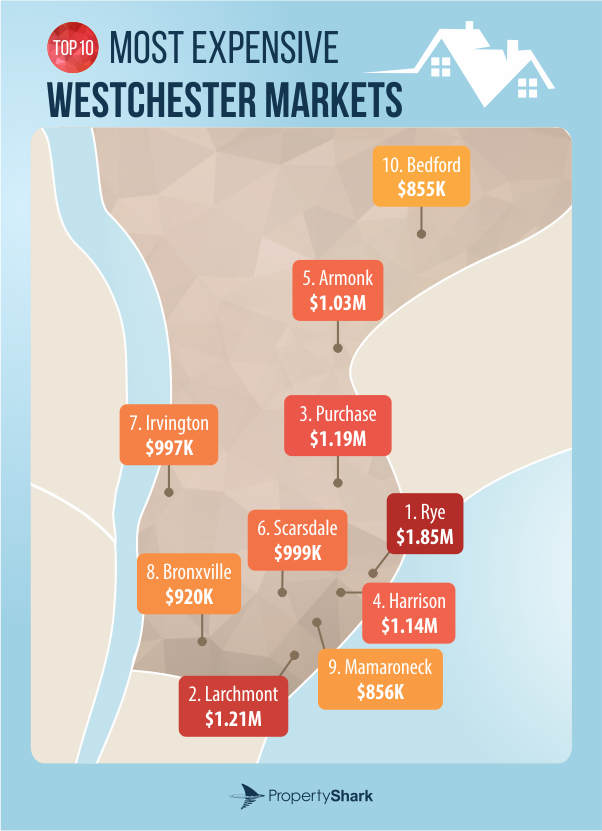
Looking at the Hudson Valley’s price growth from a dollar amount perspective, the leader was Westchester’s Rye. Its 9% growth rate translated to $151,000 – the largest dollar amount growth – bringing Rye’s 2018 median sale price to $1,850,000. That appreciation also made it the most expensive Hudson Valley community and ranked Rye’s 10580 zip code as the 59th most expensive in the nation.
Boosting its 2014 median by $119,000, Monsey was the second-fastest appreciating Hudson Valley community in terms of dollar amount growth. Specifically, the Rockland County market posted a $590,000 median sale price in 2018. While sales activity shrunk 14% in Monsey, Nyack saw 60% more sales close last year than five years prior. However, Nyack stood out not for its dynamic sales market, but for a $114,000 boost in its median. As such, in terms of sheer dollar amount, Nyack had the third-highest median sale price growth – posting a $610,000 median in 2018.
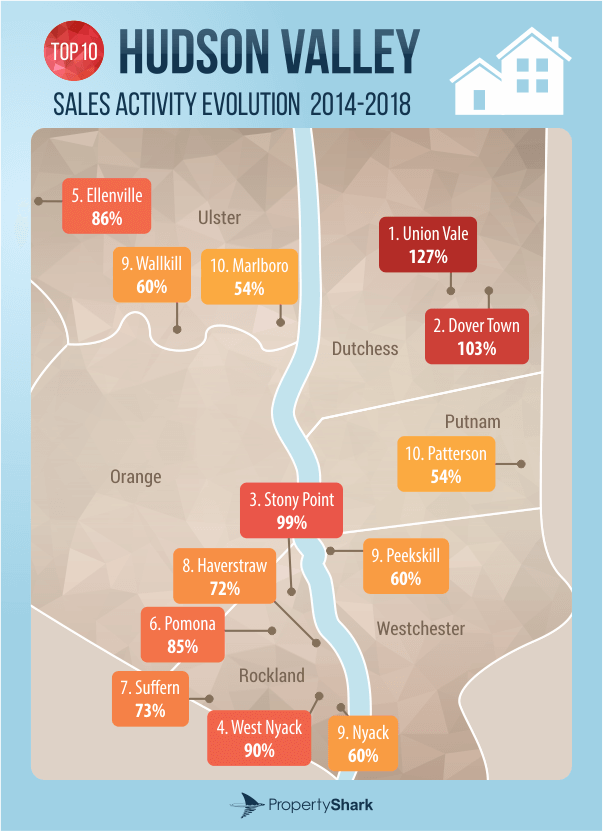
Union Vale and Dover Town Sales Activity More Than Doubles
Sales activity in 2018 matched 2014 levels in two markets and contracted in 46 markets. In particular, it accelerated in 68 Hudson Valley markets, 43 of which saw sales appreciations of 20% or more last year. In fact, 14 markets closed 50% or more sales in 2018 than five years prior. Of these, six markets turned up their sales activity by 85% or more.
Dutchess County’s Union Vale was the leader of sales activity expansion with a 127% growth rate, followed by the 103% increase in sales observed in another Dutchess community: Dover Town. While the latter also saw its median tick up – albeit by a mere 5% – Union Vale’s median was down 4% compared to 2014. Rockland County’s Stony Point rounded out the podium with a 99% increase in sales; its median was up 8% over its 2014 level.
Two-Thirds of Orange Markets See Medians Slide, While Rockland Sales Activity Ramps Up
The six counties analyzed for this report presented a varied picture: Westchester County provided the 28 highest median sale prices in Hudson Valley, Orange County saw medians drop in two-thirds of its markets, and Rockland County was the location for more than half of the 10 fastest-appreciating markets in the Hudson Valley.
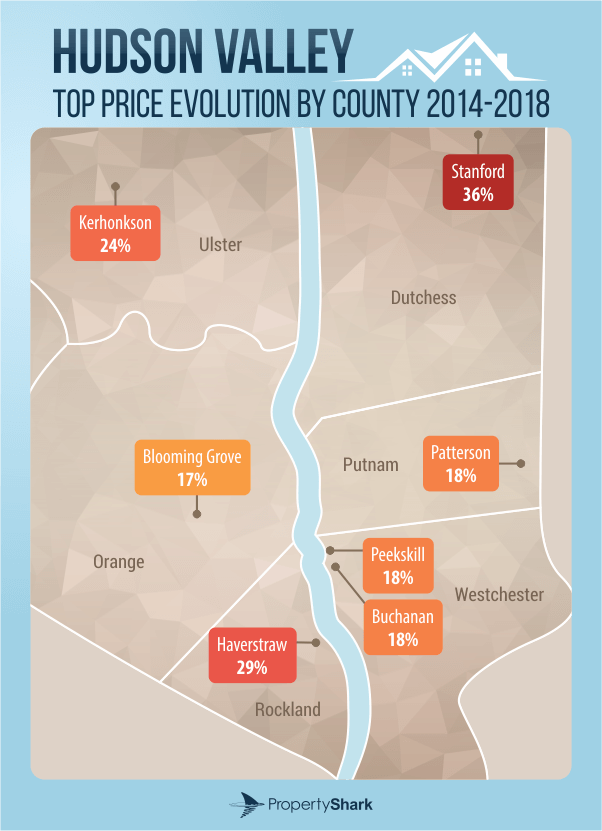
Rockland County’s top growth rate was 29%, recorded in Haverstraw, which was also the third-fastest appreciating Hudson Valley market. Rockland’s Monsey also stood out with its median appreciating 25%, as did Nyack at 23%. Pomona and Spring Valley were also among the 10 fastest-growing residential markets in the Hudson Valley, boosting their medians by 20% and 19%, respectively.
Putnam County’s top sales activity growth took place in Patterson, which was 54% more active last year than it was in 2014. Patterson was also the county’s fastest-appreciating market, both in terms of growth rate – 18% – and dollar amount – $44,000. Despite being the only Putnam County market in our analysis where the 2018 median was lower than five years prior, Philipstown easily remained the most expensive market, posting a median of $510,000. When adjusting for inflation, that translates into a 6% contraction compared to its 2014 figure.
Conversely, Orange County stood out for its sweeping price contractions. Of the 16 Orange County markets in our analysis, only five had higher medians last year than they did in 2014 and two-thirds underwent negative growth. While Blooming Grove’s 17% median hike was the county’s highest, Deerpark’s 27% drop was the most significant median sale price contraction across the entire Hudson Valley. Moreover, sales activity slowed across the county, without exception.
Westchester Commands Highest Medians, Ulster Boasts Most Affordable Markets
Dutchess County asserted itself with Stanford and Beacon – the leaders of price growth in the Hudson Valley; Union Vale and Dover Town, also in Dutchess County, were the leaders of sales activity growth in the Hudson Valley. Stanford and Beacon were Dutchess County’s top markets for price growth in terms of dollar amount, as well, but Rhinebeck Town and its $390,000 median were the county’s priciest.
Unsurprisingly, Westchester County claimed the most expensive markets in the Hudson Valley. When considering 2018 medians, Westchester was home to the 28 most expensive markets in the entire Hudson Valley and the only five markets where the median surpassed the $1 million mark – although Scarsdale’s $999,999 median nearly made it. This is not unexpected, considering its proximity to New York City and its much larger population. Despite this, the county’s highest growth rate – 18%, recorded in Buchanan and Peekskill – was only the 11th highest in the Hudson Valley.
Ulster County’s priciest community was Woodstock at nearly $340,000, but the most significant growth rate took place in Kerhonkson, where the median climbed 24%. But, Ulster County’s top growth rate in sales activity was a much more impressive 86%, recorded in affordable Ellenville. Here, 90 miles from New York City, the 2018 median was a comfortable $93,700.
Browse the table below for the full picture of the Hudson Valley’s residential price evolution:
| Municipality | County | 2014 Median Sale Price (Inflation-Adjusted) | 2014 Sales Activity | 2018 Median Sale Price | 2018 Sales Activity | 2014-2018 Median Sale Price Evolution | 2014-2018 Sales Activity Evolution |
|---|---|---|---|---|---|---|---|
| Stanford | Dutchess | $242,875 | 29 | $329,950 | 34 | 36% | 17% |
| Beacon | Dutchess | $254,109 | 103 | $335,000 | 139 | 32% | 35% |
| Haverstraw | Rockland | $197,403 | 25 | $255,000 | 43 | 29% | 72% |
| Monsey | Rockland | $470,910 | 222 | $590,163 | 192 | 25% | -14% |
| Kerhonkson | Ulster | $162,095 | 56 | $201,400 | 53 | 24% | -5% |
| Nyack | Rockland | $496,449 | 77 | $610,000 | 123 | 23% | 60% |
| Pleasant Valley Town | Dutchess | $228,953 | 84 | $276,000 | 83 | 21% | -1% |
| Pomona | Rockland | $445,092 | 54 | $535,950 | 100 | 20% | 85% |
| Spring Valley | Rockland | $395,875 | 216 | $470,000 | 309 | 19% | 43% |
| Patterson | Putnam | $238,167 | 92 | $281,750 | 142 | 18% | 54% |
| Buchanan | Westchester | $311,029 | 21 | $367,500 | 22 | 18% | 5% |
| Peekskill | Westchester | $267,483 | 156 | $315,000 | 250 | 18% | 60% |
| Blooming Grove | Orange | $235,385 | 152 | $275,000 | 100 | 17% | -34% |
| Woodstock | Ulster | $292,627 | 98 | $339,500 | 66 | 16% | -33% |
| Clinton | Dutchess | $304,503 | 46 | $350,000 | 49 | 15% | 7% |
| Olivebridge | Ulster | $213,987 | 25 | $245,500 | 28 | 15% | 12% |
| Hastings on Hudson | Westchester | $732,101 | 90 | $839,000 | 69 | 15% | -23% |
| Cortlandt Manor | Westchester | $371,534 | 208 | $425,000 | 253 | 14% | 22% |
| Kent | Putnam | $249,829 | 122 | $283,640 | 148 | 14% | 21% |
| Hamptonburgh | Orange | $318,840 | 43 | $360,000 | 23 | 13% | -47% |
| Ardsley | Westchester | $649,984 | 73 | $725,000 | 65 | 12% | -11% |
| Pelham | Westchester | $765,002 | 145 | $850,000 | 124 | 11% | -14% |
| Rhinebeck Town | Dutchess | $352,971 | 105 | $390,000 | 91 | 10% | -13% |
| Garnerville | Rockland | $306,268 | 50 | $337,000 | 71 | 10% | 42% |
| Mohegan Lake | Westchester | $323,655 | 57 | $354,500 | 74 | 10% | 30% |
| Hartsdale | Westchester | $567,064 | 115 | $620,000 | 99 | 9% | -14% |
| Hawthorne | Westchester | $513,568 | 45 | $561,500 | 46 | 9% | 2% |
| Yonkers | Westchester | $426,903 | 481 | $465,000 | 571 | 9% | 19% |
| Rye | Westchester | $1,698,518 | 226 | $1,850,000 | 199 | 9% | -12% |
| West Haverstraw | Rockland | $203,287 | 23 | $219,900 | 29 | 8% | 26% |
| Montgomery | Orange | $196,868 | 175 | $211,780 | 89 | 8% | -49% |
| Stony Point | Rockland | $357,892 | 81 | $385,000 | 161 | 8% | 99% |
| Putnam Valley | Putnam | $320,980 | 119 | $345,000 | 130 | 7% | 9% |
| Carmel | Putnam | $358,427 | 308 | $385,000 | 418 | 7% | 36% |
| Pleasantville | Westchester | $612,536 | 156 | $656,310 | 108 | 7% | -31% |
| Thiells | Rockland | $373,899 | 30 | $400,100 | 33 | 7% | 10% |
| Mount Vernon | Westchester | $406,842 | 180 | $435,000 | 232 | 7% | 29% |
| Wappinger Town | Dutchess | $267,403 | 195 | $283,847 | 247 | 6% | 27% |
| North Salem | Westchester | $450,009 | 47 | $477,500 | 55 | 6% | 17% |
| West Harrison | Westchester | $714,180 | 44 | $757,500 | 59 | 6% | 34% |
| Poughkeepsie Town | Dutchess | $230,193 | 285 | $244,000 | 431 | 6% | 51% |
| Larchmont | Westchester | $1,143,223 | 232 | $1,210,000 | 195 | 6% | -16% |
| Port Chester | Westchester | $596,487 | 230 | $630,000 | 229 | 6% | 0% |
| Dover Town | Dutchess | $196,864 | 34 | $207,239 | 69 | 5% | 103% |
| Mamaroneck | Westchester | $815,824 | 164 | $856,250 | 132 | 5% | -20% |
| New Paltz | Ulster | $288,882 | 125 | $303,000 | 129 | 5% | 3% |
| Blauvelt | Rockland | $506,078 | 34 | $530,000 | 43 | 5% | 26% |
| Valley Cottage | Rockland | $402,830 | 54 | $421,000 | 79 | 5% | 46% |
| Hyde Park Town | Dutchess | $201,506 | 138 | $210,500 | 198 | 4% | 43% |
| White Plains | Westchester | $583,113 | 383 | $607,000 | 409 | 4% | 7% |
| Ossining | Westchester | $406,574 | 171 | $420,000 | 208 | 3% | 22% |
| Goshen | Orange | $375,011 | 127 | $386,610 | 44 | 3% | -65% |
| Highland | Ulster | $217,832 | 102 | $224,500 | 142 | 3% | 39% |
| Yorktown Heights | Westchester | $427,973 | 309 | $439,000 | 295 | 3% | -5% |
| Wallkill | Orange | $267,671 | 239 | $273,870 | 103 | 2% | -57% |
| Nanuet | Rockland | $440,812 | 107 | $450,000 | 135 | 2% | 26% |
| Washington Town | Dutchess | $322,585 | 48 | $329,000 | 48 | 2% | 0% |
| Pearl River | Rockland | $422,623 | 104 | $430,000 | 112 | 2% | 8% |
| Accord | Ulster | $280,322 | 35 | $285,000 | 51 | 2% | 46% |
| Red Hook Town | Dutchess | $275,508 | 88 | $280,000 | 95 | 2% | 8% |
| Eastchester | Westchester | $721,670 | 95 | $732,500 | 72 | 2% | -24% |
| Tappan | Rockland | $467,561 | 48 | $474,500 | 57 | 1% | 19% |
| Harrison | Westchester | $1,123,429 | 77 | $1,135,000 | 81 | 1% | 5% |
| Southeast | Putnam | $326,864 | 161 | $329,774 | 191 | 1% | 19% |
| Pawling | Dutchess | $272,619 | 66 | $275,000 | 85 | 1% | 29% |
| Poughkeepsie | Dutchess | $189,213 | 146 | $190,275 | 180 | 1% | 23% |
| Hurley | Ulster | $226,826 | 47 | $227,500 | 54 | 0% | 15% |
| Cornwall | Orange | $304,931 | 91 | $304,452 | 40 | 0% | -56% |
| Dobbs Ferry | Westchester | $727,554 | 97 | $725,000 | 77 | 0% | -21% |
| New City | Rockland | $492,169 | 266 | $490,000 | 308 | 0% | 16% |
| New Rochelle | Westchester | $652,659 | 291 | $649,500 | 364 | 0% | 25% |
| Middletown | Orange | $160,169 | 182 | $159,250 | 78 | -1% | -57% |
| Warwick | Orange | $293,964 | 282 | $292,000 | 144 | -1% | -49% |
| Bedford Hills | Westchester | $631,260 | 47 | $625,341 | 32 | -1% | -32% |
| Tarrytown | Westchester | $625,911 | 119 | $620,000 | 81 | -1% | -32% |
| Congers | Rockland | $418,611 | 58 | $414,500 | 70 | -1% | 21% |
| Croton on Hudson | Westchester | $555,295 | 114 | $549,500 | 106 | -1% | -7% |
| Chester | Orange | $263,613 | 111 | $258,530 | 53 | -2% | -52% |
| East Fishkill Town | Dutchess | $375,814 | 301 | $368,000 | 406 | -2% | 35% |
| Monroe | Orange | $326,329 | 367 | $318,125 | 138 | -3% | -62% |
| Kingston | Ulster | $166,909 | 249 | $162,500 | 313 | -3% | 26% |
| Armonk | Westchester | $1,061,908 | 126 | $1,033,750 | 102 | -3% | -19% |
| Valhalla | Westchester | $556,365 | 69 | $540,500 | 44 | -3% | -36% |
| Elmsford | Westchester | $406,085 | 57 | $394,375 | 64 | -3% | 12% |
| Irvington | Westchester | $1,033,435 | 89 | $997,125 | 66 | -4% | -26% |
| Wallkill | Ulster | $227,254 | 72 | $218,338 | 115 | -4% | 60% |
| Marlboro | Ulster | $206,497 | 52 | $198,000 | 80 | -4% | 54% |
| Union Vale | Dutchess | $316,165 | 30 | $303,000 | 68 | -4% | 127% |
| Saugerties | Ulster | $195,263 | 138 | $184,955 | 176 | -5% | 28% |
| Philipstown | Putnam | $540,214 | 126 | $510,000 | 137 | -6% | 9% |
| Katonah | Westchester | $716,855 | 121 | $675,000 | 103 | -6% | -15% |
| Tuckahoe | Westchester | $655,066 | 74 | $615,542 | 77 | -6% | 4% |
| Beekman | Dutchess | $304,128 | 110 | $285,000 | 143 | -6% | 30% |
| Newburgh | Orange | $209,707 | 373 | $196,500 | 148 | -6% | -60% |
| La Grange Town | Dutchess | $303,492 | 153 | $282,947 | 195 | -7% | 27% |
| Crawford | Orange | $246,753 | 72 | $230,000 | 27 | -7% | -63% |
| Suffern | Rockland | $449,372 | 144 | $418,001 | 249 | -7% | 73% |
| Briarcliff Manor | Westchester | $785,865 | 92 | $729,250 | 100 | -7% | 9% |
| Chappaqua | Westchester | $909,443 | 164 | $840,000 | 137 | -8% | -16% |
| Somers | Westchester | $601,302 | 53 | $542,000 | 55 | -10% | 4% |
| Purchase | Westchester | $1,337,416 | 49 | $1,194,500 | 48 | -11% | -2% |
| Orangeburg | Rockland | $502,333 | 36 | $446,900 | 52 | -11% | 44% |
| Thornwood | Westchester | $620,561 | 56 | $545,000 | 47 | -12% | -16% |
| New Windsor | Orange | $254,425 | 238 | $223,430 | 113 | -12% | -53% |
| Ellenville | Ulster | $106,766 | 36 | $93,700 | 67 | -12% | 86% |
| Woodbury | Orange | $385,176 | 108 | $335,500 | 66 | -13% | -39% |
| Fishkill Town | Dutchess | $333,731 | 271 | $290,000 | 235 | -13% | -13% |
| Bedford | Westchester | $989,688 | 78 | $854,730 | 96 | -14% | 23% |
| West Nyack | Rockland | $572,548 | 40 | $491,000 | 76 | -14% | 90% |
| Scarsdale | Westchester | $1,171,041 | 550 | $999,999 | 440 | -15% | -20% |
| Pound Ridge | Westchester | $880,020 | 80 | $745,000 | 87 | -15% | 9% |
| Port Jervis | Orange | $106,848 | 69 | $86,000 | 29 | -20% | -58% |
| South Salem | Westchester | $633,935 | 52 | $500,000 | 46 | -21% | -12% |
| Mount Kisco | Westchester | $821,173 | 120 | $616,000 | 130 | -25% | 8% |
| Bronxville | Westchester | $1,230,422 | 183 | $920,000 | 142 | -25% | -22% |
| Deerpark | Orange | $157,970 | 52 | $115,335 | 30 | -27% | -42% |
Methodology:
For this study, we defined the Hudson Valley as the counties of Dutchess, Orange, Putnam, Rockland, Ulster and Westchester.
To determine the evolution of residential prices, we considered all residential transactions closed in 2014 and 2018 in 116 towns, cities, hamlets and CDPs, taking into consideration single-family homes, condo units and co-op units. All package deals were excluded. In order to ensure reliable price trend data, we set a minimum of 20 sales per year per location.
We individually calculated the median sale price for each location; 2014 prices were adjusted for inflation using the Bureau of Labor Statistics calculator.
Want to stay on top of the real estate market?
Access comprehensive property data and ownership information with intuitive research tools.
POSTED IN: Market Studies, New York Real Estate

Eliza Theiss is a senior writer reporting real estate trends in the US. Her work has been cited by CBS News, Curbed, The Los Angeles Times, and Forbes among others. With an academic background in journalism, Eliza has been covering real estate since 2012. Before joining PropertyShark, Eliza was an associate editor at Multi-Housing News and Commercial Property Executive. She has also contributed extensively to CommercialEdge. Reach her at [email protected]
Recent Reports

2026 Q2 Foreclosure Report: Bronx Caseload Hits 7-Year High, Brooklyn & Manhattan Slow to 4-Year Low
Manhattan yet again slowed to become the city’s least active foreclosure market, Brooklyn’s caseload dropped so low it barely edged out Staten Island, while the Bronx heated up enough to surpass all boroughs except Queens.

NYC Resale Gains & Losses: Every Borough Made Money in 2025, Except Manhattan
In 2025, NYC home-sellers mostly made money. But, in Manhattan, resales came with losses — and it was apartments and recent buyers that absorbed them.

World Cup or Your Mortgage/Rent? Ticket Prices Rival Host City Housing Costs
World Cup ticket prices rival monthly housing expenses in the 11 U.S. host cities, with even the cheapest seats covering weeks or even months of rent or mortgage payments.