
RELEASED ON January 14, 2020
At Almost $4 Million,Hudson Yards Surpasses Tribeca As NYC’s Priciest Neighborhood
Andreea Popescu | 4 minute read
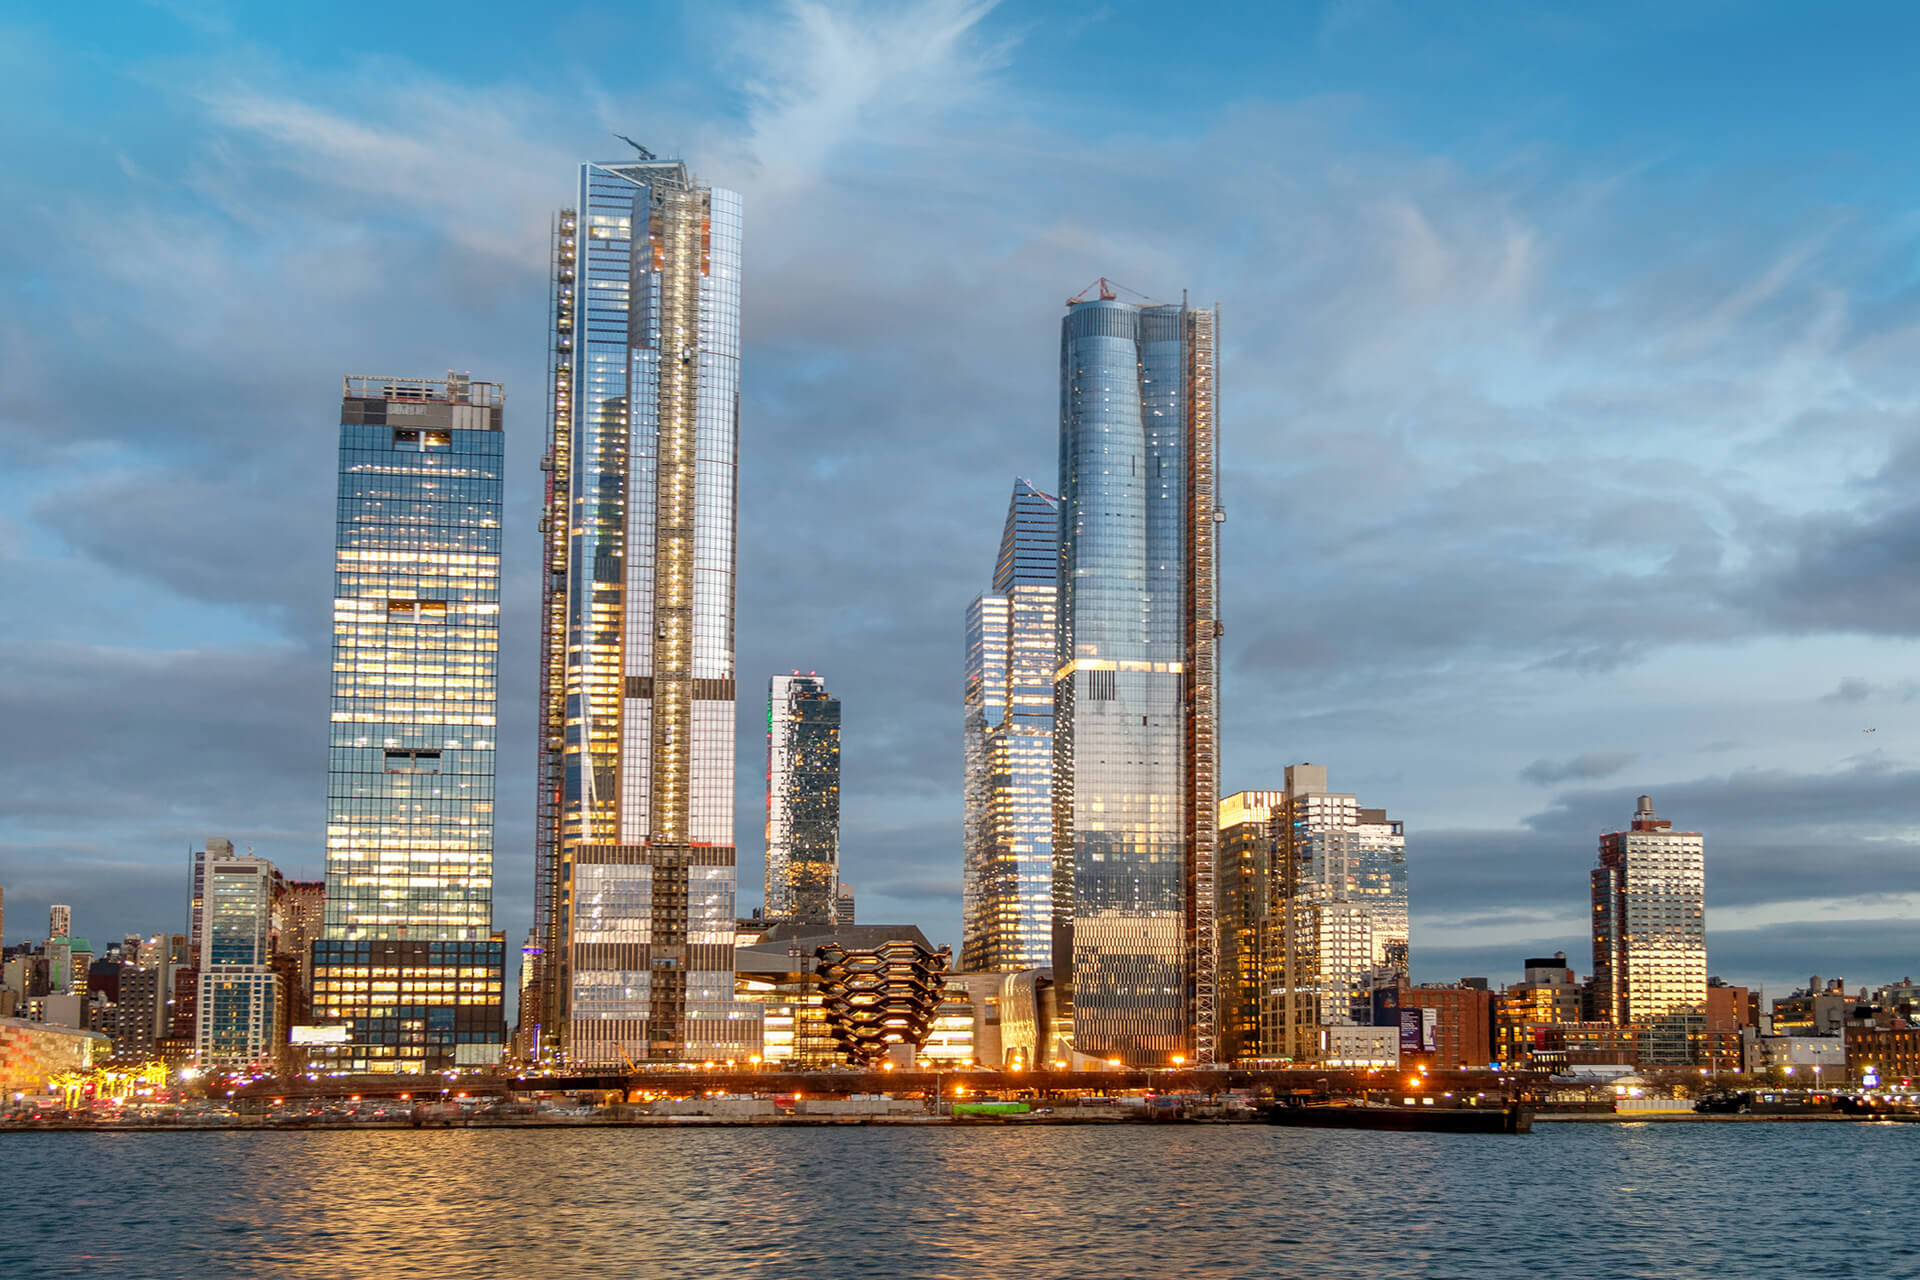
Hudson Yards’ nearly $4 million price put Tribeca squarely in second place. pushing SoHo to third.
Key Takeaways:
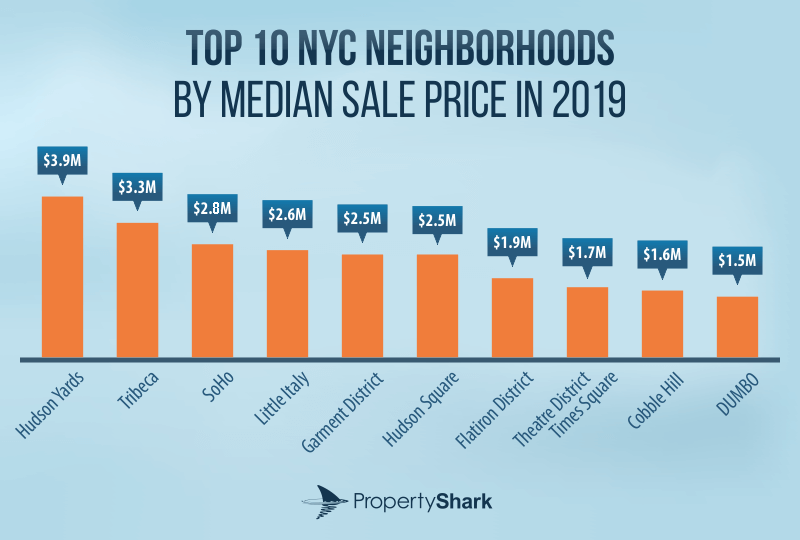
- Hudson Yards is NYC’s most expensive neighborhood with a $3.9 million median sale price.
- Tribeca, NYC’s 2nd-priciest neighborhood, has a $3.3 million median sale price.
- Little Italy soars to 4th place with a 100% year-over-year price increase.
- Cobble Hill overtakes DUMBO’s lead in Brooklyn with an 82% Y-o-Y boost.
- Queens’ Malba ties with Manhattan’s Upper West Side and Brooklyn’s Park Slope at a $1.1 million median sale price.
Once again, PropertyShark has crunched the numbers for our annual report of New York City’s 50 most expensive neighborhoods. Due to several ties in median sale prices, the 2019 list actually includes 54 neighborhoods. Three of NYC’s five boroughs made the cut: Manhattan with 24 neighborhoods, followed closely by Brooklyn with 20 and Queens with 10. In addition to the most entries on the list, Manhattan also boasted the highest median sale prices. However, interesting new developments in all three boroughs call for a detailed analysis.
Hudson Yards Takes Tribeca’s Most Expensive Title
Hudson Yards’ nearly $4 million price put Tribeca squarely in second place. NYC’s costliest neighborhood since 2015, Tribeca’s drop is part of a downward trend in the affluent area for the past two years; prices slid 18% in 2018 and 15% in 2019. In fact, medians dropped more than $1 million – from $4.7 million in 2017 to $3.3 million this year. For Hudson Yards, this is part of a rapid rise to the top after coming in second place in Q2 and then rising to first place in both Q3 and at the end of the year. Subsequently, SoHo, a staunch second runner-up since 2016, dropped to third place.
Little Italy and Theatre District Record Largest Hikes in Manhattan
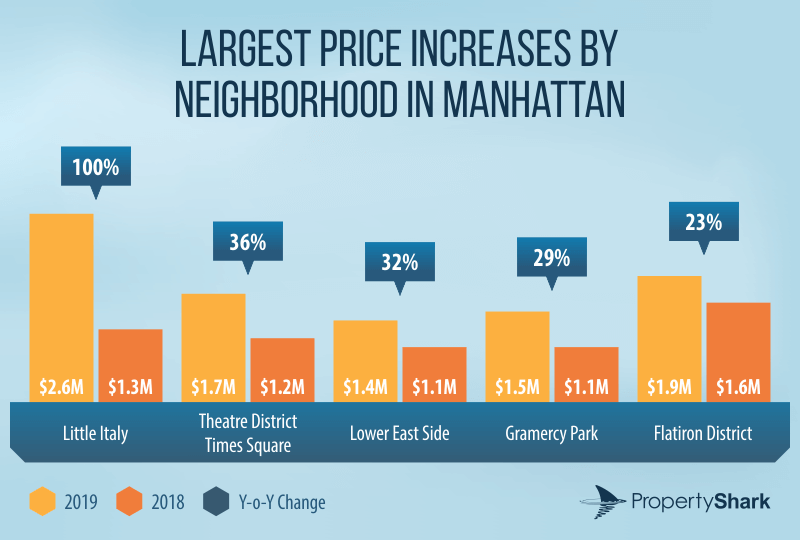
Little Italy saw a whopping 100% Y-o-Y increase, from $1.3 million to $2.6 million. The uptick can be attributed to 17 transactions that were below $300,000 – registered at 244-246 Elizabeth Street – that influenced the median selling price in 2018. Then, a year later, two units sold at Puck building were among the most notable transactions in 2019, amounting to $18 million each.
Along the same lines, Theater District-Times Square prices rose 36% – from $1.2 million to $1.7 million; in particular, they were spurred by the sale of 50 units in the ultra-luxury tower at 220 Central Park on Billionaire’s Row for a $23.6 million median.
Prices in Lower East Side, Grammercy Park and Flatiron District Increase Over 20%
The Lower East Side climbed 32%, from $1.1 million to $1.4 million. Aiding the growth from 25th to 13th place was the sale of 244 units for a $1.5 million median at One Manhattan Square.
Similarly, Gramercy Park’s median price increased 29% Y-o-Y, closing out the year with a nearly $1.5 million median. The neighborhood’s sales activity also recorded a spike of 40% – going from 291 closed transactions in 2018 to 406 in 2019.
The Flatiron District’s median price also grew in 2019 – from $1.6 million to $1.9 million – for a 23% gain. Influencing growth here was the sale of 58 units at 277 5th Avenue, with a median sales price of $2.9 million.
East and West Villages Undergo Double-Digit Decreases Y-o-Y
The West Village dropped 27% from $1.7 million to $1.3 million. This is due to escalated 2018 prices from the sales at 160 Leroy Street and 100 Barrow Street, which logged median prices of $5.6 million and $3.2 million, respectively. Likewise, the East Village declined by 15%, falling to $999,999 from its $1.2 million median in 2018.
DUMBO Loses Lead as Cobble Hill Captures Top Spot in Brooklyn
With a significant 82% Y-o-Y gain, Cobble Hill rose to Brooklyn’s top spot with a $1.6 million median price. Contributing to the surge in 2019 were 24 sales at The Cobble Hill House (with a $2.2 million median) and 12 sales at Polhemus that registered a $4.3 million median.
Consequently, DUMBO and Boerum Hill – the first- and second-most expensive Brooklyn neighborhoods for two years straight – lost their respective spots in 2019. DUMBO dipped 20% and Boerum Hill dropped 33%, with medians of $1.5 million and $1.1 million, respectively.
Queens’ Malba Ties with Upper West Side and Park Slope as Ditmars-Steinway Claims 2019’s Biggest Price Increase
Specifically, the Ditmars- Steinway median sale price rose to $990,000, equating to a 102% Y-o-Y hike. This is likely because, in 2019, 84% of transactions were single-family homes, while in 2018, almost half of sales were co-ops at Acropolis Gardens co-ops with a $355,000 median.
Malba tied with Manhattan’s Upper West Side and Brooklyn’s Park Slope at a $1.1 million median sale price. In fact, in 2019, Malba dethroned Hunters Point as the most expensive neighborhood in Queens.
| # | Borough | Neighborhood | Median Sale Price 2019 | Y-o-Y Change | No. of Transactions |
|---|---|---|---|---|---|
| 1 | Manhattan | Hudson Yards | $3,929,223 | - | 152 |
| 2 | Manhattan | Tribeca | $3,259,100 | -15% | 406 |
| 3 | Manhattan | SoHo | $2,750,000 | -8% | 116 |
| 4 | Manhattan | Little Italy | $2,632,500 | 100% | 28 |
| 5 | Manhattan | Garment District | $2,500,000 | 7% | 29 |
| 6 | Manhattan | Hudson Square | $2,464,165 | 15% | 105 |
| 7 | Manhattan | Flatiron District | $1,930,000 | 23% | 367 |
| 8 | Manhattan | Theatre District - Times Square | $1,680,127 | 36% | 207 |
| 9 | Brooklyn | Cobble Hill | $1,640,000 | 82% | 93 |
| 10 | Brooklyn | DUMBO | $1,500,000 | -20% | 55 |
| 11 | Manhattan | Gramercy Park | $1,479,008 | 29% | 406 |
| 12 | Brooklyn | Carroll Gardens | $1,440,625 | 18% | 90 |
| 13 | Manhattan | Lower East Side | $1,418,328 | 32% | 479 |
| 14 | Manhattan | Greenwich Village | $1,400,000 | 4% | 483 |
| 15 | Brooklyn | Greenpoint | $1,295,000 | 6% | 203 |
| 16 | Manhattan | West Village | $1,258,500 | -27% | 252 |
| 17 | Manhattan | Central Midtown | $1,241,270 | -5% | 218 |
| 18 | Manhattan | Chelsea | $1,220,000 | -5% | 482 |
| 19 | Brooklyn | Columbia Street Waterfront District | $1,205,000 | 31% | 46 |
| 20 | Manhattan | Battery Park City | $1,200,000 | 8% | 119 |
| 21 | Brooklyn | Gowanus | $1,189,000 | -3% | 45 |
| 22 | Manhattan | Upper East Side | $1,174,250 | -2% | 2,118 |
| 23 | Brooklyn | Manhattan Beach | $1,157,500 | 18% | 33 |
| 24 | Manhattan | Upper West Side | $1,100,000 | -6% | 1,897 |
| 24 | Brooklyn | Park Slope | $1,100,000 | -2% | 400 |
| 24 | Queens | Malba | $1,100,000 | - | 15 |
| 25 | Brooklyn | Boerum Hill | $1,090,000 | -33% | 70 |
| 26 | Manhattan | Sutton Place | $1,075,000 | 13% | 201 |
| 27 | Brooklyn | Fort Greene | $1,070,000 | -8% | 113 |
| 28 | Manhattan | Roosevelt Island | $1,064,500 | -11% | 28 |
| 29 | Brooklyn | Prospect Heights | $1,050,000 | -7% | 215 |
| 30 | Manhattan | East Village | $999,999 | -15% | 222 |
| 31 | Manhattan | Financial District | $998,888 | 0% | 259 |
| 32 | Queens | Hunters Point | $995,849 | 15% | 213 |
| 33 | Queens | Ditmars - Steinway | $990,000 | 102% | 25 |
| 34 | Brooklyn | Williamsburg | $982,500 | 5% | 532 |
| 35 | Brooklyn | Greenwood Heights | $943,669 | -2% | 58 |
| 36 | Brooklyn | Mill Basin | $935,000 | -5% | 33 |
| 37 | Queens | Neponsit | $934,350 | - | 17 |
| 38 | Brooklyn | Brooklyn Heights | $900,000 | -10% | 191 |
| 39 | Queens | Queensboro Hill | $885,000 | 3% | 49 |
| 40 | Manhattan | Clinton - Hell's Kitchen | $875,000 | -8% | 335 |
| 41 | Queens | Fresh Meadows | $850,000 | 3% | 139 |
| 41 | Queens | East Flushing | $850,000 | -3% | 79 |
| 41 | Queens | Belle Harbor | $850,000 | -3% | 27 |
| 42 | Manhattan | Turtle Bay | $845,000 | 0% | 305 |
| 43 | Brooklyn | Dyker Heights | $840,000 | -7% | 85 |
| 44 | Brooklyn | Downtown Brooklyn | $830,000 | -5% | 193 |
| 45 | Queens | Auburndale | $805,000 | -4% | 140 |
| 46 | Manhattan | Chinatown | $804,754 | 1% | 42 |
| 47 | Brooklyn | Borough Park | $802,000 | -1% | 144 |
| 48 | Queens | Rockwood Park | $765,000 | 10% | 67 |
| 49 | Brooklyn | Clinton Hill | $757,500 | -1% | 158 |
| 50 | Brooklyn | Madison | $755,000 | 8% | 81 |
Methodology
All prices expressed in the study are median home sale prices calculated based on residential property sales that closed between January 1 and December 31, 2019. The properties included in the statistics were single-family homes, condominiums and co-ops. Package deals were not included. Neighborhoods with fewer than 15 transactions were excluded.
Want to stay on top of the real estate market?
Access comprehensive property data and ownership information with intuitive research tools.
POSTED IN: Market Studies, New York Real Estate

Andreea Popescu is a copywriter with ten years of legal experience, including real estate and marketing. She is an ABA-certified paralegal and has an MBA with a concentration in Marketing from California State University, Northridge. She worked as a legal manager at a marketing firm and as a legal writer. Currently, Andreea brings her combined knowledge of the fields to report on real estate developments for CommercialEdge and PropertyShark. Reach her at [email protected].
Recent Reports
Locked-In Owners, Mobile Renters: Homeowners Stay Put as Renters Move 3.7x More Across Largest U.S. Cities
Renters became the primary drivers of long-distance mobility across the largest U.S. cities, moving 3.7 times more than owners in 2024, as high mortgage rates and housing costs kept many homeowners in place.
$4.6M Hudson Yards Maintains Top Spot, Luxury Sales in Malba Set $2.5M Price Record for Queens
Despite prices declining, Hudson Yards remained the most expensive NYC neighborhood, but TriBeCa’s growth closed the gap to under $400,000, while Malba set a new historic price record for Queens at $2.5 million, securing the highest ranking ever for the borough at #5.
2026 Q1 Foreclosure Report: Brooklyn Filings Fall Sharply, Bronx & Staten Island Hit New Peaks
Behind a deceptively mild citywide downtick, borough foreclosure markets pulled into significantly diverging paths as Brooklyn cases were nearly halved and the Bronx hit a new, record high. Meanwhile, Queens remained unchanged, Staten Island surged back up and Manhattan cooled slowly.