

RELEASED ON October 12, 2021
Top 50 Most Expensive NYC Neighborhoods: Hudson Yards & TriBeCa Maintain Top Spots
Patrick McGregor | 8 minute read
Sales activity skyrocketed in Q3 2021, while prices, too, were more spread out, but they continued to rise among NYC's 50 priciest neighborhoods.
Key Takeaways:
- Hudson Yards holds top spot for second consecutive quarter with $4.35 million median, TriBeCa maintains #2 at $3.35 million median
- Overall, transactions in NYC are up 145% Y-o-Y and up 35% over Q3 2019 to 10,268
- City median prices climbs 16% Y-o-Y and 16% over 2019 to $755,000
- Increasing prices push 35 neighborhoods past the $1 million mark, including five north of $2 million
- Manhattan claims seven of the 10 most expensive NYC neighborhoods, Battery Park City jumps 134% Y-o-Y to $1.75 million median
- Sales accelerate in Brooklyn as overall borough prices increase 16% Y-o-Y
- Belle Harbor and Hunters Point in Queens jump 22% and 19%, respectively, to cross the $1 million mark
In the early days of COVID-19, the city that never sleeps was eerily quiet. But what has transpired since then has been quite the turnaround: After nearly a year of on-and-off closures and lockdowns, as well as widely available vaccinations, buyer appetite has taken off. Specifically, 10,268 residential sales closed in Q3 2021 across the city, marking an impressive 145% year-over-year (Y-o-Y) increase compared to the pandemic-depressed figures of Q3 2020. At the same time, prices continued their upward trend in Q3 with the NYC median home sale price coming in at $755,000 — up 16% Y-o-Y and 16% higher than Q3 2019.
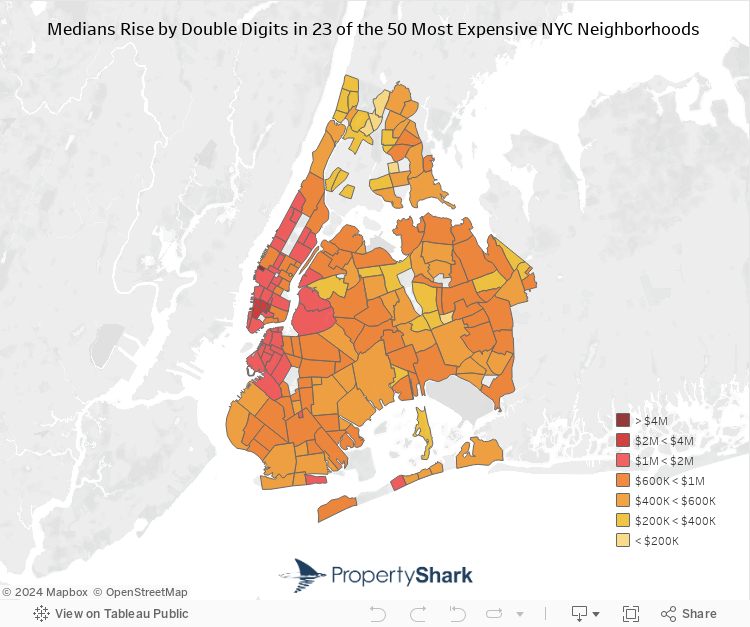
In fact, in the 50 most expensive neighborhoods in NYC (which are actually represented by 57 neighborhoods due to a number of ties), prices and transaction volume picked up across most of them, although not all: 26 neighborhoods heated up — 23 of which rose at double-digit rates, including two locations in which the median sale price rose by more than 50%, as well as one that more than doubled.
Conversely, 18 neighborhoods experienced year-over-year declines in median prices. Of those, 11 were located in Manhattan and the other seven were in Brooklyn. Year-over-year figures were unavailable for 12 neighborhoods due to an insufficient number of closed sales in Q3 2020.
Explore the interactive map below for at-a-glance price and sales insights into NYC’s most expensive neighborhoods in Q3 2021:
42 of the 57 neighborhoods in our ranking of the priciest neighborhoods in the city experienced double-digit year-over-year gains in sales activity. Of the remainder, only one neighborhood — Belle Harbor in Queens — saw sales activity decline, while one was flat year-over-year — Hudson Yards in Manhattan. Within those that recorded gains, 35 neighborhoods more than doubled their sales year-over-year, and 22 neighborhoods closed more than three times as many residential sales as they did in Q3 2020. Surprisingly, three areas even quadrupled their sales volume compared to last year, and one increased nearly 900% — Hudson Square in Manhattan.
Granted, it should be noted that sales activity in Q3 2020 had fallen to remarkable lows. Therefore, the year-over-year increases in sales activity were largely due to a return to pre-pandemic levels. However, pent-up demand from 2020’s depressed market clearly whetted the appetite of those who are now more motivated to buy as the economic outlook improves and the pandemic wanes.
Manhattan Claims 7 of 10 Most Expensive NYC Neighborhoods, Battery Park City in Brooklyn Jumps 134% to #8
The 57 neighborhoods that posted the 50 highest median sale prices in Q3 were dominated by Manhattan and Brooklyn, with 24 and 22 entries, respectively. Queens also supplied 11 neighborhoods, which is par for the course for the borough. And, while Manhattan’s domination of the top 10 most expensive neighborhoods in the city is also a usual occurrence, its domination waned slightly this quarter, dropping to seven out of the top 10 neighborhoods — down from nine last quarter.
Sales in Hudson Yards have been surging for most of year, despite the fact that Q3 saw a bit of tapering. Overall, Hudson Yards closed the quarter with a median sale price of $4,354,000 — slightly below the median price in Q3 2020. And, even though prices fell 2% Y-o-Y, the high-flying neighborhood still remains the #1 most expensive neighborhood in NYC by a wide margin. However, the volume of transactions has yet to return to the buying frenzy that occurred in the lead up to the mansion tax, closing nine this quarter.
Another staple in the priciest neighborhoods list comes in right behind Hudson Yards: TriBeCa was the second-most expensive neighborhood in NYC in Q3 2021 with a median sale price of $3,350,000 — a 3% Y-o-Y increase. Here, sales volumes were up 154% Y-o-Y with nearly 100 sales. For comparison, TriBeCa closed only 39 sales in Q3 2020. With that in mind, it’s evident that the increase in activity this quarter reveals that the neighborhood has bounced back to its pre-pandemic levels of activity.
Meanwhile, as sales ramped up across the city, SoHo followed suit by coming in at the #3 most expensive NYC neighborhood. SoHo’s median sale price fell 16% Y-o-Y, coming in at $2,850,000. The drop is partially due to transaction volume nearly quadrupling, showcasing the neighborhood’s resilience and resurgence. Last year, the small number of transactions were focused on luxury condos which drove up the median price. The increase in transaction volume this quarter saw co-op sales account for a larger portion than last year, bringing the median price lower.
Not far behind, Little Italy comes in at #4 with a median sale price of $2.5 million. However, due to a significant slowdown in sales activity during the same quarter last year, there isn’t sufficient data to compare year-over-year. Even so, 11 transactions this quarter is encouraging for a neighborhood that didn’t have any during the same timeframe last year.
Hudson Square follows Little Italy and jumps to #5 with a $2,026,000 median — which is surprising considering that the neighborhood fell 28% Y-o-Y. Of course, part of the drop is due to the sheer volume of transactions compared to the same period last year which saw just nine sales, most of which were for luxury condos at two recently completed buildings. Nevertheless, sales activity in Hudson Square returned dramatically, recording 89 sales in Q3 2021 — an incredible 889% increase in transaction volume over Q3 2020. More than half the sales were at 77 Charlton, completed last year, and the median sale price of those sales was $1,551,000, below the median of the neighborhood.
Next up is DUMBO at #6 with a $1,818,000 median, slightly below year-ago figures. There were 39 transactions in the neighborhood, up 414% over Q3 2020 when there were just seven. Seven of those sales were at the brand-new luxury loft condo building at 168 Plymouth and were all more than $2 million.
At #7, the Flatiron District came in 12% above year-ago figures and settled at $1,765,000. Its sales activity was impressive, as well: Sales in the neighborhood surged 393% Y-o-Y this quarter, increasing from 30 in Q3 2020 to 148 in Q3 2021.
Likewise, prices in Battery Park City jumped 134% Y-o-Y, surging to $1.75 million to secure the #8 most expensive NYC neighborhood position. Rounding out the top 10, the small neighborhood of Fiske Terrace came in at #9 with a median of $1.65 million, and Carroll Gardens wrapped up the list with its $1,596,000 median.
Manhattan Sales Up 221% Y-o-Y, Price Growth Tops 16% Y-o-Y in Brooklyn
As expected, Manhattan remained the most expensive borough by a wide margin, despite the fact that prices grew only 2% Y-o-Y. Still, the borough clocked in a median sale price of $1.1 million — the second quarter in a row above the $1 million threshold.
Transaction activity also returned to Manhattan, jumping 221% after sales fell off sharply during the same period last year. This year, the borough recorded 4,281 sales boroughwide, and Manhattan’s Q3 sales activity was an astonishing 60% higher than Q3 2019 (before the pandemic).
And, while Brooklyn didn’t experience the dramatic downturn in sales activity that Manhattan did, the borough is still ramping up, nonetheless. In fact, Brooklyn recorded 2,544 sales in Q3 2021, representing an increase of 153% Y-o-Y, as well as 42% above the same period in 2019. Sale prices in the borough also increased 16% over Q3 2020 to land at $810,000. Interestingly, the co-op median sale price in Brooklyn increased 37% — a larger than usual jump as the borough becomes more popular — significantly adding to the overall median sale price in Brooklyn.
In particular, Fiske Terrace — a small, historical neighborhood near Prospect Park in Brooklyn — recorded four single-family home sales and one co-op sale, giving it a median sale price of $1.65 million. The neighborhood was also the second-most expensive in Brooklyn and the ninth-most expensive neighborhood in NYC overall.
Not to be outdone, newcomer to the list Vinegar Hill was the fourth-most expensive neighborhood in Brooklyn and #11 in NYC overall. The small neighborhood directly east of DUMBO has been undergoing significant development — and the sale prices reflect that. Here, six sales closed in the neighborhood for a median sale price of $1,543,000.
To the north, Queens’ prices actually grew more than Brooklyn’s, with the borough’s median sale price rising 17% to reach $580,000 — 15% higher than the $504,000 median recorded in Q3 2019. Sales activity here also continues to recover: The borough closed 2,928 sales in Q3 2021, an increase of 89% Y-o-Y. Queens also surpassed its pre-pandemic transaction volume, albeit at a slower pace than Manhattan and Brooklyn. Even so, the borough closed 14% more transactions than Q3 2019.
Of the 11 neighborhoods that ranked among the city’s 50 priciest in Q3 2021, five — Malba, Queensboro Hill, Hollis Hills, Breezy Point and Douglaston — had such depressed sales activity in Q3 2020 that accurate metrics could not be identified. As a result, reliable year-over-year changes couldn’t be determined here, either.
Finally, Belle Harbor was the #1 most expensive Queens neighborhood, rising 22% Y-o-Y and crossing the $1 million mark to settle at $1.15 million, even though transaction volume fell 50% Y-o-Y. Hunters Point also crossed that metric with a $1,064,000 median. After Hunters Point, Fresh Meadows and Malba were the borough’s next-most expensive neighborhoods with medians of $978,000 and $975,000, respectively.
Explore the interactive table below for our snapshot of New York City’s 50 most expensive neighborhoods in Q3 2021:
| Rank | Borough | Neighborhood | Median Sale Price Q3 2021 | Y-o-Y Change | Number of Sales Q3 2021 | Y-o-Y Change |
|---|---|---|---|---|---|---|
| 1 | Manhattan | Hudson Yards | 4354000 | -2% | 9 | 0% |
| 2 | Manhattan | TriBeCa | 3350000 | 3% | 99 | 154% |
| 3 | Manhattan | SoHo | 2850000 | -16% | 39 | 290% |
| 4 | Manhattan | Little Italy | 2500000 | - | 11 | - |
| 5 | Manhattan | Hudson Square | 2026000 | -28% | 89 | 889% |
| 6 | Brooklyn | DUMBO | 1818000 | -1% | 36 | 414% |
| 7 | Manhattan | Flatiron District | 1765000 | 12% | 148 | 393% |
| 8 | Manhattan | Battery Park City | 1750000 | 134% | 49 | 277% |
| 9 | Brooklyn | Fiske Terrace | 1650000 | - | 5 | - |
| 10 | Brooklyn | Carroll Gardens | 1596000 | 0% | 34 | 386% |
| 11 | Brooklyn | Vinegar Hill | 1543000 | - | 6 | - |
| 12 | Manhattan | Theatre District - Times Square | 1525000 | -55% | 74 | 90% |
| 13 | Brooklyn | Cobble Hill | 1358000 | -3% | 32 | 357% |
| 14 | Manhattan | Chelsea | 1302000 | 31% | 214 | 376% |
| 15 | Manhattan | Garment District | 1298000 | - | 8 | - |
| 15 | Manhattan | West Village | 1298000 | -2% | 101 | 226% |
| 16 | Manhattan | Chinatown | 1275000 | - | 8 | - |
| 17 | Brooklyn | Boerum Hill | 1230000 | 32% | 47 | 370% |
| 18 | Manhattan | Greenwich Village | 1223000 | 11% | 186 | 195% |
| 19 | Brooklyn | Manhattan Beach | 1200000 | 14% | 11 | 120% |
| 19 | Brooklyn | Park Slope | 1200000 | 4% | 187 | 234% |
| 20 | Brooklyn | Downtown Brooklyn | 1175000 | 29% | 114 | 217% |
| 20 | Manhattan | Upper East Side | 1175000 | -2% | 907 | 197% |
| 21 | Brooklyn | Greenwood Heights | 1160000 | 55% | 28 | 211% |
| 22 | Brooklyn | Columbia Street Waterfront District | 1152000 | - | 20 | - |
| 23 | Queens | Belle Harbor | 1150000 | 22% | 5 | -50% |
| 23 | Brooklyn | Brooklyn Heights | 1150000 | -4% | 99 | 330% |
| 24 | Brooklyn | Williamsburg | 1148000 | 20% | 182 | 194% |
| 25 | Manhattan | Financial District | 1138000 | -33% | 130 | 110% |
| 26 | Brooklyn | Greenpoint | 1095000 | 23% | 38 | 36% |
| 27 | Brooklyn | Gowanus | 1088000 | -5% | 22 | 5% |
| 28 | Manhattan | East Village | 1075000 | -6% | 85 | 254% |
| 29 | Queens | Hunters Point | 1064000 | 19% | 232 | 158% |
| 30 | Brooklyn | Red Hook | 1050000 | -46% | 13 | 117% |
| 31 | Manhattan | Upper West Side | 1021000 | -17% | 845 | 221% |
| 32 | Manhattan | Lower East Side | 995000 | 18% | 84 | 265% |
| 33 | Manhattan | Gramercy Park | 988000 | 10% | 124 | 300% |
| 34 | Queens | Fresh Meadows | 978000 | 18% | 38 | 52% |
| 35 | Queens | Malba | 975000 | - | 6 | - |
| 36 | Queens | Ditmars - Steinway | 960000 | 15% | 15 | 200% |
| 37 | Brooklyn | Fort Greene | 950000 | -25% | 31 | 158% |
| 38 | Brooklyn | Prospect Heights | 945000 | -19% | 79 | 108% |
| 39 | Brooklyn | Dyker Heights | 935000 | 20% | 18 | 29% |
| 40 | Queens | Queensboro Hill | 920000 | - | 15 | - |
| 41 | Manhattan | Murray Hill | 917000 | 23% | 166 | 419% |
| 42 | Queens | Hollis Hills | 909000 | - | 16 | - |
| 43 | Manhattan | Clinton - Hell's Kitchen | 908000 | 26% | 124 | 210% |
| 44 | Queens | Auburndale | 900000 | 16% | 25 | 25% |
| 44 | Brooklyn | Borough Park | 900000 | 19% | 89 | 128% |
| 45 | Queens | Rockwood Park | 881000 | 14% | 12 | 50% |
| 46 | Queens | Breezy Point | 875000 | - | 9 | - |
| 47 | Manhattan | Sutton Place | 862000 | -1% | 117 | 432% |
| 48 | Brooklyn | Prospect - Lefferts Gardens | 853000 | - | 27 | - |
| 49 | Manhattan | Central Midtown | 852000 | -20% | 74 | 76% |
| 49 | Queens | Douglaston | 852000 | - | 35 | - |
| 50 | Brooklyn | Bedford-Stuyvesant | 850000 | 10% | 112 | 133% |
| 50 | Manhattan | Turtle Bay | 850000 | 7% | 113 | 146% |
Expert Insight: “NYC is back and better than ever”
For some greater context on what’s driving New York City’s luxury residential market, we caught up with Stan Ponte, a senior global real estate advisor and associate broker with Sotheby’s International Realty – East Side Manhattan Brokerage. Here’s what he had to say:
Q: If the proposed increase in capital gains tax is only part of the reason for the burst of activity in New York City’s luxury real estate market, what are some other reasons for the increase in activity?
The recently released Manhattan real estate market reports showed that more apartments were sold in the third quarter of this year than at any other time in the last 32 years. The market is on fire, and there are multiple reasons for this burst of activity. In addition to potential tax changes in the New Year, we also saw a spike in interest rates. A lot of the market was fueled by low interest rates, especially for first time homebuyers wanting to lock in under a 3% interest rate on a 30-year mortgage. However, this is changing quickly so people are rushing to beat increases in interest rates.
Another factor fueling the real estate market is just simply that New Yorkers buy when others are buying. Whether people hear that their friends are buying or its when the media reports that people are buying again, it’s very much a follow the leader mentality in Manhattan. New Yorkers don’t want to buck the trend. In addition, there is clearly a waning of the pandemic effect on NYC which is causing increased real estate market activity. People are still able to be outdoors, dine and attend activities indoors, Broadway is open, and there is a lot of movement in the city. There is a general sense that NYC is reopening for business, and this is impacting the real estate market.
Another trend fueling today’s market is the return to work led by c-suite NYC homebuyers. At the Woolworth Tower Residences, located at 2 Park Place, we’ve sold several apartments to c-suite executives as more and more companies return to the office. We expect this buying trend to continue through the remainder of the year.
And while I don’t have a crystal ball, I do think the next trend to watch out for will be international buyers coming back into the NYC market as international travel increases.
Q: The rest of the country is facing a housing supply shortage. How does the supply of housing look in NYC by comparison?
There is a shortage of both luxury and affordable housing in NYC over the next five years and this is impacting the market. Brand new permits pulled piqued in 2015, with over 15,000 units planned. That number is down nearly half for 2019, and that it essentially the tale of the tape. We had too much inventory in 2018, 2019, and 2020 and the luxury market slipped. Today, those apartments are being absorbed and there’s not a lot of new inventory coming online thus driving demand. Decrease in inventory and decrease in supply coupled with an increase in demand and closed transactions is fueling the market. All of these reasons in addition to a healthier NYC, high vaccination rate, stores and Broadway open again, and the city’s overall vitality coming back, is creating the current burst in real estate market activity.
Q: As with many policy aspirations, in your opinion, what is the likelihood of this bill passing in its current form?
As of this moment, I think it’s less important what will happen. It’s just important that it may happen. No one wants to be caught making a homebuying decision in the 1st quarter of 2022, when they could have decided in the 3rd or 4th quarter of this year. I honestly don’t know what the likelihood is of this bill passing, but the risk is enough to drive buyers into decision-making mode, and this is what we are seeing.
Q: New York City has proved to be incredibly resilient. As the pandemic wanes, is the flight to Florida, Texas, and other states with lower taxes still a thing, or is NYC back and better than ever?
Tax efficiency is a driver for many people, but not as much of a driver as quality of life. New York City is re-emerging with what feels like a Renaissance energy. New York City has a palpable feeling of re-birth. Museums are exhibiting their most popular collections, Broadway is shining with its brightest stars, and just last night Carnegie Hall opened its doors for the first time since COVID. This is the place to be. Will some people be at a time in their life where tax efficiency is more important than arts, culture and lifestyle? Yes. But for every one of the people that move for tax purposes, there are five times that amount who want to be a part of this moment in NYC’s history. We are experiencing a true revival and renaissance. NYC is back and better than ever.
Stan Ponte was named the #2 agent in Manhattan by sales volume for his work in 2020 achieving $144 million in sales, according to The Wall Street Journal and REAL Trends. As a realtor in New York City for the past 21 years, Stan’s clients include CEOs, philanthropists, hedge fund managers, tech world innovators and entertainers.
Methodology
Median sale prices were calculated based on residential property sales closed between July 1 and September 30, 2020, and July 1 and September 30, 2021, and, in select cases, between July 1 and September 30, 2019. Residential asset types included were single-family homes, condos and co-ops. Package deals were excluded.
Median sale prices were calculated only for neighborhoods that recorded at least five sales between July 1 and September 30, 2021. Year-over-year changes in median sale prices or the number of sales were calculated only for neighborhoods that also recorded a minimum of five sales between July 1 and September 30, 2020.
The boundaries of some neighborhoods in Manhattan, Brooklyn and Queens vary, as data on several small neighborhoods is included in stats for larger areas. For example, in Manhattan, Central Park South is included in the Theatre District-Times Square area; NoLita is included in Little Italy; NoHo is included in Greenwich Village; and Carnegie Hill, Lenox Hill and Yorkville are all included in the Upper East Side. In Queens, Bay Terrace is included in Bayside. In Brooklyn, Ocean Hill is included in Bedford – Stuyvesant.
Want to stay on top of the real estate market?
Access comprehensive property data and ownership information with intuitive research tools.
POSTED IN: Brooklyn Real Estate, Manhattan Real Estate

Patrick McGregor is a senior writer covering the real estate industry and overall economic trends in the United States for several Yardi product publications. He also holds an MBA from Thunderbird School of Global Management. Patrick was previously a commercial real estate analyst at Yardi Matrix for five years. His work has appeared in the New York Times, Bisnow, GlobeSt, The Real Deal, Business Insider, The Denver Post, The Motley Fool, and more.
Recent Reports

Locked-In Owners, Mobile Renters: Homeowners Stay Put as Renters Move 3.7x More Across Largest U.S. Cities
Renters became the primary drivers of long-distance mobility across the largest U.S. cities, moving 3.7 times more than owners in 2024, as high mortgage rates and housing costs kept many homeowners in place.

$4.6M Hudson Yards Maintains Top Spot, Luxury Sales in Malba Set $2.5M Price Record for Queens
Despite prices declining, Hudson Yards remained the most expensive NYC neighborhood, but TriBeCa’s growth closed the gap to under $400,000, while Malba set a new historic price record for Queens at $2.5 million, securing the highest ranking ever for the borough at #5.
2026 Q1 Foreclosure Report: Brooklyn Filings Fall Sharply, Bronx & Staten Island Hit New Peaks
Behind a deceptively mild citywide downtick, borough foreclosure markets pulled into significantly diverging paths as Brooklyn cases were nearly halved and the Bronx hit a new, record high. Meanwhile, Queens remained unchanged, Staten Island surged back up and Manhattan cooled slowly.