

RELEASED ON December 12, 2022
Top 50 Most Expensive NYC Neighborhoods 2022: Sales Slow in 34 of City’s Priciest Neighborhoods
Eliza Theiss | 9 minute read
Hudson Yards & TriBeCa remain priciest NYC neighborhoods for 4th consecutive year, while sales fell in 34 of the city’s top neighborhoods.
Key Takeaways:
- Hudson Yards & TriBeCa remained top two priciest NYC neighborhoods for 4th consecutive year
- 35 neighborhoods surpassed $1 million median, with Hudson Yards going over $5 million
- Q1 price growth kept annual sales price flat at $750,000 as citywide median decreased in Q3 & Q4
- Manhattan claimed sharpest price growth as Roosevelt Island median surged 115% Y-o-Y
- Queens secured top sales activity increase with Ditmars-Steinway’s 136% jump
- Brooklyn was home to five of the six sharpest price gains
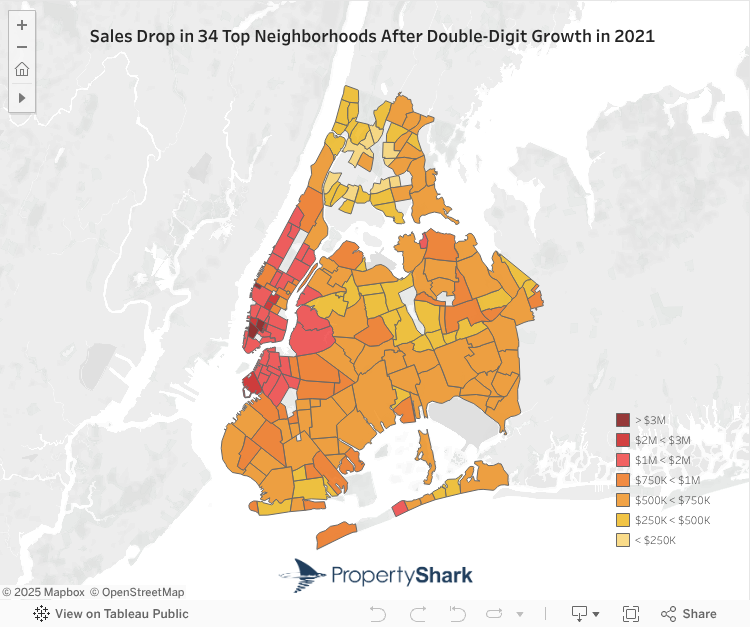
- Sales decreased in 34 of the city’s priciest neighborhoods, with Red Hook sales falling 65%
The New York City real estate market has been on a rollercoaster the last few years: Sales plunged during the onset of the pandemic, only to reach a 10-year high in 2021. Prices also rose to historic figures last year, closing out 2021 with a citywide median of $750,000. But that dramatic growth was bound to slow: Prices peaked in Q2 as the NYC median hit $763,000 and slipped to $720,000 by early December. Likewise, the buying frenzy of 2021 also eased, including among the city’s priciest neighborhoods, with 34 of NYC’s most expensive neighborhoods logging noticeably fewer sales in 2022 than last year.
Top 10 Most Expensive NYC Neighborhoods: Hudson Yards Median Surpasses $5 Million, SoHo Returns to $3 Million Territory
The 55 neighborhoods that made our top 50 (the result of a number of ties) were comprised of 24 Manhattan neighborhoods, 22 Brooklyn communities and nine locations from Queens — a near identical mix of neighborhood distributions by borough as in 2021. As usual, pricing levels in the Bronx were not high enough to rank any of its neighborhoods among the city’s priciest. As a matter of fact, the median sale price across the entire borough came in at $360,000 in 2022, inching down a modest 1% from $365,000 last year.
In the case of the city’s top 10 most expensive neighborhoods, the picture changed noticeably compared to 2021: While Manhattan claimed nine of the priciest NYC neighborhoods last year, it was only home to six in 2022 as Brooklyn contributed four. Moreover, of the 10 priciest neighborhoods, only Little Italy recorded a median sale price decrease. It underwent a 13% price contraction that brought down its median sale price by $315,000 — the result of multiple sales at 185 Grant St. at a significantly lower median than the borough’s previous median sale price. In turn, Little Italy fell from last year’s #4 spot, placing #7 this year.
It’s worth noting here that although medians were mostly on the rise for NYC’s 10 priciest neighborhoods, sales tended to decline: Specifically, six neighborhoods recorded fewer sales in 2022 than in 2021. The two neighborhoods with the sharpest slowdowns in transactional activity of the 50 priciest neighborhoods — Red Hook and Hudson Square — also ranked among the city’s 10 priciest neighborhoods. Hudson Square landed at #4 after an 18% price increase lifted its median to $2,472,000. Not far behind, Red Hook claimed #5 with a $2,114,000 median after a 99% pricing surge (the second highest in the top 50) lifted it from last year’s #28 position.
As for the three richest neighborhoods in NYC, the podium remained unchanged from last year, with Hudson Yards, TriBeCa and SoHo as the top priciest neighborhoods. SoHo was the #3 most expensive NYC neighborhood for the second consecutive year with a $3.1 million median, while TriBeCa was the #2 priciest for the fourth consecutive year with its $3,575,000 median sale price in 2022.
Hudson Yards remained NYC’s #1 most expensive neighborhood for the fourth consecutive year. This year, the neighborhood actually reached a new pricing height of $5,102,000, which was the result of a 7% Y-o-Y price increase. What’s more, Hudson Yards was also one of three neighborhoods in the top 10 where both the median sale price and the number of sales rose. Specifically, Hudson Yards logged 45% more deals than last year, closing 64 sales in 2022.
Along the same lines, the Flatiron District (#6) and DUMBO (#9) were the two other locations where both price trends and sales trends were on an upward curve. In the Flatiron District, sales jumped 21% Y-o-Y to 648 transactions, and a 14% Y-o-Y increase lifted its median to $2.1 million. Similarly, DUMBO’s median reached $1.85 million after a 31% price hike as sales surged 64% — the third-sharpest sales acceleration on the list.
Explore the interactive map below for at-a-glance price and sales insights into NYC’s neighborhoods in 2022:
Medians Increase in 18 of Brooklyn’s Top Neighborhoods, Sales Contract in 14
In 2021, Brooklyn’s priciest neighborhood was Vinegar Hill with a $1.54 million median sale price. However, insufficient sales excluded this neighborhood from landing in our ranking again this year. That’s because sales in this neighborhood tend to fluctuate significantly from quarter to quarter and year to year, thereby causing Vinegar Hill to appear only occasionally among the city’s priciest neighborhoods.
In fact, last year, Vinegar Hill came in with 16 sales — just above the minimum threshold of 15 closed sales that PropertyShark requires to determine accurate annual metrics. But in 2022, the neighborhood closed only nine sales with a median of just $1.1 million which would have ranked it as the #32 priciest in the city, had more sales been completed.
Additionally, medians rose by double digits in a number of Brooklyn neighborhoods. So, even if Vinegar Hill had made the ranking, it still wouldn’t have been at the top of NYC’s or Brooklyn’s pricing trends. Rather, those spots were taken by Red Hook, Cobble Hill, DUMBO, and Carroll Gardens, which placed as the #5, #8, #9 and #10 richest NYC neighborhoods. Not to be outdone, Gowanus was right behind at #11.
While Red Hook may have had the largest drop in sales among the 50 richest NYC neighborhoods, it also claimed the second-sharpest price increase at 99% Y-o-Y — the result of fewer sales at higher price points. To be precise, houses represented 5% of last year’s sales in Red Hook, whereas this year that ratio was 32%. Moreover, there were also fewer sales at 160 Imlay St. (13 in 2022 versus 37 in 2021), but the sales that did close at this address did so at a median of $2,075,000 as compared to last year’s $1.22 million median.
Meanwhile, Cobble Hill’s 42% price increase was the result of a change in the mix of units sold: Condos represented 70% of transactions this year, as opposed to the 53% ratio in 2021. In DUMBO, its 31% median was lifted by 149 sales at the newly launched Front & York development.
Similarly, Gowanus’ 40% Y-o-Y median was also lifted by new development: 16 transactions were recorded at 450 Warren St. at a $1.82 million median, and 92 deals closed at 58 St. Mark’s Place at a $1.51 million median. Accordingly, the launch of these two new projects also contributed to the 110% surge in the number of sales in Gowanus — the largest increase in sales among the city’s 50 leading zip codes.
In terms of transactional activity, only one-third of Brooklyn neighborhoods experienced increases, while 15 saw declines as high 39% and 49%, which were logged in Greenwood Heights and Bergen Beach.
Ditmars-Steinway Sales Accelerate 136%, Even as Transactional Activity Contracts in Most of Queens’ Priciest Neighborhoods
In Queens, Malba returned to the top of the list after having been overtaken by Neponsit last year. That said, Neponsit didn’t make the cut in 2022 as it closed only 13 sales at a median sale price of $1,095,000, which was lower than last year’s $1,225,000 median. As a result, Malba reclaimed the title of the #1 most expensive Queens neighborhood with a $1.19 million median following a 13% Y-o-Y increase — despite the fact that sales were nearly halved.
Next, Belle Harbor was the #2 priciest neighborhood in Queens as a 19% increase lifted its median to $1,105,000. Even so, sales slowed here, as well, dropping 9%. Belle Harbor was also one of only two neighborhoods among NYC’s priciest where the number of sales decreased in 2022.
Finally, the borough’s #4 richest neighborhood in 2022 was Ditmars-Steinway with a median sale price of $998,000. However, it was not the neighborhood’s median that drew attention to it, but rather Ditmars-Steinway’s 136% Y-o-Y increase in sales. As the fastest sales acceleration among the richest NYC neighborhoods, this surge translated to an increase from 36 sales in 2021 to 85 deals in 2022.
Sales Activity Trends Down in 34 of NYC’s Most Expensive Neighborhoods, Medians Rise in 41
When it came to the city’s 50 most expensive neighborhoods, the slowdown in transactional activity was also visible. More precisely, of the 55 neighborhoods represented in our top 50 (due to several ties in median sale prices), 34 neighborhoods recorded fewer sales this year compared to 2021. Furthermore, in 10 of these neighborhoods, the drop in sales activity was sharper than 20% and reached as high as 65%.
To that end, Brooklyn’s Red Hook saw sales activity drop 65% compared to last year, with a mere 22 residential sales recorded this year as opposed to the 63 logged in 2021. It was followed by Manhattan’s Hudson Square with a 61% Y-o-Y drop in sales, closing 114 deals versus the previous year’s 295. Also in Manhattan, Roosevelt Island sales contracted 59% Y-o-Y. And, in Brooklyn’s Bergen Beach and in Queens’ Malba, the number of sales closed in 2021 was halved this year, dropping by 49% and 48%, respectively.
At the opposite end of the spectrum, sales accelerated in 21 neighborhoods. In fact, sales more than doubled in Queens’ Ditmars-Steinway and in Brooklyn’s Gowanus, increasing 136% and 110%, respectively. Sales also rose at an accelerated rate in Brooklyn’s DUMBO, increasing 64% Y-o-Y. At the same time, Chinatown and Hudson Yards sales decelerated 52% and 45%, respectively. For context, in 2021, sales more than doubled in 23 neighborhoods, while just two neighborhoods in the top 50 observed declines in transactional activity.
Notably, trends regarding the most significant sales activity changes were fairly evenly distributed among the boroughs in our top 50, which consists of 24 Manhattan neighborhoods, along with 22 from Brooklyn and nine in Queens.
However, price trends were more stable among the city’s most exclusive neighborhoods: 41 neighborhoods logged year-over-year median sale price increases with two more maintaining the same price point as last year.
In particular, the sharpest price gains were logged in Roosevelt Island and Red Hook, two of the three neighborhoods with the largest drops in the number of sales. Specifically, Roosevelt Island saw its median sale price surge 115% Y-o-Y, going from a median sale price of $462,000 in 2021 to $991,000 this year. Thus, Manhattan claimed the sharpest price growth among the richest NYC neighborhoods.
Notably, Roosevelt Island’s price surge came as sales at 40 River Rd. both slowed and reached a higher price point: In 2021, 102 of 135 sales recorded here originated at 40 River Rd. at a median sale price of $443,000. Conversely, this year, there were only 13 sales at the same property that had a median of $1,075,000.
At the same time, Red Hook’s median sale price jumped 99% Y-o-Y to reach $2,114,000. But Red Hook wasn’t the only Brooklyn neighborhood to log significant price gains. The next sharpest price increases were observed in Brooklyn neighborhoods, as well: Cobble Hill, Gowanus, Fort Greene and DUMBO recorded price hikes between 31% and 42%.
Likewise, the shifting dynamics of the NYC real estate market were also evidenced by the #50 and #51 priciest neighborhoods: #50 in our ranking this year was claimed with an $870,000 median sale price, which was 4% higher than last year’s #50. However, while #51 had a median sale price of $829,000 in 2021, this year’s #51 had a median of $792,000. Therefore, while the difference between #50 and #51 was 1% last year, it was a much sharper 9% this year.
Quarterly Trends Show Cooling NYC Real Estate Market
Q1 of 2022 started off strong with NYC’s sales activity 21% higher than it was during the same period last year. But, in Q2, the buying frenzy of the previous year was already slowing down with 11,563 residential deals closed — up just 1% year-over-year (Y-o-Y). Then, in Q3, sales had contracted 15% Y-o-Y, resulting in about 2,000 fewer home sales. By Q4, quarterly sales in NYC had dropped 28% Y-o-Y, with fewer than 4,000 sales recorded by December 1. As a result, 2022 sales were 4% lower than 2021 levels.
Meanwhile, pricing trends experienced far less dramatic slowdowns, but they still ticked down — with the exception of Q1 2022, when the citywide median was up 7% Y-o-Y. Overall, NYC’s median sale price ticked down 1% Y-o-Y in both the second and third quarters, while Q4 posted a 3% pricing downtick. Consequently, the NYC median sale price for 2022 stood at $750,000, remaining flat year-over-year.
At the borough level, the median sale prices of Brooklyn and Queens remained unchanged compared to 2021: $810,000 in Brooklyn and $570,000 in Queens. The Bronx was the only borough where prices inched down, but even here it was a decrease of just 1% Y-o-Y for a 2022 median of $360,000. As for Manhattan, prices here continued to gather steam, coming in 5% higher than 2021 figures for a yearly median sale price of $1,155,000.
Sales however, trended down in all four boroughs. While the Bronx and Queens saw modest slips of just 1% Y-o-Y, sales in Manhattan slowed 5% and 7% in Brooklyn. As a result, citywide sales were 4% below year-ago figures.
For more information, explore New York City’s 50 most expensive neighborhoods in 2022 in the interactive table below:
Methodology
Median sale prices were calculated based on closed residential property sales recorded in ACRIS between January 1 and December 1, 2021, and January 1 and December 1, 2022. Residential asset types included single family homes, condos and co-ops. Package deals were excluded.
Median sale prices were only calculated for neighborhoods that recorded at least 15 sales between January 1 and December 1, 2022. Likewise, year-over-year changes in median sale prices or the number of sales were only calculated for neighborhoods that also recorded a minimum of 15 sales between January 1 and December 1, 2021. Median sale prices were rounded to the nearest $1,000.
The boundaries of some Manhattan neighborhoods may vary, as data on several small neighborhoods is included in stats for larger areas. For example, Central Park South is included in the Theatre District-Times Square area; NoLita is included in Little Italy; NoHo is included in Greenwich Village; and Carnegie Hill, Lenox Hill and Yorkville are all included in the Upper East Side.
Want to stay on top of the real estate market?
Access comprehensive property data and ownership information with intuitive research tools.
POSTED IN: Brooklyn Real Estate, Manhattan Real Estate

Eliza Theiss is a senior writer reporting real estate trends in the US. Her work has been cited by CBS News, Curbed, The Los Angeles Times, and Forbes among others. With an academic background in journalism, Eliza has been covering real estate since 2012. Before joining PropertyShark, Eliza was an associate editor at Multi-Housing News and Commercial Property Executive. She has also contributed extensively to CommercialEdge. Reach her at [email protected]
Recent Reports

Locked-In Owners, Mobile Renters: Homeowners Stay Put as Renters Move 3.7x More Across Largest U.S. Cities
Renters became the primary drivers of long-distance mobility across the largest U.S. cities, moving 3.7 times more than owners in 2024, as high mortgage rates and housing costs kept many homeowners in place.

$4.6M Hudson Yards Maintains Top Spot, Luxury Sales in Malba Set $2.5M Price Record for Queens
Despite prices declining, Hudson Yards remained the most expensive NYC neighborhood, but TriBeCa’s growth closed the gap to under $400,000, while Malba set a new historic price record for Queens at $2.5 million, securing the highest ranking ever for the borough at #5.
2026 Q1 Foreclosure Report: Brooklyn Filings Fall Sharply, Bronx & Staten Island Hit New Peaks
Behind a deceptively mild citywide downtick, borough foreclosure markets pulled into significantly diverging paths as Brooklyn cases were nearly halved and the Bronx hit a new, record high. Meanwhile, Queens remained unchanged, Staten Island surged back up and Manhattan cooled slowly.