

RELEASED ON March 8, 2023
Cambridge, Mass., Maintains Title as Most Expensive Office Submarket
Lucian Alixandrescu | 8 minute read
For the second year in a row, Cambridge, Mass., in the Boston metro was the most expensive office space location, with the top 100 being dominated by California with a third of all entries.
Key Takeaways:
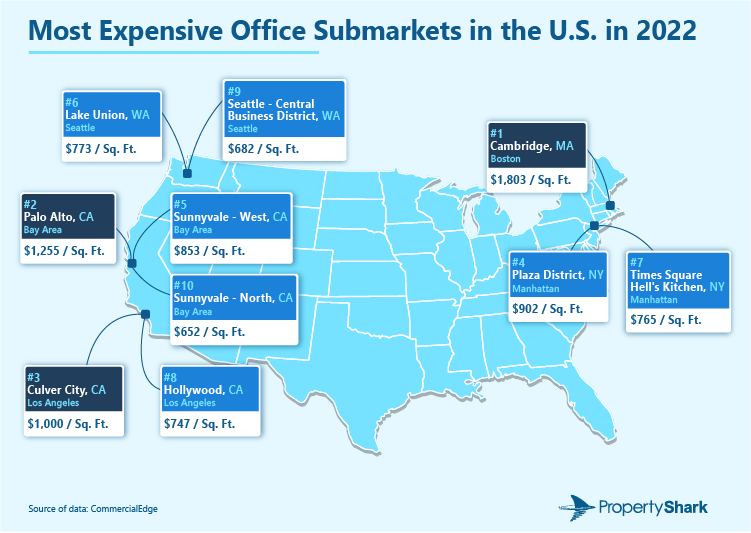
- Cambridge, Mass., stayed at the top of the list of most expensive office submarkets by sale price for the second year in a row with a price per square foot of more than $1,800.
- The next 9 most expensive submarkets hailed from Silicon Valley; Los Angeles; Manhattan, N.Y.; and Seattle.
- California provided 34 of the 100 most expensive office submarkets, followed by Florida with 13 and Texas and New York with six each.
- The Golden State also had the highest statewide sale price of $390 per square foot, compared to a national average of $227.
In recent years, life science hubs — with Boston at the forefront — dislodged traditional finance and tech hubs as the nation’s most expensive destinations for office space. In the past year, demand for life sciences stayed strong, with established hubs also making their presence felt.
For the second year in a row, Cambridge, Mass., is America’s most expensive submarket for office space, largely determined by high-stakes biotech office sales. The remainder of the top 10 most expensive office submarkets spanned both coasts, although the most expensive submarkets at a state level were concentrated in California. To make the cut, submarkets had to have a minimum of three transactions of office properties larger than 25,000 square feet last year. Read on for more details and check out the study’s methodology at the end of the article.
Cambridge, Mass., Claims Most Expensive U.S. Submarket for Office Space for 2nd Consecutive Year
Cambridge, Mass., recorded an average sale price per square foot of $1,803 last year, becoming the most expensive office submarket in the U.S. This is the second year in a row that the Boston suburb earns that title, being one of the primary beneficiaries of the expansion of life sciences demand. This year’s average price is a 16% price hike from last year’s $1,560.
This year’s dazzling figure was the result of just three sales. The largest of the three — the recapitalization of the Alexandria Center at Kendall Square for more than $1 billion — resulted in a price per square foot of $2,364, the highest per-square-foot price of all properties sold last year. Alexandria Real Estate Equities (the same life sciences-oriented real estate investment trust behind some of 2021’s largest office deals) sold a stake in the trophy office and laboratory building to a joint venture involving CBRE and an unspecified institutional investor.
Meanwhile — and just a few minutes’ walk down Binney Street — another trophy life sciences property changed hands and contributed to Cambridge’s unequaled average prices. Namely, the property at 125 Broadway was purchased by Boston Properties for $600 million, or $2,225 per square foot, in a bid to expand the company’s already-strong presence in the Kendall Square neighborhood that’s also home to the Alexandria Center and some of the most high-demand Boston office space as things stand.
The third and last office sale in the submarket was comparatively small. A mixed-use building containing office and retail space situated at 1 Brattle Square sold for $78 million, equating to a price per square foot of $822 and tempering the submarket’s average price.
As such, life science was still the name of the game for the Cambridge submarket which is one of the focal points of the biotech expansion in the Boston metro. The industry saw rapid growth in investments here, as well as development of specialized laboratory space, with Cambridge being one of the most competitive life sciences markets nationally in terms of asking rents and vacancy rate.
Notably, Boston’s central business district (CBD) — which ranked fourth last year — did not make the list this year after recording only one sale in 2022.
Palo Alto Average Price Exceeds $1,000 Per Square Foot, Sunnyvale Home to 2 Submarkets Among 10 Most Expensive
While the most expensive office submarket this year was a life sciences hub, tech mainstays were not far behind. For instance, at $1,255 per square foot, office space in Palo Alto, Calif., more than doubled in price compared to the previous year’s $621. As a result, Palo Alto was the second most expensive submarket last year and the only one other than Cambridge with a price per square foot of more than $1,000.
Palo Alto recorded four office deals last year, the foremost of which was the acquisition of the Stanford Research Park by none other than Alexandria Real Estate Equities. The 292,000-square-foot property sold for a reported $446 million, or $1,527 per square foot, being fully occupied by TIBCO Software. Although Alexandria primarily specializes in life sciences space, it has also focused on expanding and diversifying its portfolio in the Bay Area’s tech clusters in recent times. Besides the sale of the Stanford Research Park, three other properties of 33,000 to 36,000 square feet each also changed hands in Palo Alto.
Staying in the Bay Area, Sunnyvale also claimed two submarkets among the nation’s most expensive. In this case, the Sunnyvale – West submarket was the higher-ranked of the two, reaching #5 on our list with an average price of $852 across five sales. Not to be outdone, the Sunnyvale – North submarket closed out the top 10, averaging $652 per square feet.
Sunnyvale’s most expensive office deal was the $222-million purchase of the office complex at 684 W. Maude Ave. currently occupied by LinkedIn. Even so, as far as price per square foot, the sale of the LinkedIn office property was outmatched by 200 S. Mathilda Ave. Currently occupied by Uber, it averaged $1,231 per square foot. Both properties are located in the Sunnyvale west submarket, which includes the city’s downtown.
Culver City & Hollywood Are SoCal’s Most Expensive Areas for Office Space
Down in Southern California, two high-demand submarkets for Los Angeles office space were among the nation’s 10 most expensive.
Coming in at #3, the filmmaking hub of Culver City recorded five deals last year averaging just a few cents under $1,000 per square foot. Here, the city’s largest sale was appropriately the recapitalization of One Culver, a 363,000-square-foot creative campus encompassing both office space, as well as studio space and sound stages. The property is the headquarters of Sony Pictures Studio (formerly MGM Studios).
Likewise, the movie-making mecca of Hollywood was Los Angeles’ other representative in the top 10 most expensive office submarkets. With an average price of $747 per square foot across four sales, Hollywood is a new entry to the list. (It didn’t make last year’s ranking due to recording only two sales.)
Manhattan & Seattle Record 2 Office Submarkets Each Among America’s Most Expensive
As the home of the skyscraper and the financial capital of the world, Manhattan is also home to some of the priciest areas for office space. In particular, the Plaza District stood out with an average price per square foot of office space of $902, earning the fourth spot on our list.
The neighborhood’s steep average prices (which are 7% higher than last year) were the result of eight office sales. However, one of these sales clearly stood out: In September, SL Green Realty completed its acquisition of 245 Park Ave. for a whopping $1.77 billion in last year’s largest office transaction for an equivalent price of $1,027 per square foot. Yet, two Plaza District sales still managed to surpass 245 Park Ave. in terms price per square foot — the acquisition of 12 W. 48th St. for $1,605 per square foot ($49.5 million in total) and 450 Park Ave. for $1,350 per square foot ($445 million in total).
Also in Manhattan, the Times Square-Hell’s Kitchen submarket ranked seventh with an average price of $767 across three sales, while Chelsea — last year’s third-most expensive market — did not record enough office transactions to make the list this year. SoHo was home to the borough’s most expensive sale by price per square foot, specifically the purchase of 375 W. Broadway for $2,334 per square foot by Chicago-based investment firm Pearlmark.
The top 10 was completed by two other new entries from the Seattle metro. The area has also evidenced itself as one of the nation’s primary life sciences clusters alongside Boston and San Francisco.
Office space in the submarket centered around Lake Union, Wash., sold for $773 per square foot, on average, placing it sixth nationally. The most expensive office transaction here was the purchase of 1101 Westlake, a 151,000-square-foot office building fully leased to Meta. The buyer was BioMed Realty, a San Diego-based life sciences property owner that reportedly also plans to develop a 616,000-square-foot life sciences property in Seattle.
Similarly, office space Seattle’s CBD submarket recorded a price of $682 per square foot, placing it ninth. In the Emerald City, the Madison Centre was the submarket’s most notable sale last year with a total sale price of $730 million and a per-square-foot price tag of $968.
California Claims 34 of 100 Most Expensive Submarkets in U.S., Florida Ranks 2nd with 13
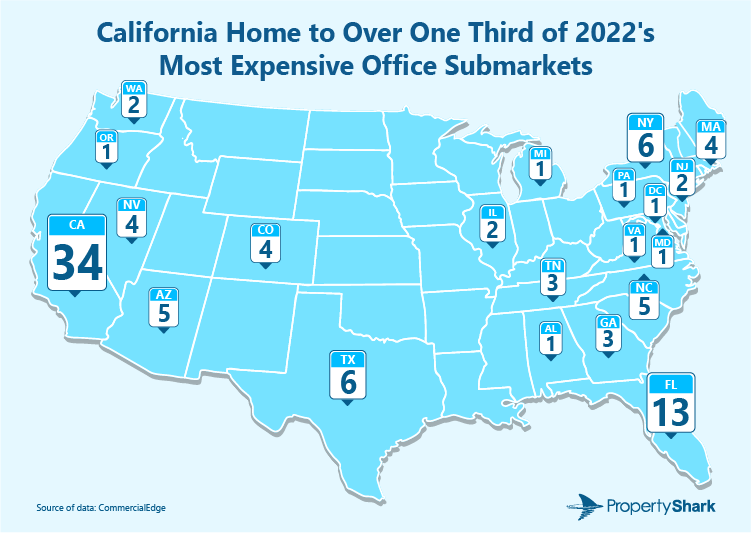
Considering the 100 most expensive office submarkets nationally, California still led comfortably with more than one-third of the entries. And, although the state’s 34 of the 100 most expensive submarkets is a decrease from last year’s 44, the Golden State was still far ahead in terms of pricey areas for office space.
California also had the most expensive office space at a state level with an average price tag of $391 per square foot across 358 transactions. That was up from the $379 per square foot average from last year’s study, as well as more than 70% higher than the national average, which rested at $227 per square foot.
Of California’s 34 entries, nine hailed from the Bay Area, including the three Silicon Valley submarkets that cracked the top 10. Otherwise, the Los Angeles market was home to 10 additional entries, while the rest were from San Diego (six submarkets), Orange County (five submarkets), and Inland Empire (two entries), as well as California’s Central Valley and urban San Francisco (one submarket each).
On the opposite coast, Florida had the second-most submarkets among the 100 most expensive nationally with 13. Three of these are situated in Miami (Biscayne Corridor at #40, the city’s CBD at #68 and Airport South at #78). However, the most expensive submarket in the entire state was Fort Lauderdale’s Central market, which stopped just shy of the top 10 with an average price of $647 per square foot. The other Fort Lauderdale submarket in the top 100 was Plantation, Fla., at #52. Florida’s remaining submarkets in the top 100 were situated in Palm Beach, Tampa, Jacksonville and southwest Florida.
Up next, Texas and the state of New York had six entries each among the most expensive office submarkets. Of those in Texas, four hailed from Austin, with East Austin at #16 being the most expensive at $526 per square foot. One additional submarket is situated in Dallas (Platinum Corridor North at #45), as well as one from Houston (The Woodlands, #83).
In the northeast, New York’s four other markets in the top 100 most expensive (besides the Plaza District and Times Square) were: downtown Brooklyn (#21) and the Williamsburg-Greenpoint submarket from the same borough (#25); Long Island (#51); and Westbury-East Meadow (#89). It’s also worth noting that many high-stakes office sales occurred across Manhattan last year, but their respective submarkets may not have ranked if there were less than the required minimum of three sales for an accurate ranking. Overall, the 119 office sales in New York last year averaged $292 per square foot, below Massachusetts’ $306 across 80 sales and the $312 average resulting from Washington state’s 46 office deals.
The remaining most expensive submarkets were spread across 17 other states. North Carolina and Phoenix were home to five entries each, while Colorado, Nevada and Massachusetts provided four each. Notably, all four Massachusetts submarkets in the top 100 hailed from Boston. Phoenix, Denver and Las Vegas also claimed all of their respective states’ entries.
Methodology
To determine the most expensive submarkets in the U.S., we looked at office transactions closed between January 1 and December 31, 2022, according to data provided by CommercialEdge.
Our study included sales of individual properties, as well as portfolio sales in which the price for each individual office property was known. For data accuracy, only portfolio deals where all properties were located within the same submarket were included. Portfolio deals were counted as a single transaction, with the average price per square foot in that case being calculated by dividing the total sale price by the total square footage of the portfolio.
Prices per square foot were calculated based on available property square footage data provided by CommercialEdge. In the case of mixed-use properties, this may also include other asset types besides office space. Properties with a total square footage lower than 25,000 square feet were excluded.
Statewide average prices were calculated based on all transactions for office properties larger than 25,000 square feet, including those in submarkets that did not make the top 100 ranking.
To eliminate outliers due to low sample sizes, only submarkets with at least three transactions in 2022 were included in our study. Delimitations of markets and their respective submarkets were based on proprietary CommercialEdge demarcations determined by the platform’s real estate professionals.
Want to stay on top of the real estate market?
Access comprehensive property data and ownership information with intuitive research tools.
POSTED IN: Commercial Real Estate, Real Estate Broad

Lucian is a senior content writer for CommercialCafe, specializing in commercial real estate research and data-driven reporting since 2019. With deep expertise in industrial real estate, office markets, demographics, and economics, he produces comprehensive market studies and insights on national and regional CRE trends. He also reports on adjacent subjects such as population shifts and the job market. His reports have been cited by and featured in The New York Times, Forbes, NBC, Bisnow, The Business Journals, and Yahoo Finance. Lucian holds a background in language and literature studies and brings more than 5 years of previous freelance writing experience to his commercial real estate journalism.
Recent Reports

World Cup or Your Mortgage/Rent? Ticket Prices Rival Host City Housing Costs
World Cup ticket prices rival monthly housing expenses in the 11 U.S. host cities, with even the cheapest seats covering weeks or even months of rent or mortgage payments.

Locked-In Owners, Mobile Renters: Homeowners Stay Put as Renters Move 3.7x More Across Largest U.S. Cities
Renters became the primary drivers of long-distance mobility across the largest U.S. cities, moving 3.7 times more than owners in 2024, as high mortgage rates and housing costs kept many homeowners in place.

$4.6M Hudson Yards Maintains Top Spot, Luxury Sales in Malba Set $2.5M Price Record for Queens
Despite prices declining, Hudson Yards remained the most expensive NYC neighborhood, but TriBeCa’s growth closed the gap to under $400,000, while Malba set a new historic price record for Queens at $2.5 million, securing the highest ranking ever for the borough at #5.