
Top 50 Most Expensive NYC Neighborhoods
NYC Median Home Price Hits Record $800K as Most Top Neighborhoods See Y-o-Y Gains
RELEASED ON October 30, 2025
The New York City median sale price reached a record $800,000 in Q3, up 4% year-over-year, while Brooklyn posted the strongest growth rate after rising 11% to a new peak of $916,000.
Key Takeaways:
- NYC’s median sale price reached a record $800,000 in Q3, up 4% Y-o-Y, with sales increasing 8%.
- Manhattan’s median sale price remained unchanged Y-o-Y at $1.15M, while transactions rose 15%.
- Brooklyn reached a record median sale price of $916,000 after the strongest borough-level growth (11%) with 26 neighborhoods in the top 50, compared to 19 from Manhattan.
- Queens also hit a record median sale price of $600,000 with Jamaica Estates posting the highest price increase (144% Y-o-Y) among the top 50 neighborhoods.
- Hudson Yards ranked as NYC’s most expensive neighborhood at $4.99M, followed by TriBeCa at $3.77M.
- SoHo dropped from #1 to #3 Y-o-Y after a 21% decline in median sale price to $3.36M.
- Brooklyn’s Cobble Hill rounded out the top five at $2.28M, following a 24% Y-o-Y growth.
- Boerum Hill recorded the sharpest rise in transactions with sales up fourfold Y-o-Y, driven by activity in a new condo development.
- Within Queens, Malba was the most expensive neighborhood with a median sale price of $1.60M.
Following the growth seen in previous quarters, the New York City real estate market reached new heights in Q3 with a record median sale price of $800,000, following a 4% year-over-year growth. Sales also rose during this period as NYC recorded 8% more transactions Y-o-Y for a total of 8,549 at the end of the third quarter.
While logging 15% more sales Y-o-Y, Manhattan’s median sale price stagnated at precisely $1.15M. Instead, much of the citywide rise in median sale prices was driven by Brooklyn: The borough saw an 11% Y-o-Y increase from sales of single-family homes, condos and co-ops to reach the highest level recorded to date ($916,000).
Due to seven pricing ties, a total of 57 neighborhoods were included in the top 50 most expensive neighborhoods in the third quarter of this year. Notably, Brooklyn overtook Manhattan with 26 neighborhoods in the top 50 most expensive (versus only 19 belonging to Manhattan).
Similar to Brooklyn, Queens also reached its highest median sale price in Q3 of 2025 —$600,000 after a 4% Y-o-Y rise. A total of 12 Queens neighborhoods made the top 50 most expensive. Malba was Queens’ most expensive neighborhood with a median sale price of $1.60M.
Explore the interactive map below for at-a-glance price and sales insights for NYC’s neighborhoods in Q3 2025:
Top 10 Most Expensive NYC Neighborhoods
Manhattan’s Leading Neighborhoods Post Strong Sales Activity, but Few Price Gains in Q3
Manhattan continued to dominate the top 10 with six neighborhoods in the lead. That said, only two of them saw increases in the median sale price — Hudson Square (43%) and Central Midtown (78%) — while the rest either stagnated or declined in price. The median sale price in Manhattan remained the same Y-o-Y at $1.15M, even as sales grew by 15%.
Hudson Yards claimed the #1 position as New York City’s most expensive neighborhood with a median sale price of $4.99 million at the end of Q3 2025. The premium pricing was fueled by sales at two addresses during the third quarter — 35 Hudson Yards and 15 Hudson Yards.
Holding firm at #2, TriBeCa maintained its runner-up position with a median sale price of $3.77 million, following a modest, 3% decline Y-o-Y. Although prices here softened slightly, TriBeCa saw consistent activity, logging the same number of transactions Y-o-Y, 78.
Next, at #3, SoHo’s median sale price fell 21% Y-o-Y to $3.36 million, driven largely by a shift in the mix of property types sold. Specifically, condo sales dropped to just nine from 17 last year, whereas co-op sales jumped to account for about two-thirds of all transactions. As such, overall sales activity in SoHo increased by 30% Y-o-Y.
Then, Hudson Square climbed to #4 as the neighborhood’s median sale price rose 43% Y-o-Y to $2.65 million, paired with a 35% increase in sales. In this case, the number of sales including condos rose Y-o-Y, while the number of transactions including co-ops remained the same.
Marking Brooklyn’s first entry on the list at #5, Cobble Hill’s median sale price reached $2.28 million after a 24% Y-o-Y increase. In this neighborhood, the majority of Q3 sales this year exceeded the $1.84 million median from a year earlier. Conversely, in terms of sales activity, the number of transactions fell by 23% Y-o-Y.
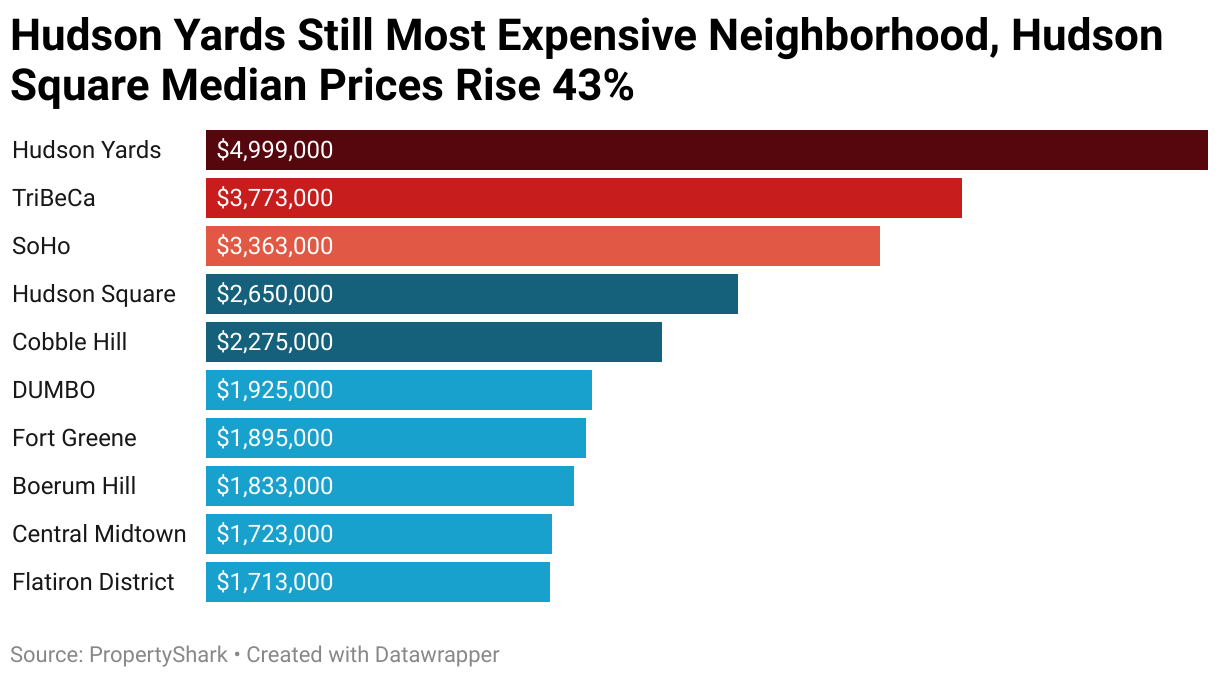
Not to be outdone, DUMBO followed at #6, bolstered by a 15% increase in the median sale price to $1.93 million. Here, the average square footage of the condos sold in the third quarter was higher than those that were sold in Q3 of 2024, which drove up the neighborhood’s median sales price.
At #7, Fort Greene reached new pricing heights at $1.9 million, climbing 67% Y-o-Y after an unusually large number of brownstones changed ownership. Not only that, but 12 Fort Greene homes sold for more than $2M each.
Nearby, Boerum Hill secured the #8 spot with a median sale price of $1.83 million. However, what truly set it apart was its 304% Y-o-Y surge in sales: Nearly 100 transactions closed in Q3, driven by activity at the newly completed condo development at 323 Bergen St., which alone accounted for 73 sales.
At #9, Central Midtown’s median sale price stood at $1.72M after a 78% Y-o-Y jump — one of the sharpest among the priciest NYC neighborhoods. Meanwhile, the number of transactions rose 39%, an increase that was fueled by a wave of new condo sales that temporarily boosted the median sale price in the area.
Rounding out the list, the Flatiron District claimed the #10 spot with a median sale price of $1.71 million — a slight 2% Y-o-Y decrease — paired with a 12% drop in sales, which put the neighborhood at a total of 98 transactions in Q3.
Most Expensive Brooklyn Neighborhoods
Brooklyn Sees Highest Price Growth of Top 50 Neighborhoods, Manhattan Beach Up 137% Y-o-Y
Brooklyn reached $916,000 at the end of Q3, which represented an all-time high. Overall, the borough’s median sale price rose 11% Y-o-Y for the sharpest rise in the city.
Apart from the four neighborhoods that made the top 10 priciest in Q3, Brooklyn also stood out with Greenpoint at #12, which had a median sale price of $1.68M after a 19% Y-o-Y increase. Not far behind, Park Slope, Vinegar Hill and Caroll Gardens all stood above the $1.4M mark at the end of the third quarter, following minor Y-o-Y changes. Yet, Brooklyn’s most notable rise in price took place in Manhattan Beach, where the median sale price surged 137% Y-o-Y to reach $1.26M at the end of Q3.
During Q3, Brooklyn was also home to some of the highest Y-o-Y changes in sales, including Boerum Hill, where transactions grew by 304% Y-o-Y. Additionally, Wingate sales jumped 138% Y-o-Y, but that only translated to 19 sales this year versus eight in Q3 2024. Much of that difference came from the launch of sales at 585 Albany Ave., which saw eight condos trade hands throughout the third quarter. Residential sales in Williamsburg also went up 48%, going from 133 sales in Q3 of 2024 to a total of 197 in the same quarter of this year.
At the other end of the spectrum, the four most drastic decreases in residential sales among the city’s 50 priciest neighborhoods also took place in Brooklyn. It’s worth noting, however, that while these decreases represent significant percentages, the actual number of sales is relatively low. For example, the Columbia Street Waterfront District saw 50% fewer transactions Y-o-Y, while Greenpoint also decreased in sales by 39%, partly due to sales drying up at 29 Huron St. (only four this quarter, as opposed to 25 in Q3 last year).
Otherwise, the change in property mix affected the number of sales in Madison (a 38% drop) as fewer houses were sold in Q3 of this year than in the same quarter one year ago. Likewise, Downtown Brooklyn suffered a 30% loss in residential sales last quarter, with only three condos changing hands at 11 Hoyt St., as opposed to 34 during the same period last year.
Most Expensive Queens Neighborhoods
Queens Hits Highest Median Sale Price with Top 50’s Sharpest Price Jump in Jamaica Estates
In Q3, Queens had a median sale price of $600,000 after increasing by a minor 4% Y-o-Y. Even so, this represents the borough’s highest median sale price recorded to date. Queens stood out in Q3 with Malba, the borough’s priciest neighborhood, which recorded a median sale price of $1.60M. Following, albeit at a distance, was Hunters Point with a $1.25M median sale price after a minor Y-o-Y increase.
However, it was Jamaica Estates that registered the absolute highest increase in median sale prices among the top 50 priciest neighborhoods. The 144% surge took Jamaica Estates to $1.25M at the end of Q3 this year from a median sale price of just $513,000 one year prior. Over three-quarters of the total sales in the neighborhood were made of houses, compared to less than half in Q3 of 2024, while co-op sales noted a Y-o-Y decrease.
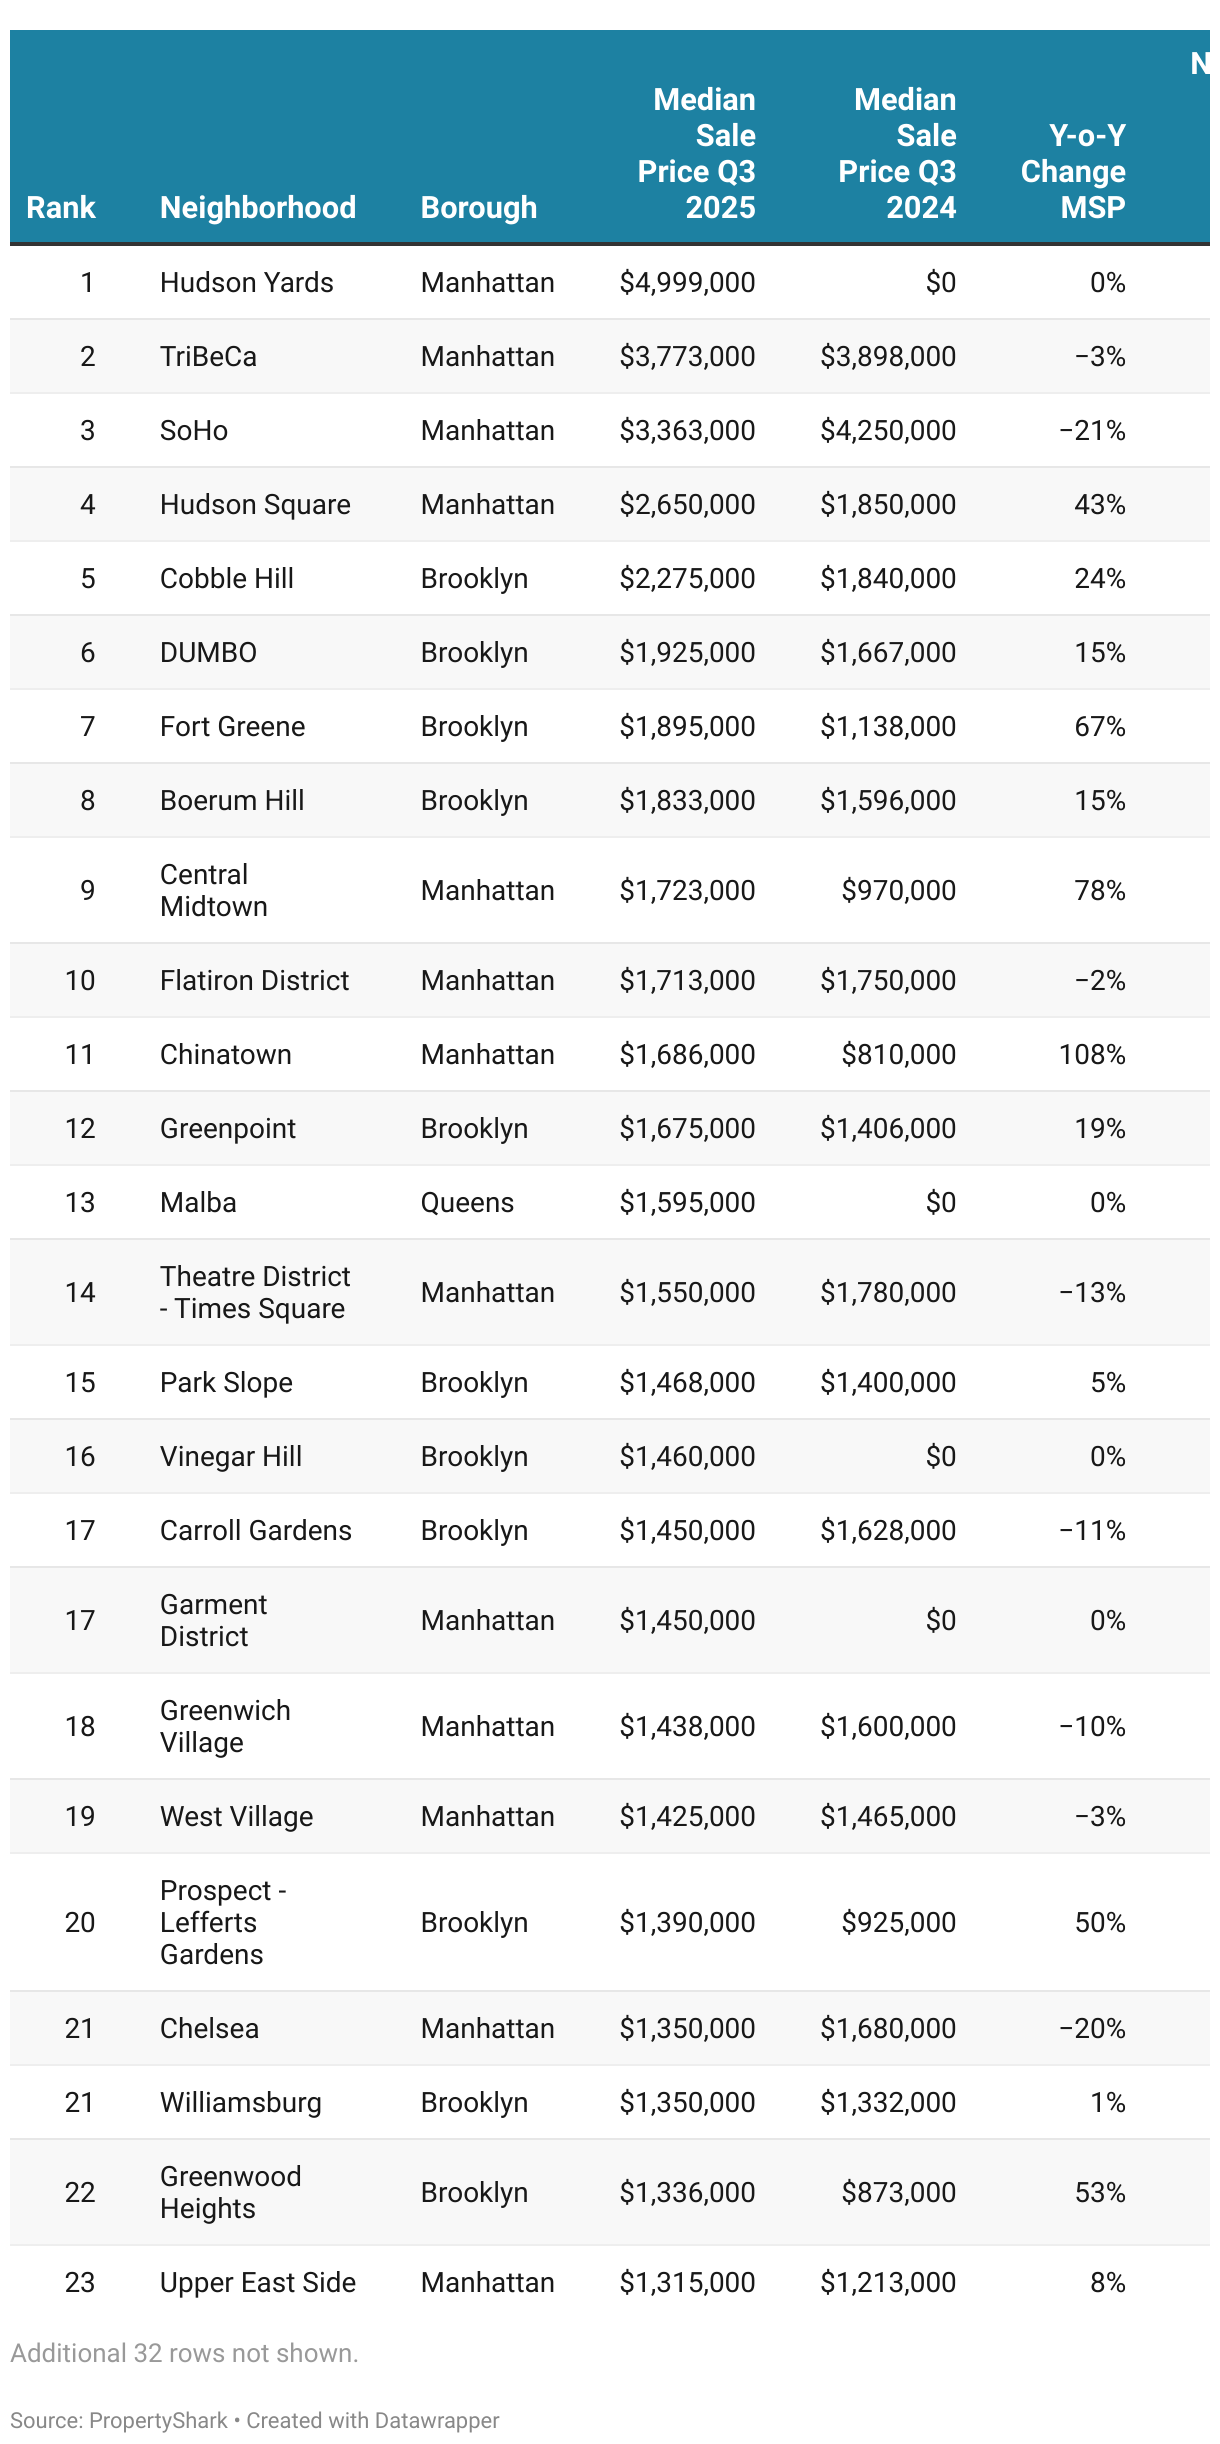
For more information, explore New York City’s 50 most expensive neighborhoods in Q3 2025 in the interactive table below:
Top 50 Most Expensive NYC Neighborhoods in Q3 2025
Methodology
Median sale prices were calculated based on closed residential property sales recorded in ACRIS between July 1 and September 30, 2024, and July 1 and September 30, 2025. Residential asset types included were single family homes, condos and co-ops. Package deals were excluded.
Median sale prices were calculated only for neighborhoods that recorded at least five sales between July 1 and September 30, 2025. Year-over-year changes in median sale prices or the number of sales were calculated only for neighborhoods that also recorded a minimum of five sales between July 1 and September 30, 2024. Median sale prices were rounded to the nearest $1,000.
In this report, New York City is defined as the four boroughs of Brooklyn, the Bronx, Manhattan and Queens. Staten Island was excluded.
FAQs
1. Which neighborhood was the most expensive in NYC in Q3 2025?
Hudson Yards held the top spot with a median sale price of about $4.99 million — the most expensive neighborhood in the city.
2. What were the other top priciest neighborhoods?
TriBeCa was second ($3.77 M), SoHo ranked third ($3.36 M) and Hudson Square ranked fourth ($2.65 M). Meanwhile, Cobble Hill in Brooklyn finished within the top five ($2.28 M).
3. Which borough had the most neighborhoods in the top 50?
Brooklyn overtook Manhattan with 26 neighborhoods in the top 50 most expensive, compared to 19 for Manhattan.
4. Are high prices limited to Manhattan?
No. While Manhattan dominates the highest price tiers, Brooklyn and Queens also recorded record median prices — including Brooklyn’s overall median (~$916 K) and Queens’ highest (Malba at ~$1.60 M).
Fair Use & Redistribution
We encourage and freely grant permission to reuse and repost information, analysis, charts, tables and images included on this page. When doing so, we only ask that you link back to this page or PropertyShark.com as the official source.
About PropertyShark
PropertyShark is an online real estate database and property research tool that provides building details, ownership information, comparable sales, and foreclosure data. Founded in 2003, PropertyShark serves real estate professionals and consumers in New York and other major U.S. markets.
Want to stay on top of the real estate market?
Access comprehensive property data and ownership information with intuitive research tools.
POSTED IN: Brooklyn Real Estate, Manhattan Real Estate

Laura Pop-Badiu is a Senior Creative Writer at PropertyShark, with a degree in Journalism and a background in both hospitality and real estate. Laura is a certified bookworm with a genuine passion for the written word and a keen interest in the real estate market, having previously written for Yardi's RentCafe, CoworkingCafe and CoworkingMag. Her work has been featured in major publications like The New York Times, Forbes, NBC News, The Business Journals, Chicago Tribune, MSN and Yahoo! Finance, among others.
Recent Reports
Locked-In Owners, Mobile Renters: Homeowners Stay Put as Renters Move 3.7x More Across Largest U.S. Cities
Renters became the primary drivers of long-distance mobility across the largest U.S. cities, moving 3.7 times more than owners in 2024, as high mortgage rates and housing costs kept many homeowners in place.
$4.6M Hudson Yards Maintains Top Spot, Luxury Sales in Malba Set $2.5M Price Record for Queens
Despite prices declining, Hudson Yards remained the most expensive NYC neighborhood, but TriBeCa’s growth closed the gap to under $400,000, while Malba set a new historic price record for Queens at $2.5 million, securing the highest ranking ever for the borough at #5.
2026 Q1 Foreclosure Report: Brooklyn Filings Fall Sharply, Bronx & Staten Island Hit New Peaks
Behind a deceptively mild citywide downtick, borough foreclosure markets pulled into significantly diverging paths as Brooklyn cases were nearly halved and the Bronx hit a new, record high. Meanwhile, Queens remained unchanged, Staten Island surged back up and Manhattan cooled slowly.