
Commercial Real Estate | RELEASED ON May 27, 2026
NYC Office Market Ahead of National Curve: Manhattan Q1 Vacancy Drops to 13.1%
Lucian Alixandrescu | 4 minute read
New York City's office market outpaced the U.S. on several major metrics in Q1, with Manhattan vacancy nearly 5 percentage points below the national benchmark, asking rents climbing against a downward national trend and flex inventory crossing 15 million square feet.
Key Takeaways:
- Coworking inventory across NYC reached 15.3 million square feet, accounting for 2.6% of total office space, ahead of the 2.3% national benchmark
- Manhattan asking rents climbed 2.1% Q-o-Q to $69.80 per square foot, while national rents slipped 0.2%
- With average asking rents at $94.53 per sq. ft., the Plaza District edged ahead of Chelsea as NYC’s most expensive office submarket
- Harlem-North Manhattan nearly doubled its coworking footprint in a single quarter, adding 132,500 square feet of new locations
- Brooklyn vacancy fell to 15.4%, its lowest level since Q3 2024
In Q1 of 2026, Manhattan and Brooklyn both posted vacancy rates well below the U.S. national average of 17.8%. Traditional asking rents accelerated citywide while coworking inventory continues to expand as more companies turn to flexible office solutions. These metrics, captured in Hubble’s Q1 2026 NYC office report covering both shared and traditional office space, point to a city-wide office market that is rebalancing well ahead of the national trend.
Office Space Vacancies
Manhattan Vacancy Falls 50 BPS Q-o-Q to 13.1%, Well Below National Market
Manhattan’s vacancy rate dropped 50 basis points (bps) in the quarter to reach 13.1% at the end of March — 470 bps below the 17.8% national benchmark. The decline reversed an 80-bps quarterly increase recorded at the end of 2025. Meanwhile, Brooklyn vacancy fell to 15.4%, its lowest level since Q3 2024.
Vacancies in both boroughs remain elevated compared to pre-2020 figures, but the recent trajectory points to a steadier path toward stabilization than most U.S. markets are charting.

Office Space Asking Rents
Traditional Asking Rents Climb 2.1% Q-o-Q in Manhattan as Plaza District Takes Top Spot
While the national average asking rent dipped 0.2% in Q1, Manhattan asking rents rose 2.1% Q-o-Q to $69.80 per square foot. Brooklyn rents posted an even sharper 3.2% gain, with the Bronx and Queens climbing 1.7% and 0.5%, respectively.
The Plaza District overtook Chelsea as the most expensive submarket for New York City office space, with asking rents reaching $94.53 per square foot, against Chelsea’s $94.18. Three Lower Manhattan submarkets followed: SoHo ($88.75), Greenwich Village ($85.09) and TriBeCa ($83.51). United Nations-Turtle Bay was the only other submarket above the Manhattan baseline by asking rent. Meanwhile, Brooklyn Heights led its borough at $56.31 per square foot, standing more than 50% above Brooklyn’s $36.91-per-square-foot average.

Coworking & Flex Inventory
Coworking Inventory Hits 15.3M Sq. Ft., Harlem Doubles Inventory Q-o-Q
NYC’s coworking and flex office inventory reached 15.3 million square feet at the end of Q1, with Manhattan alone accounting for 12.8 million. Citywide, coworking space now represents 2.6% of the total office market — above the 2.3% national share — confirming NYC as the country’s most flex-heavy major market.
Manhattan added a net 328,000 square feet of coworking space during the first quarter. The three largest gains were concentrated in Harlem-North Manhattan (+132,500 sq. ft.), the Plaza District (+107,800 sq. ft.) and Gramercy Park (+91,900 sq. ft.). Harlem’s expansion was the standout: four new operators, including coworking wet labs, nearly doubled the submarket’s inventory to 298,800 square feet, pushing it past both Hudson Square and United Nations-Turtle Bay.
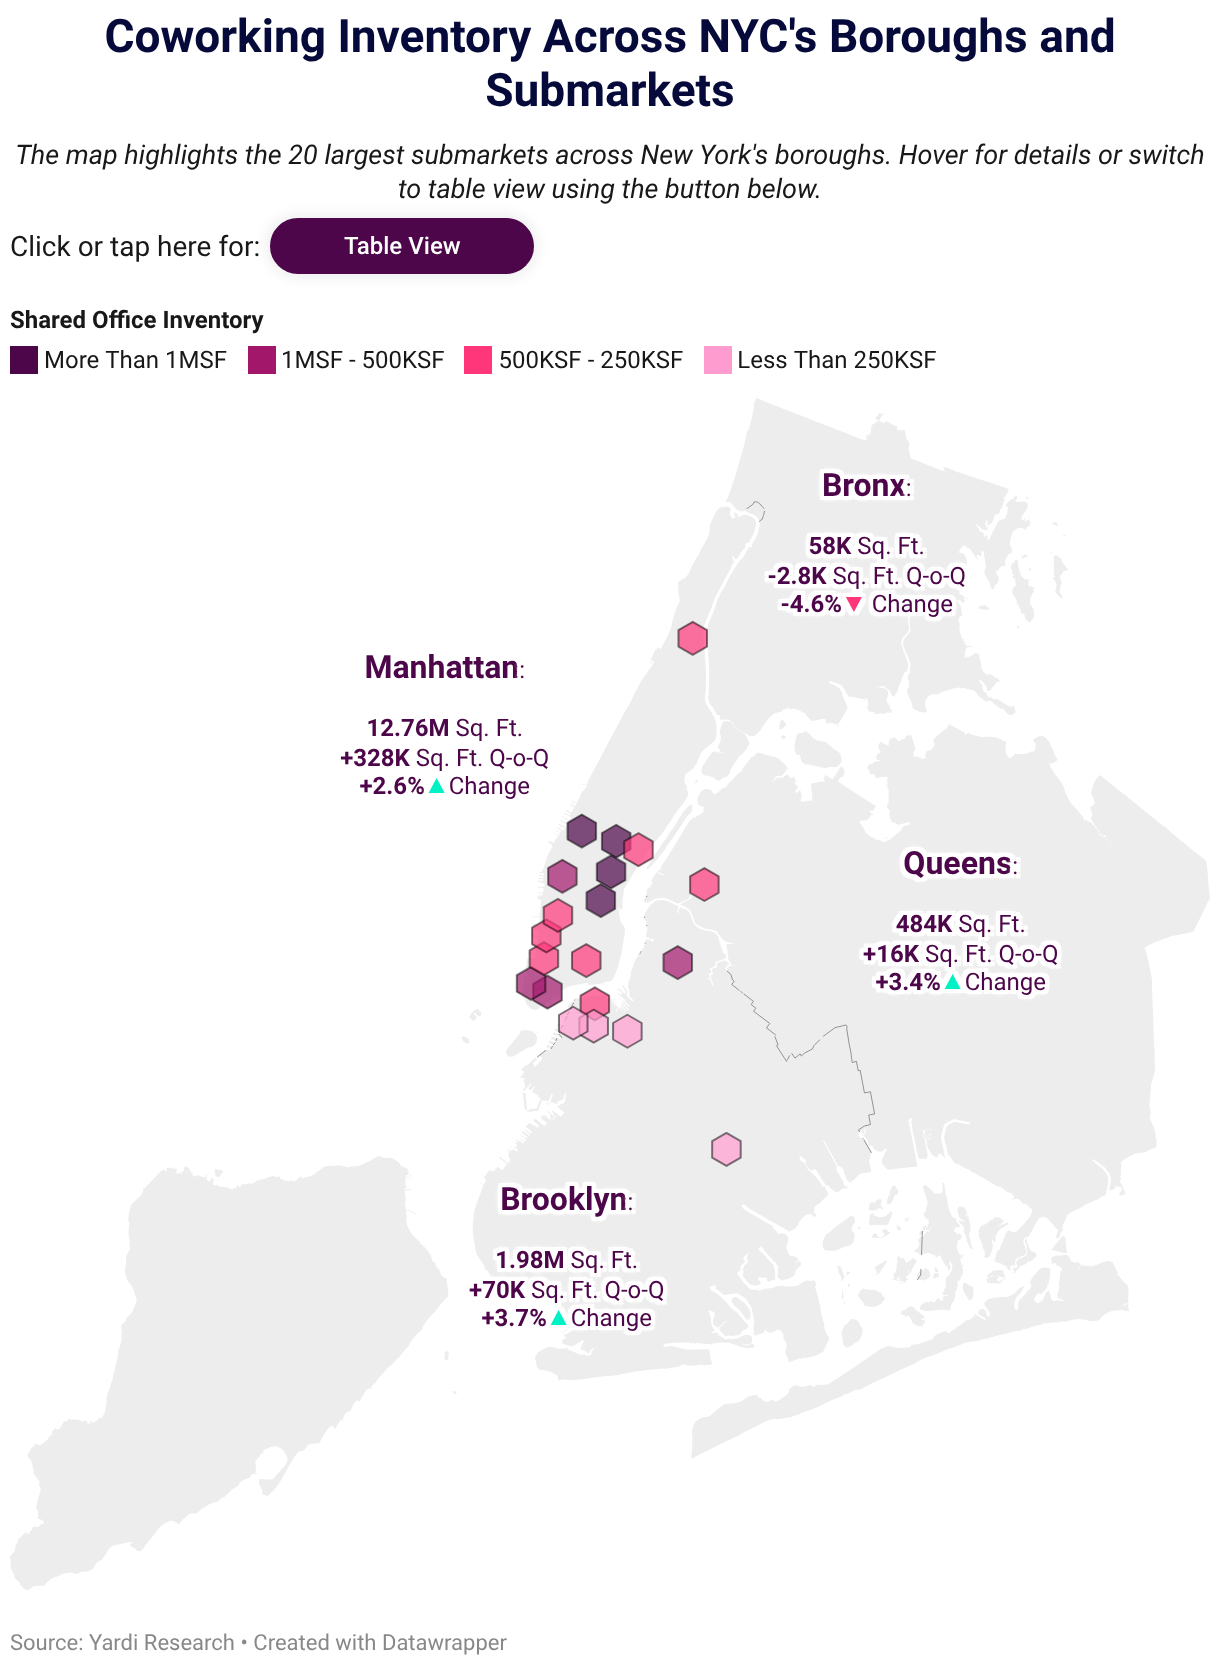
Brooklyn’s flex inventory grew 3.7% Q-o-Q — the sharpest percentage gain of any borough — driven by additions in Williamsburg-Greenpoint and DUMBO. In three Brooklyn submarkets (Williamsburg-Greenpoint, Crown Heights-Central Brooklyn and DUMBO-Vinegar Hill), shared space now exceeds 10% of total office inventory.
Even as inventory grew, average per-desk pricing in Manhattan slipped to $785 per month, pulling the citywide figure down to $778. In Brooklyn, per-desk prices for private offices grew by 8.9% in the first quarter, reaching $716 per month.
Looking Ahead
NYC’s Continued Office Recovery Hinges on Hybrid Work Dynamics
Q1’s numbers suggest NYC’s office market is rebalancing along two paths: Traditional leases are tightening in the city’s premium submarkets, while flex inventory continues to expand city-wide. The gap between NYC and the national market may narrow if Manhattan rental activity tempers into Q2 and beyond, while flex office expansion driven by hybrid companies may help absorb more office stock nationwide.
About the data
This analysis draws on the Q1 2026 NYC office report from Hubble, a flex office space platform originally launched in the UK that recently launched in the U.S. Hubble has been part of the Yardi family of brands since 2025.
Methodology
Hubble’s quarterly report covers coworking inventory, shared office pricing and traditional office indicators across the New York City market.
Shared space inventory, asking rents and vacancy data were sourced from Yardi Research. Private office desk pricing was sourced from Hubble listing data.
Coworking (or flexible) space inventory refers to office inventory operated by coworking, serviced office and managed office providers. Quarter-over-quarter (Q-o-Q) changes in coworking inventory were reported in both absolute and percentage terms. The ratio of coworking space out of total inventory is calculated as coworking space inventory divided by total office inventory.
Average desk prices represent the average monthly listing price for a private office desk based on active Hubble listings during the reporting period.
To ensure statistical reliability, headline Desk Price figures are reported only for boroughs with at least 10 listings with pricing included and borough divisions with at least 5 listings with pricing included. Desk Price by Office Size segments average monthly desk pricing by the size of the private office using a lower threshold of at least 5 listings with pricing per borough and at least 3 listings with pricing per subdivision. Boroughs and subdivisions that fall below these thresholds are omitted from the corresponding tables.
Asking Rent refers to the average full-service (or “full-service equivalent”) asking rent per square foot per year for traditional office space that was available as of the report period.
Vacancy rates do not include owner-occupied properties.
Reporting periods are defined as follows:
- Q4 2025 — Data as of the end of December 2025.
- Q1 2026 — Data as of the end of March 2026.
Fair Use & Redistribution
We encourage and freely grant permission to reuse and repost information, analysis, charts, tables and images included on this page. When doing so, we only ask that you link back to this page or HubbleHQ.com as the official source.
Want to stay on top of the real estate market?
Access comprehensive property data and ownership information with intuitive research tools.

Lucian is a senior content writer for CommercialCafe, specializing in commercial real estate research and data-driven reporting since 2019. With deep expertise in industrial real estate, office markets, demographics, and economics, he produces comprehensive market studies and insights on national and regional CRE trends. He also reports on adjacent subjects such as population shifts and the job market. His reports have been cited by and featured in The New York Times, Forbes, NBC, Bisnow, The Business Journals, and Yahoo Finance. Lucian holds a background in language and literature studies and brings more than 5 years of previous freelance writing experience to his commercial real estate journalism.
Recent Reports

Locked-In Owners, Mobile Renters: Homeowners Stay Put as Renters Move 3.7x More Across Largest U.S. Cities
Renters became the primary drivers of long-distance mobility across the largest U.S. cities, moving 3.7 times more than owners in 2024, as high mortgage rates and housing costs kept many homeowners in place.
$4.6M Hudson Yards Maintains Top Spot, Luxury Sales in Malba Set $2.5M Price Record for Queens
Despite prices declining, Hudson Yards remained the most expensive NYC neighborhood, but TriBeCa’s growth closed the gap to under $400,000, while Malba set a new historic price record for Queens at $2.5 million, securing the highest ranking ever for the borough at #5.
2026 Q1 Foreclosure Report: Brooklyn Filings Fall Sharply, Bronx & Staten Island Hit New Peaks
Behind a deceptively mild citywide downtick, borough foreclosure markets pulled into significantly diverging paths as Brooklyn cases were nearly halved and the Bronx hit a new, record high. Meanwhile, Queens remained unchanged, Staten Island surged back up and Manhattan cooled slowly.