

Market Studies | RELEASED ON June 4, 2026
World Cup or Your Mortgage/Rent? Ticket Prices Rival Host City Housing Costs
Eliza Theiss | 9 minute read
World Cup ticket prices rival monthly housing expenses in the 11 U.S. host cities, with even the cheapest seats covering weeks or even months of rent or mortgage payments.
Editor’s note: Ticket prices will continue to fluctuate regularly due to dynamic pricing and demand. Rankings reflect the lowest publicly referenced prices at the time of writing (June 4, 2026) and may change closer to the tournament and as the tournament progresses toward the final.
Key Takeaways:
- In five cities, the cheapest ticket to the most expensive game in town costs at least as much as one month’s rent or mortgage
- The cheapest World Cup final ticket can cover six weeks of NYC rent and nearly two months of NYC mortgage payments
- The best-priced semi-final tickets cost as much as one month’s mortgage or five to six weeks of rent in Atlanta and Dallas
- A quarter-final ticket costs more than one month’s mortgage or rent in Kansas City, Mo. or roughly one-third of the average Boston rent or mortgage payment
- Miami residents would have to pay one month’s mortgage or rent to see Colombia play Portugal, the most anticipated World Cup match so far
- To see Team USA, Seattle residents are paying at least one quarter of their monthly mortgage or half of their rent, while LA attendees are dropping more than half a month’s rent or one-third of their monthly mortgage
With World Cup ticket prices a recurring news theme in recent weeks, we explored exactly what 2026 tournament tickets translate to for the average American, specifically in terms of housing costs. Put simply, we compared ticket prices to the average local rent and average estimated mortgage payment in the 11 U.S. host cities.
To that end, for each city, we researched the cheapest ticket available to the most expensive group-stage game and the overall most expensive game (at the time of publication). As expected, the most expensive games overall are the final, semi-finals and quarter-finals.
Next, we determined the estimated monthly mortgage payment for each city (referenced as average monthly mortgage in this article) based on the local median sale price and a standard 30-year mortgage with a 6.5% interest rate and 20% down payment. Then, we pulled rental data from Rentcafe and compared mortgage and rent metrics to ticket prices.
With kick-off just days away, the gap is already stark: In five of the 11 host cities, the cheapest knockout-stage tickets cost at least a full month’s mortgage or rent. Even the lowest-priced quarter-final seat ($1,333 for Match 97 in Boston) covers one-quarter of a local’s average monthly mortgage payment or one-third of their rent.
Semi-final seats run even higher: The cheapest ticket costs as much as about a month’s mortgage for Atlanta and Dallas residents or five to six weeks of rent. Meanwhile, the lowest-priced World Cup final ticket costs the average New Yorker nearly two months’ mortgage payments or more than six weeks of rent.
Of course, the notable exception is the group-stage Colombia versus Portugal, which is pricier than all matches except the final (so far). But, beyond the highly anticipated Colombia-Portugal showdown, group-stage games are still rivaling locals’ mortgage payments and rent.
In fact, in eight of the 11 U.S. host cities, the cheapest seat at a top-rated group-stage game would cost locals at least 10 days of rent or the equivalent of one week’s mortgage.
Miami
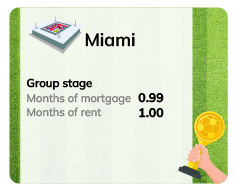
Speaking of the highly anticipated Colombia versus Portugal match, it’s (unsurprisingly) the most expensive game scheduled for Miami Hard Rock Stadium with the cheapest ticket priced at $2,700. So, with Miami’s average estimated monthly mortgage payment sitting at $2,731 and the average rent at $2,696, a ticket to the June 27 game will set locals back a full month’s mortgage or rent.
Furthermore, even a more typical group-stage game — like Scotland versus Brazil — would cost at least $1,673 or more than half a month’s mortgage or rent in Miami.
Philadelphia
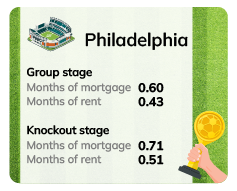
In Philadelphia, Match 89 on July 4 is the most expensive overall match, with even the cheapest ticket priced at $1,006. Comparatively, Philadelphia’s housing market is the most affordable among the 11 host cities with the median sale price now at $280,000 and an average monthly mortgage payment of $1,416.
That means that the priciest World Cup game at Lincoln Financial Field costs nearly as much as three weeks of mortgage payments for a Philadelphia homeowner. Meanwhile, with rents averaging $1,984, Philadelphia renters would pay more than two week’s rent for the same ticket.
For a top-rated group-stage game like Brazil versus Haiti on June 19, locals need to spend at least $855, more than half a month’s mortgage and nearly two weeks of rent.
Kansas City, Mo.
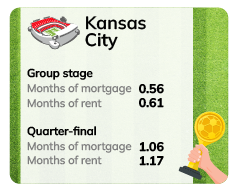
Although the cheapest Arrowhead Stadium ticket to a top-rated group-stage game like Argentina versus Algeria would cost a comparatively lower $823, that price would still cost more than half a month’s mortgage or rent in Kansas City.
Otherwise, locals interested in watching the July 11 quarter-final live at Arrowhead Stadium face a steeper $1,567 ticket. For Kansas City residents, that ticket price easily pays the $1,477 average monthly mortgage or the $1,342 average local rent.
Houston

Houston residents face similar price challenges as the cheapest ticket to the top-rated group game scheduled for NRG Stadium — the June 23 Portugal-Uzbekistan match — is priced at $802. Because the average Houston rent sits at $1,347, even the best deal costs as more than two weeks’ rent. And, for Houston homeowners, it pays half of the $1,679 average monthly mortgage payment.
The priciest overall match in Houston so far is Match 90 on July 4, with opponents yet to be determined but tickets costing at least $854. That would pay a little over half of the monthly mortgage of a local and a good two weeks’ rent.
Dallas
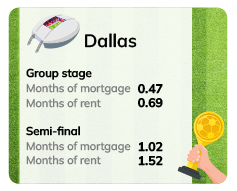
Dallas residents looking to catch a World Cup game at AT&T Stadium would pay at least $1,096 for a top-rated group match like Argentina versus Austria. Considering the $1,578 average rent and the $465,000 median sale price of Dallas resulting in a $2,351 average monthly mortgage payment, even the cheapest ticket would cost almost half of the average monthly mortgage payment or nearly three weeks’ rent.
Plus, locals willing to splurge on a semi-final premium would pay at least $2,391 for the July 14 match. That means that the cheapest ticket to the Dallas semi-final costs as much as one month’s mortgage or six weeks of rent.
NYC
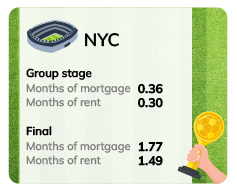
With an average monthly mortgage payment of $4,096 and the average rent at $4,872, New York has one of the most expensive housing markets in the country. Yet, even compared to NYC’s high-cost housing, when it comes to the July 19 final, the premium is through the roof: The cheapest World Cup final ticket is priced at $7,256, meaning locals are looking at spending nearly two months’ mortgage or six weeks’ rent to attend.
What’s more, even more typical World Cup matches at MetLife Stadium carry serious price tags: The cheapest ticket to a top-rated group-stage game like Brazil versus Morocco cost $1,465. That breaks down to one-third of the average NYC rent or mortgage payment.
Atlanta
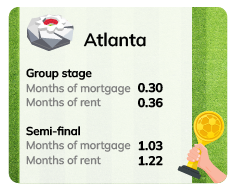
Atlantans interested in a typical World Cup game like the one between Spain versus Saudi Arabia are looking at a $653 ticket at a minimum. So, with Atlanta’s median sale price at $425,000 and rents averaging $1,814, locals are looking at spending about one-third of the average monthly mortgage or rent.
Atlantans wanting to see the July 15 semi-final live at Mercedes-Benz Stadium are contending with a $2,208 minimum get-in price. That means that with the price of a semi-final ticket, Atlanta residents could pay one month’s mortgage or about five weeks’ rent.
Seattle
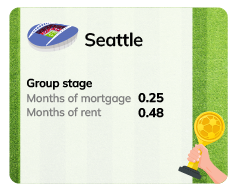
Seattle residents are also no strangers to high housing costs with the median sale price at $865,000 (for an average monthly mortgage payment of $4,374) and a $2,298 average rent. Even so, watching Team USA play Australia at Lumen Field means a minimum ticket price of $1,096 or one-quarter of the local average mortgage and half a month’s rent.
At the date of publication, the group-stage USA versus Australia match is also the city’s most expensive overall game as well, surpassing knockout stage game prices so far.
Boston
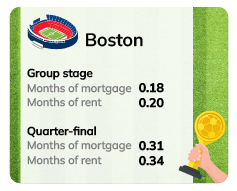
Similar to Seattle, Boston residents are also living in one of the most expensive housing markets in the country — an $850,000 median sale price with a $4,298 monthly mortgage cost and a $3,885 average rent — and will also be hosting a quarter-final game.
That match, scheduled for July 9, now costs at least $1,333, meaning locals would spend more than one-quarter of a month’s mortgage or 10 days rent to attend. Additionally, even a top-rated group-stage game like Norway versus France costs at least $781, or about one-fifth of the local monthly mortgage or rent.
Los Angeles
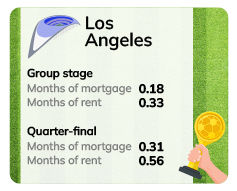
Home team supporters wanting to catch the USA play Paraguay live are looking at a $905 minimum ticket price. Because LA’s average rent is $2,773 and homeowners pay $5,057 per month for their mortgage, Angelenos would have to spend about 10 days’ rent or one-fifth of their monthly mortgage to attend.
As for the July 10 quarter-final, the cheapest ticket available costs $1,564. For Angelenos, that’s one-third of your mortgage or more than two weeks’ rent for a live game at SoFi Stadium.
San Francisco
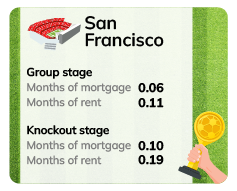
With a weaker group-stage and a high-cost housing market, the math for San Francisco goes somewhat against the other host cities. Specifically, the average San Francisco rent now sits at $3,635, while homeowners are paying an average of $6,842 per month as mortgage expenses.
Here, the cheapest ticket to the top-rated group game at Levi’s Stadium (Paraguay versus Türkiye) is $391 — around 3 days of rent or 6% of their monthly mortgage. Meanwhile, even the most expensive match scheduled for the city — Match 81 on July 1 — costs $682, the equivalent of six days’ rent or 10% of the local monthly mortgage payment.
For Locals, World Cup Tickets Look Like Housing Bills
With kick-off just days away and this edition’s dynamic pricing structure, ticket costs will continue to evolve with many likely to surge further, while some may go down. But, even before the tournament begins, the cheapest seats to the biggest matches are already landing in the same range as major monthly expenses, not just a night out.
Across host cities, that puts the cheapest tickets for top-rated matches at the same level as the cost of a full month’s mortgage or rent — especially once the tournament moves beyond the group stage. And, because the analysis uses the lowest available ticket prices, those figures are only the entry point.
Full Data Table
Explore city-level metrics for the most expensive game in the interactive table below:

Methodology
Ticket prices were researched and verified through the official FIFA World Cup 2026 portal, GameTime, SeatGeek, StubHub, TicketData and Vivid and include both first-sale and resale tickets. Ticket prices were last verified at 7 a.m. EST on June 4, 2026.
Match opponents, dates and locations were sourced through the official FIFA World Cup 2026 portal.
Local median sale prices were sourced from proprietary data and local MLS research and reference figures for April-May 2026.
Estimated average monthly mortgage payments (referenced as average monthly mortgage payments in this article) were determined based on a standard 30-year mortgage with a 6.5% interest rate and 20% down payment, applied to the local median sale price.
Rental data was sourced from Rentcafe.com, a Yardi company and references December 2025 figures.
Fair Use & Redistribution
We encourage and freely grant permission to reuse and repost the information, analysis, charts, tables and images included on this page. When doing so, we only ask that you link back to this page or PropertyShark.com as the official source.
About PropertyShark
PropertyShark is an online real estate database and property research tool that provides building details, ownership information, comparable sales, and foreclosure data. Founded in 2003, PropertyShark serves real estate professionals and consumers in New York and other major U.S. markets.
Want to stay on top of the real estate market?
Access comprehensive property data and ownership information with intuitive research tools.
POSTED IN: Market Studies, National

Eliza Theiss is a senior writer reporting real estate trends in the US. Her work has been cited by CBS News, Curbed, The Los Angeles Times, and Forbes among others. With an academic background in journalism, Eliza has been covering real estate since 2012. Before joining PropertyShark, Eliza was an associate editor at Multi-Housing News and Commercial Property Executive. She has also contributed extensively to CommercialEdge. Reach her at [email protected]
Recent Reports

Locked-In Owners, Mobile Renters: Homeowners Stay Put as Renters Move 3.7x More Across Largest U.S. Cities
Renters became the primary drivers of long-distance mobility across the largest U.S. cities, moving 3.7 times more than owners in 2024, as high mortgage rates and housing costs kept many homeowners in place.

$4.6M Hudson Yards Maintains Top Spot, Luxury Sales in Malba Set $2.5M Price Record for Queens
Despite prices declining, Hudson Yards remained the most expensive NYC neighborhood, but TriBeCa’s growth closed the gap to under $400,000, while Malba set a new historic price record for Queens at $2.5 million, securing the highest ranking ever for the borough at #5.
2026 Q1 Foreclosure Report: Brooklyn Filings Fall Sharply, Bronx & Staten Island Hit New Peaks
Behind a deceptively mild citywide downtick, borough foreclosure markets pulled into significantly diverging paths as Brooklyn cases were nearly halved and the Bronx hit a new, record high. Meanwhile, Queens remained unchanged, Staten Island surged back up and Manhattan cooled slowly.