
New York Real Estate | < 1 minute read
NYC Unaffordability Map Puts Fast Gentrifying Areas in the Limelight
BY Georgiana Mihaila | Aug 21, 2013
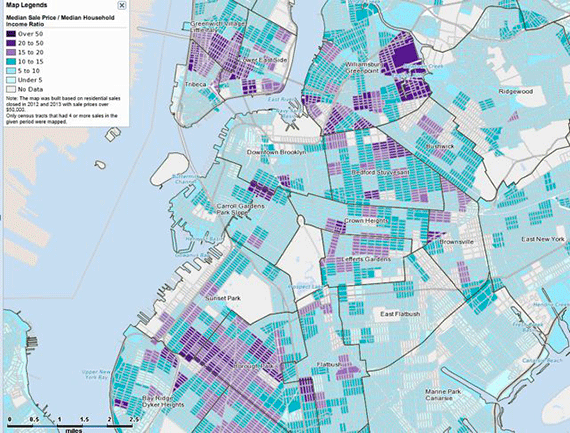
What’s an unaffordability map? Well, it’s what came out of a special request from the Gothamist editorial team, who wanted to see which neighborhoods are gentrifying the fastest.
By measuring the median home sale price in each census tract, divided by the median household income, the map highlights which neighborhoods in the city’s five boroughs are the most expensive, in areas where most people aren’t currently earning that much.
Take a look at our dynamic map, and search for the dark purple markings—that highlight neighborhoods like East Williamsburg where homeowners are paying high prices for their units, despite the fact that most people in the neighborhood are not what you would call top earners.
While elevated prices in neighborhoods like NoLita, Prospect Lefferts Gardens, and Sunset Park are somewhat easier to explain, the areas along Kissena and Parsons Boulevards in Flushing also seem to be gentrifying at a surprisingly fast pace. For further details, check out Gothamist’s coverage of how our unaffordability map identifies the fast gentrifying neighborhoods of NYC.
Census tracts were used to compile the data, with residential sales priced over $50,000 that closed in 2012 and 2013. To get an accurate median sale price, we only looked at census tracts that had 4 or more sales, the gray areas on the map representing either rentals or other commercial properties not included in the report.
Latest Posts
Want to stay on top of the real estate market?
Access comprehensive property data and ownership information with intuitive research tools.
POSTED IN: New York Real Estate

After spending the first 6 years of her career training in the art of real estate alongside the Yardi team, Georgiana went on to become VP of Marketing for Montreal-based fintech company NestReady, then to run the marketing department behind one of the world’s leading self-dev media companies, Goalcast Inc. She’s now combining her passion for engaging content with a long-lasting addiction to real estate on FancyPantsHomes.com
Recent Reports
NYC Homeownership by the Numbers: How Household Type, Gender & Age Shape Who Owns in Every Neighborhood
In a city where homeownership is dominated by married-couple families, Manhattan stands as the only borough led by nonfamily owners. At the same time, residents younger than 35 make up less than one tenth of the ownership pool and female-led family households outnumber male-led families across 91% of NYC neighborhoods.

Prices Rise in 32 of NYC’s Leading Neighborhoods as City and Manhattan Hit Record Highs
Q2 2026 saw NYC and Manhattan reach historic highs, with Brooklyn and Queens marking close to new records as well. Meanwhile, Hudson Yards remained at the top, Central Midtown posted its highest price ever and Carroll Gardens marked its third consecutive quarter over $2 million

2026 Q2 Foreclosure Report: Bronx Caseload Hits 7-Year High, Brooklyn & Manhattan Slow to 4-Year Low
Manhattan yet again slowed to become the city’s least active foreclosure market, Brooklyn’s caseload dropped so low it barely edged out Staten Island, while the Bronx heated up enough to surpass all boroughs except Queens.