

Commercial Real Estate | RELEASED ON July 28, 2026
Brooklyn Emerges as NYC’s Coworking Growth Engine, Manhattan Rents Cross $100 in the Plaza District
Lucian Alixandrescu | 5 minute read
New York City's office market continued to lead the U.S. in Q2, but internal shifts were most visible in the flex office market. Brooklyn’s coworking inventory grew 6.2% Q-o-Q even as Manhattan’s supply retreated. At the same time, Brooklyn's asking rents for traditional office leases climbed more than twice as fast as the national average.
Key Takeaways:
- Brooklyn’s coworking inventory grew 6.2% Q-o-Q to 2.1 million square feet, adding a net 122,600 square feet even as Manhattan shed 200,800
- Several submarkets with low coworking inventory saw growth in Q2, led by the Bay Ridge-Sunset Park area which expanded its footprint by 74% in a single quarter
- Manhattan asking rents rose 3.2% Q-o-Q to just above $72 per square foot, ahead of the 2.7% national average rent growth
- The Plaza District broke $100 per sq. ft. in asking rents, reaching $107.46 to hold on to the title of NYC’s most expensive submarket
- Brooklyn asking rents jumped 6.9% Q-o-Q to $39.46 per square foot, the sharpest borough-level gain in NYC
In Q2 of 2026, Manhattan vacancies held steady at 13.1% while Brooklyn asking rents accelerated than its neighbor Manhattan and the national market. Meanwhile, the coworking market underwent borough-level changes, with Brooklyn expanding as Manhattan pulled back. These metrics, captured in Hubble’s Q2 2026 NYC office report covering both shared and traditional office space, point to a NYC office market rebalancing both against the national trend and internally between its boroughs.
Office Space Vacancies
Manhattan Vacancy Holds at 13.1%, Preserves 450-Bps Gap with the National Market
Manhattan’s vacancy rate held at 13.1% at the end of June, unchanged from March and preserving a gap of approximately 450 basis points (bps) below the national benchmark. The national rate was also largely unchanged quarter-over-quarter (Q-o-Q), meaning the Manhattan-U.S. gap maintained its size between March and June. Queens office spaces posted the sharpest borough-level improvement, with vacancy falling 170 bps to 22.8%, while Brooklyn’s vacancy edged up to 14.6% — 150 bps above Manhattan.
With office occupancy figures also remaining mostly level throughout 2026, the next question is whether Q2’s flat vacancy rates are temporary or a first indication of the current occupancy equilibrium.

Office Space Asking Rents
Traditional Asking Rents Climb 3.2% in Manhattan as Plaza District Crosses $100 per Sq. Ft.
While the national average asking rent increased 2.7% in Q2 to $33.67 per square foot, Manhattan asking rents rose a sharper 3.2% Q-o-Q to just above $72 per square foot. Brooklyn recorded an even steeper 6.9% gain over the same period, reaching $39.46, while Queens offices climbed 4.6% Q-o-Q to $41.52 and the Bronx dipped 0.4% Q-o-Q to remain below the national baseline.

The Plaza District extended its lead as NYC’s most expensive submarket, with asking rents reaching $107.46 per square foot, making it the only submarket to cross the $100 threshold in Q2. Chelsea followed at $94.16 per square foot, then SoHo at $88.41per square foot. The Harlem-North Manhattan area led Upper Manhattan at $50.73 per square foot. Outside Manhattan, Brooklyn Heights held its borough lead at $56.31 per square foot, remaining flat quarter-over-quarter, while Queens’ Jackson Heights-Elmhurst area posted the next highest figure outside Manhattan at $50 per square foot.
At the other end of the range, Williamsburg-Greenpoint was the city’s most affordable submarket at $26.29 per square foot, followed by the South Bronx ($27.20) and the Fordham Corridor ($29).
Coworking & Flex Inventory
City-Wide Coworking Dips to 15.2M Sq. Ft., Brooklyn Partly Absorbs Manhattan’s Q2 Contraction
NYC’s coworking and flex office inventory contracted slightly to 15.2 million square feet at the end of Q2, down from 15.3 million at the end of Q1. Manhattan alone shed 200,800 square feet — roughly 1.6% of its inventory — as several coworking, creative office and shared lab locations closed or scaled down. The decrease is smaller than the 328,000 square feet Manhattan added in Q1 and likely reflects a temporary consolidation rather than a structural pullback.
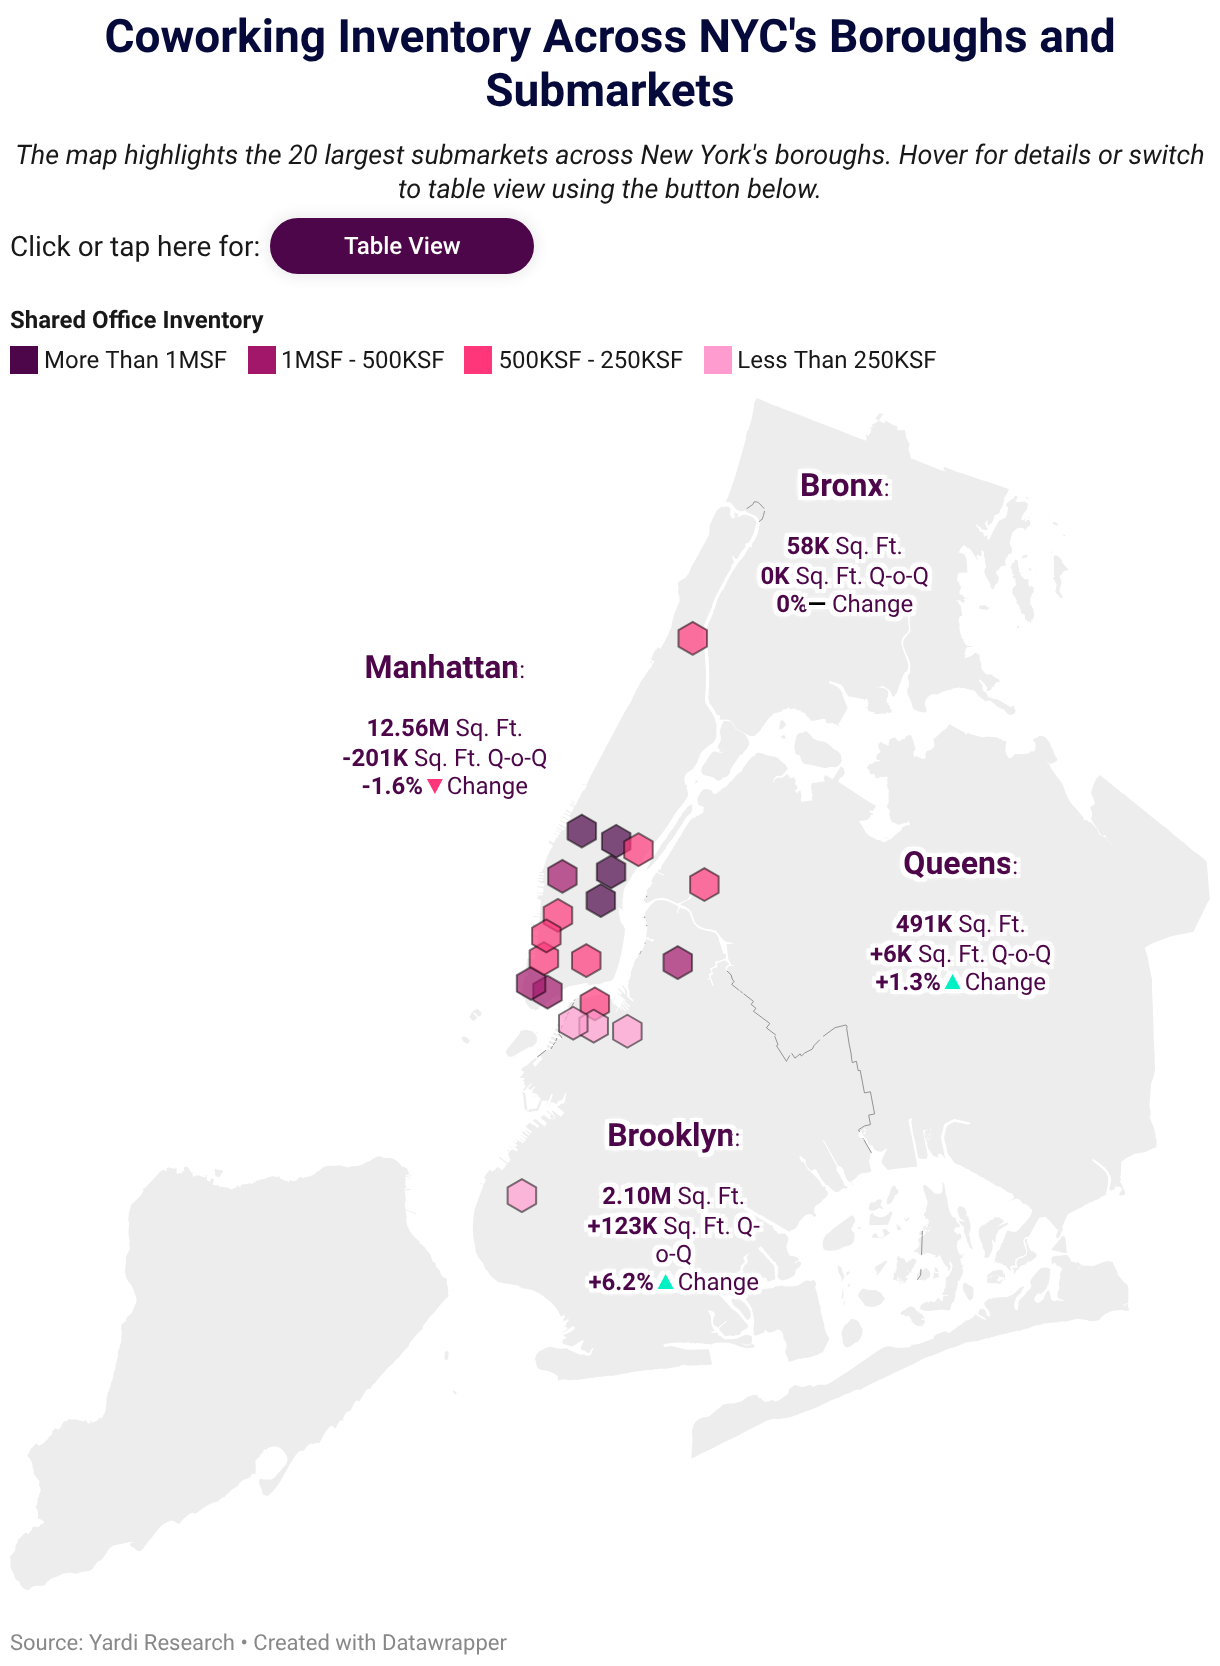
Nonetheless, individual Manhattan submarkets still posted gains. Gramercy Park added another 27,800 square feet on top of its Q1 gains and Greenwich Village grew by nearly 62,000 square feet to reach a total of 329,800 square feet. Still, those additions were outweighed by contractions in Midtown and Lower Manhattan: The World Trade Center submarket lost 61,900 square feet, United Nations-Turtle Bay 64,500 square feet and Times Square-Hell’s Kitchen 73,900 square feet.
Brooklyn expanded 6.2% Q-o-Q to reach 2.1 million square feet, adding 122,600 square feet and nearly offsetting Manhattan’s decline. Coworking now accounts for 4.7% of Brooklyn’s total office inventory (up 30 bps compared to Q1), against Manhattan’s 2.5% and a national benchmark of 2.3%.
The Bay Ridge-Sunset Park submarket led the borough’s expansion, adding 77,800 square feet to grow its inventory by 74% to 183,000 square feet. Central and South Brooklyn added 31,600 square feet, followed by Bushwick-Bedford-Stuyvesant with 30,600 square feet and Williamsburg-Greenpoint with 18,000 square feet. Queens, meanwhile, added 6,200 square feet, while the Bronx remained unchanged.

Manhattan per-desk pricing rebounded 4.6% Q-o-Q to $821, with Lower Manhattan extending its lead as the priciest area at $947 per desk. Brooklyn per-desk pricing was almost flat quarter-over-quarter at $720. Across all office sizes, Brooklyn remained more affordable, coming in 20% below the Manhattan average for one- to five-desk offices and 31% cheaper in the 11-to-20-desks category.
Looking Ahead
Two-Track Rebalancing Sharpens as Brooklyn Absorbs Coworking Demand
Q2’s numbers highlight the two office shaping the New York office market: Traditional leases are still tightening in Manhattan’s premium submarkets, but the coworking growth engine continues to favor undersupplied areas.
Whether Manhattan’s Q2 coworking contraction proves to be a one-quarter correction or the start of a longer geographic redistribution will depend on how Q3 leasing activity absorbs the vacated Midtown and Lower Manhattan office inventory. Tenant appetite for hub-and-spoke offices remains strong, but sustained demand will likely be a prerequisite before operators commit to more locations outside the Manhattan core.
About the data
This analysis draws on the Q1 2026 NYC office report from Hubble, the largest flex office space platform in the United Kingdom that recently launched in the U.S. Hubble has been part of the Yardi family of brands since 2025.
Methodology
Hubble’s quarterly report covers coworking inventory, shared office pricing and traditional office indicators across the New York City market.
Shared space inventory, asking rents and vacancy data were sourced from Yardi Research. Private office desk pricing was sourced from Hubble listing data.
Coworking (or flexible) space inventory refers to office inventory operated by coworking, serviced office and managed office providers. Quarter-over-quarter (Q-o-Q) changes in coworking inventory were reported in both absolute and percentage terms. The ratio of coworking space out of total inventory is calculated as coworking space inventory divided by total office inventory.
Average desk prices represent the average monthly listing price for a private office desk based on active Hubble listings during the reporting period.
To ensure statistical reliability, headline Desk Price figures are reported only for boroughs with at least 10 listings with pricing included and borough divisions with at least 5 listings with pricing included. Desk Price by Office Size segments average monthly desk pricing by the size of the private office using a lower threshold of at least 5 listings with pricing per borough and at least 3 listings with pricing per subdivision. Boroughs and subdivisions that fall below these thresholds are omitted from the corresponding tables.
Asking Rent refers to the average full-service (or “full-service equivalent”) asking rent per square foot per year for traditional office space that was available as of the report period.
Vacancy rates do not include owner-occupied properties.
Reporting periods are defined as follows:
- Q1 2026 — Data as of the end of March 2026.
- Q2 2026 — Data as of the end of June 2026.
Fair Use & Redistribution
We encourage and freely grant permission to reuse and repost information, analysis, charts, tables and images included on this page. When doing so, we o
Want to stay on top of the real estate market?
Access comprehensive property data and ownership information with intuitive research tools.


Lucian is a senior content writer for CommercialCafe, specializing in commercial real estate research and data-driven reporting since 2019. With deep expertise in industrial real estate, office markets, demographics, and economics, he produces comprehensive market studies and insights on national and regional CRE trends. He also reports on adjacent subjects such as population shifts and the job market. His reports have been cited by and featured in The New York Times, Forbes, NBC, Bisnow, The Business Journals, and Yahoo Finance. Lucian holds a background in language and literature studies and brings more than 5 years of previous freelance writing experience to his commercial real estate journalism.
Recent Reports
NYC Homeownership by the Numbers: How Household Type, Gender & Age Shape Who Owns in Every Neighborhood
In a city where homeownership is dominated by married-couple families, Manhattan stands as the only borough led by nonfamily owners. At the same time, residents younger than 35 make up less than one tenth of the ownership pool and female-led family households outnumber male-led families across 91% of NYC neighborhoods.

Prices Rise in 32 of NYC’s Leading Neighborhoods as City and Manhattan Hit Record Highs
Q2 2026 saw NYC and Manhattan reach historic highs, with Brooklyn and Queens marking close to new records as well. Meanwhile, Hudson Yards remained at the top, Central Midtown posted its highest price ever and Carroll Gardens marked its third consecutive quarter over $2 million

2026 Q2 Foreclosure Report: Bronx Caseload Hits 7-Year High, Brooklyn & Manhattan Slow to 4-Year Low
Manhattan yet again slowed to become the city’s least active foreclosure market, Brooklyn’s caseload dropped so low it barely edged out Staten Island, while the Bronx heated up enough to surpass all boroughs except Queens.