

Metro New York Foreclosure Report
Updated: NYC Foreclosures Up 43% Year-over-Year in Q1
RELEASED ON April 5, 2017 | 4 minute read
Note: This article was updated on July 7. The initial stats under-reported Q1 2017 foreclosure numbers due to an error in exporting data. Please check at the end of the article the corrections that were made to the original stats. Key takeaways New foreclosure cases in NYC were up 43% Y-o-Y in Q1 2017 Brooklyn residential foreclosures surged 113% as 168 homes were scheduled in Q1 2017 compared to 79 homes in Q1 2016 Queens foreclosures recorded a 61% increase Y-o-Y with 350 new cases in Q1 2017 3,082 lis pendens cases were filed against NYC homeowners in Q1 2017 – down 16% year-over- year NYC foreclosures up 43% in the first quarter of 2017 The first quarter of 2017 brought an increase in NYC residential foreclosures as 702 homes were scheduled for auction for the first time, compared to 492 in Q1 2016. Compared to the prior quarter, numbers are up by 49% and the first quarter of 2017 recorded the highest number of auctions in the past 3 years. Foreclosed Homes in Brooklyn Surge 113% Y-o-Y in Q1 New foreclosure cases in Brooklyn more than doubled in Q1 2017 when 168 homes were scheduled for auction compared…
Note: This article was updated on July 7. The initial stats under-reported Q1 2017 foreclosure numbers due to an error in exporting data. Please check at the end of the article the corrections that were made to the original stats.
Key takeaways
- New foreclosure cases in NYC were up 43% Y-o-Y in Q1 2017
- Brooklyn residential foreclosures surged 113% as 168 homes were scheduled in Q1 2017 compared to 79 homes in Q1 2016
- Queens foreclosures recorded a 61% increase Y-o-Y with 350 new cases in Q1 2017
- 3,082 lis pendens cases were filed against NYC homeowners in Q1 2017 – down 16% year-over- year
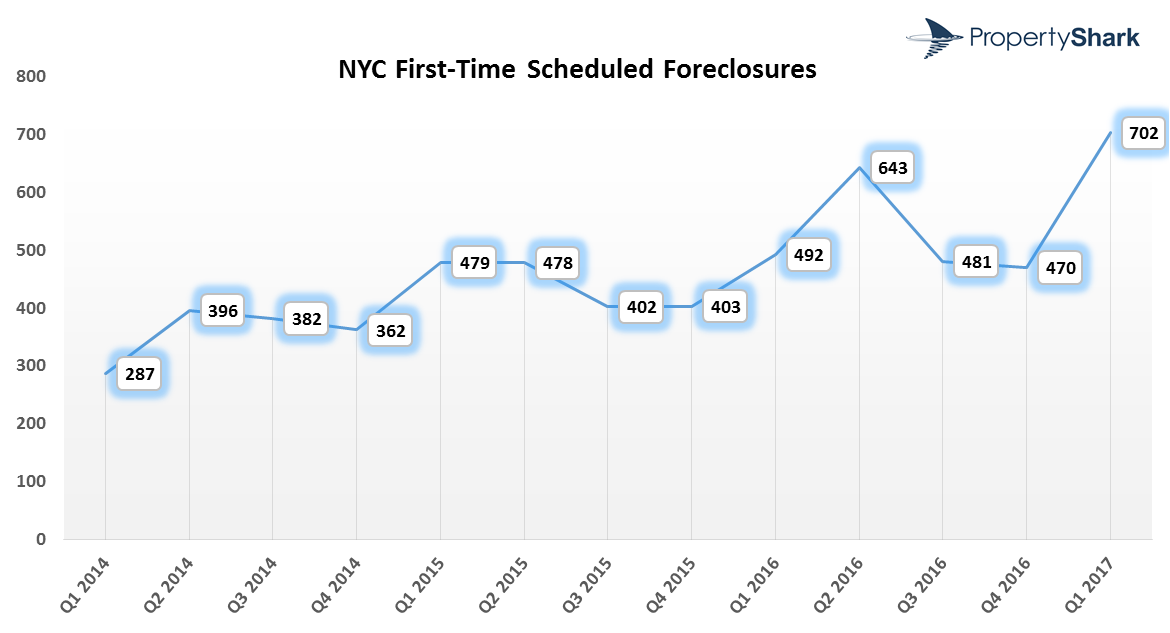
NYC foreclosures up 43% in the first quarter of 2017
The first quarter of 2017 brought an increase in NYC residential foreclosures as 702 homes were scheduled for auction for the first time, compared to 492 in Q1 2016. Compared to the prior quarter, numbers are up by 49% and the first quarter of 2017 recorded the highest number of auctions in the past 3 years.
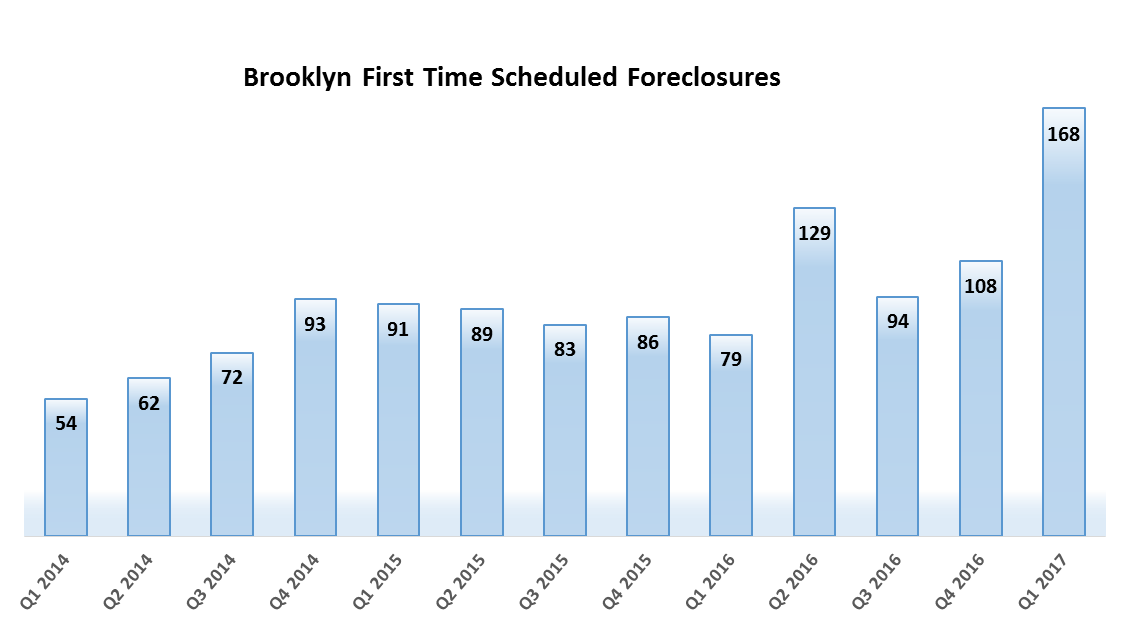
Foreclosed Homes in Brooklyn Surge 113% Y-o-Y in Q1
New foreclosure cases in Brooklyn more than doubled in Q1 2017 when 168 homes were scheduled for auction compared to 79 in Q1 2016. Earlier this year, a special Brooklyn report by PropertyShark revealed that Brooklyn foreclosures have been going up steadily for the past 5 years with most cases concentrated in the borough’s eastern part. The first quarter of 2017 brought even more cases to the borough, triple the number recorded in Q1 2014 when only 54 homes were scheduled for auction.
Zip code 11236, covering Canarsie, had a total of 21 foreclosures in Q1 2017 and is still Brooklyn’s area with highest foreclosure activity.
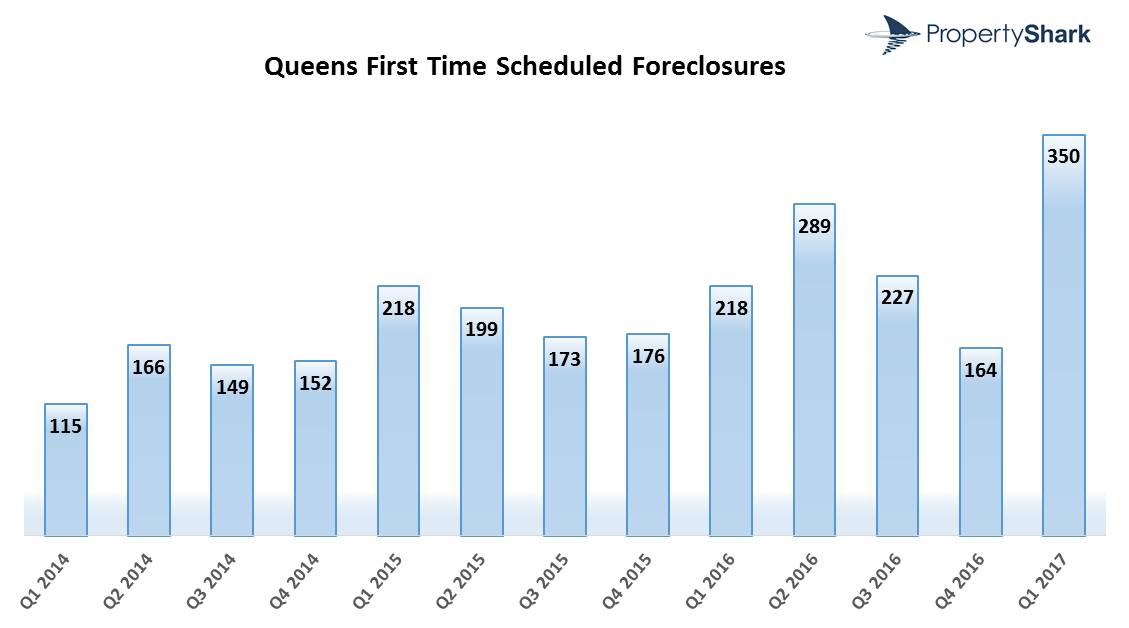
Queens Foreclosures Up 61 % Y-o-Y in Q1 2017
New foreclosure cases in Queens reached a new height in Q1 2017 and the borough accounted for half the cases recorded in NYC. The number of new cases went up 61% Y-o-Y – 350 homes scheduled in Q1 2017 compared to 218 in the same quarter of 2016.
With 27 first-time foreclosures, Jamaica’s 11434 is the area in Queens with most new cases filed in Q1 2017, which doesn’t come as a surprise given that Southeastern Queens has consistently been the borough’s foreclosure hotspot.
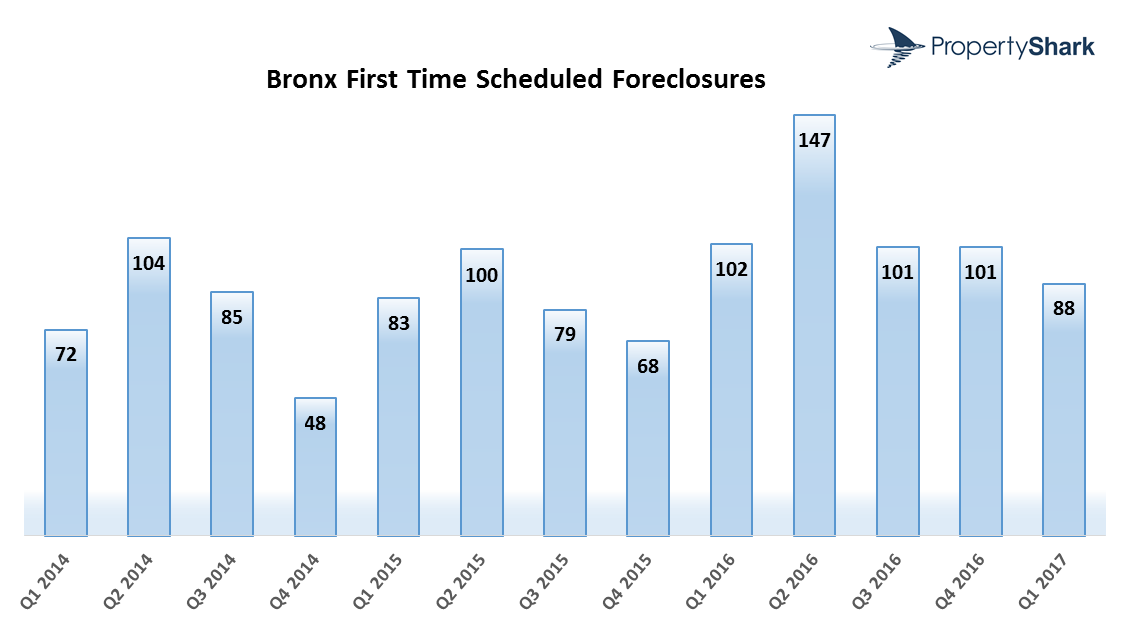
New foreclosures in the Bronx down 14% Y-o-Y in Q1
The Bronx had a rough year in 2016, when foreclosure cases surged 37% and each quarter recorded over 100 cases, with the highest numbers seen in Q2 2016, when 147 homes were scheduled for auction. The start of 2017 brings with it some respite, as cases are down 14% year-over-year, the Bronx now being far behind Brooklyn in terms of total properties foreclosed, 88 in the Bronx compared to 168 in Brooklyn.
In the Bronx, zip code 11462 – partially covering the neighborhoods of Van Nest, Parkchester, and Union Port – is the area with the highest foreclosure activity with 18 first-time cases.
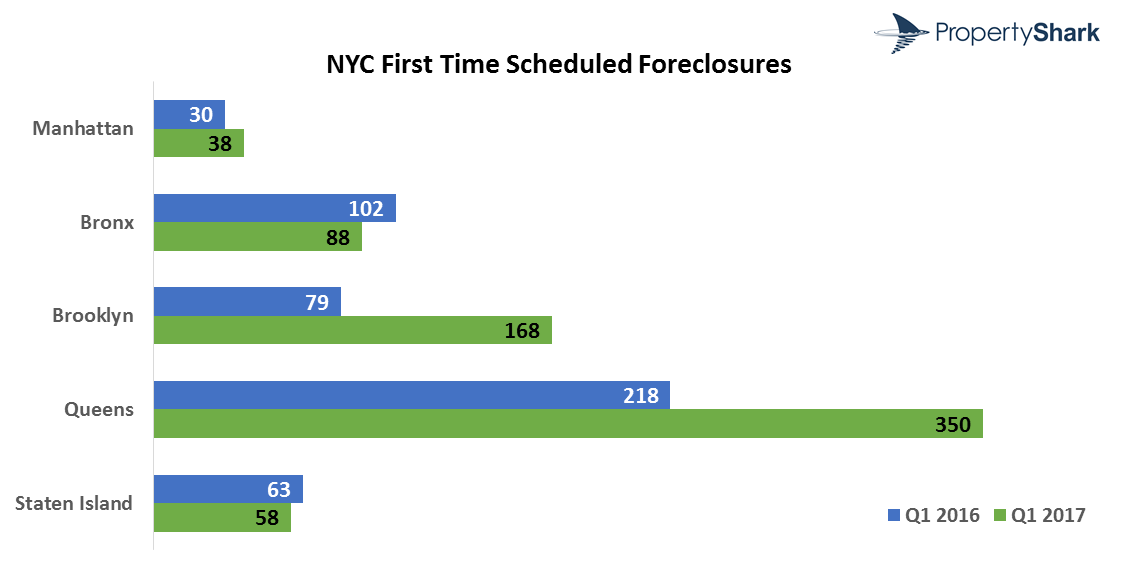
Manhattan and Staten Island Still See Low Foreclosure Numbers
Foreclosures in Manhattan continue to be a rare sight with only 38 new foreclosed homes in Q1 2017, a 27% increase Y-o-Y but the numbers remain low in the borough. In Staten Island, 58 foreclosures were filed against homeowners, down 8% Y-o-Y.
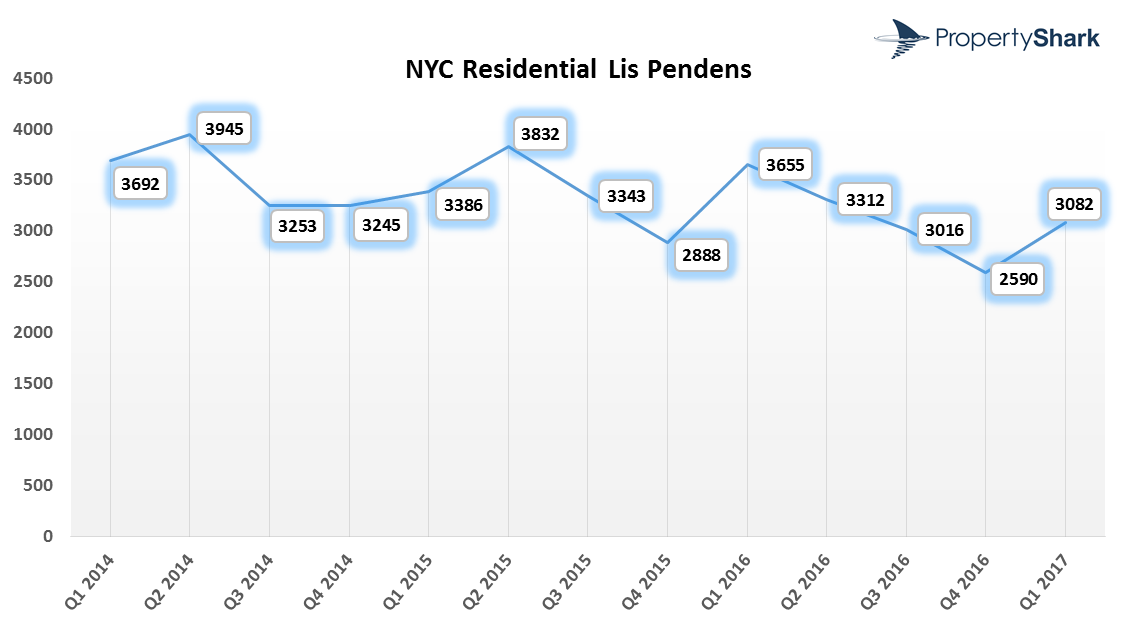
NYC pre-foreclosures continue on descending path
The number of homes entering pre-foreclosure has been going down in NYC for the past years and the first quarter of 2017 followed on the same path. 3,082 homeowners had a lis pendens case recorded on their properties in Q1, translating into a 16% decrease year-over-year.
Of all the boroughs, the biggest slowdown was seen in the Bronx, where 23% fewer pre-foreclosure cases were filed, followed by Manhattan with a 20% decrease.
Methodology
Our report focuses on residential properties that are scheduled for auction for the first time. Auction postponements are fairly common and by removing them from our analysis we avoid over-reporting the number of properties affected by foreclosure. Residential properties included are single-family or two-family homes, or condo or co-op units.
Pre-foreclosure data refers to unique properties that received at least one Lis Pendens filing in Q1 2017. This may be a first-time filing or a re-filing. The same building class restrictions apply (excluding co-ops). If more than 3 units were referenced on the same Lis Pendens filing they were not counted at all in order to avoid counting entire buildings under Lis Pendens.
Note: A previous version of this article was based on incorrect foreclosure numbers for Q1 2017 and they have been updated on July 7, 2017. The initial numbers of new foreclosure cases used to compile the stats were: New York City: 418; Manhattan: 27; the Bronx: 68; Brooklyn: 98; Queens: 184; Staten Island: 41.
Access Every New York Foreclosure — First.
Get full access to NYC foreclosures, pre-foreclosures, REOs & auctions. Updated daily with lien & owner data. 100% coverage.
POSTED IN: Market Studies, New York Foreclosures

With 10+ years of experience at PropertyShark, Andra covers the latest product updates and market reports for our blog. Her work has been featured in The Real Deal, Curbed, TimeOut, The Daily Mail, Business Insider, Crain’s New York.
Recent Reports

NYC Resale Gains & Losses: Every Borough Made Money in 2025, Except Manhattan
In 2025, NYC home-sellers mostly made money. But, in Manhattan, resales came with losses — and it was apartments and recent buyers that absorbed them.

World Cup or Your Mortgage/Rent? Ticket Prices Rival Host City Housing Costs
World Cup ticket prices rival monthly housing expenses in the 11 U.S. host cities, with even the cheapest seats covering weeks or even months of rent or mortgage payments.

Locked-In Owners, Mobile Renters: Homeowners Stay Put as Renters Move 3.7x More Across Largest U.S. Cities
Renters became the primary drivers of long-distance mobility across the largest U.S. cities, moving 3.7 times more than owners in 2024, as high mortgage rates and housing costs kept many homeowners in place.