

RELEASED ON August 10, 2020
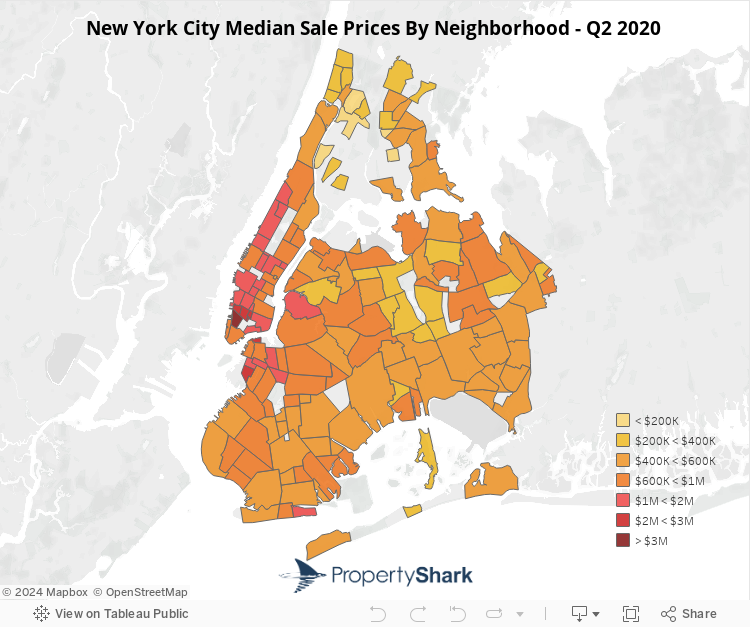
The NYC Neighborhood Report: 44 Neighborhoods Closed Fewer Than 5 Sales Under Q2 Pandemic Pressure
Eliza Theiss | 10 minute read
Hudson Yards is among 44 NYC neighborhoods that closed fewer than 5 sales as sales activity fell 42% across the four boroughs during a tumultous Q2.
Key Takeaways:
- TriBeCa retakes #1 spot with $3.73 million median
- Previous quarter’s #1 Hudson Yards excluded due to insufficient sales activity
- For the first time ever, Brooklyn has more neighborhoods in the top 50 most expensive than Manhattan
- Median sale price surges 147% in the Bronx’s Kingsbridge
- Only 15 NYC neighborhoods experienced sales activity growth, with Gowanus’ 230% surge in the lead
- At nearly $2.1 million, DUMBO is Brooklyn’s most expensive neighborhood
- Manhattan sales activity halved, Brooklyn down only 32%
- The Bronx registered sharpest median sale price gains at +12.5% Y-o-Y, closely followed by Queens at +12.3% Y-o-Y
Marked by strict lockdowns, the halt of economic activity and, regrettably, the loss and suffering brought on by COVID-19, New York City’s real estate market was bound to present a decidedly different picture in the second quarter both year-over-year (Y-o-Y) and quarter-over-quarter (Q-o-Q).
First, it’s important to note that a record 44 NYC neighborhoods closed fewer than five deals last quarter — a metric we consider lowest minimum threshold for calculating a neighborhood’s median sale price. As a result, these neighborhoods are not represented in our findings. In total, we analyzed the second quarter’s median sale price and sales activity changes in 157 NYC neighborhoods.
Next, the most notable change was brought on by Brooklyn, which — for the first time ever — had more neighborhoods among the city’s most expensive than Manhattan. Specifically, of the 52 neighborhoods that were ranked as the city’s 50 most expensive (due to two ties), Brooklyn claimed 23 entries versus Manhattan’s 21 neighborhoods, while Queens was represented by eight areas.
Read on for a complete picture of the city’s neighborhood evolution in Q2, and make sure to check out the interactive table at the bottom of the page for a snapshot of NYC’s neighborhoods.
Pandemic-Depressed Market Slashes Manhattan Sales in Half, Brooklyn Sales Only by a Third
Overall, the median sale price for the four boroughs contracted 2% Y-o-Y in Q2 and gained 4% Q-o-Q stabilizing at $675,178. But, while the four boroughs’ median remained largely unchanged, sales activity plummeted — 36% Q-o-Q and 43% Y-o-Y. In particular, Manhattan was hit the hardest of the four boroughs. Its sales activity was halved and the median sale price dropped 22% Y-o-Y from $1.27 million to $990,000.
That significant drop was brought on by two major factors: a change in the ratio of property types sold and sale prices sliding under the influence of the new economic and public health crisis. While condo units represented half of all sales in Q2 2019, that share dropped to 44% in Q2 2020. Moreover, the median sale price of condo units traded in Q2 contracted 7% Y-o-Y from $1.745 million in 2019 to $1.625 million in 2020.
At the same time, the number of co-ops traded dropped at a less dramatic rate and as a result, co-ops made up a larger share of Manhattan residential sales: 55% compared to the year-ago 49%. The median sale price of co-ops contracted at a sharper rate than condos, dropping 10% Y-o-Y from $830,000 in Q2 2019 to $750,000 in Q2 2020.
Brooklyn led in terms of sales activity, with the number of transactions recorded here in Q2 dropping only 32%, while its median sale price slid 2% to $702,000. Although sales activity decreased across all asset types — 29% Y-o-Y for co-ops, 30% for condos and 41% for single-family homes — the median sale price presented conflicting trends for different property types. As a result, Brooklyn’s Q2 2020 residential market presented a fractured image.
Condo and co-op sales took up a larger share of Brooklyn’s residential sales in Q2 2020 compared to Q2 2019, to the detriment of single-family home sales. Specifically, houses represented 22% of all second quarter sales in 2020 as opposed to 25% in 2019, while co-op units represented 28% compared to the year-ago 27% and condo unit sales increased from 48% to 50% of all sales.
Although the median sale price of single-family homes increased 7% Y-o-Y to $773,000 and the median of co-ops gained 9% Y-o-Y to reach $462,000, the drop in the median sale price of Brooklyn condos paired with this property type’s increased share in total sales, deflated the entire boroughs Q2 median this year. Specifically, Brooklyn condos registers a 4% Y-o-Y drop, going from last year’s $863,000 to $825,000 in Q2 2020.
Bronx Single-Family Sales Surge, While Queens Condos Heat Up Borough Pricing
The Bronx and Queens showed similar trends both in terms of pricing and sales activity evolution across all residential property types. Queens faired nearly best in terms of price growth, with its median rising 12.3% Y-o-Y from $463,000 to $520,000, while transactional activity shrank 42% Y-o-Y. Bronx prices actually rose at a slightly sharper rate of 12.5% Y-o-Y, but sales activity plunged 46% here.
Price growth in the Bronx was fueled by the significantly increased share of single-family home sales. While condos made up 23% of all second quarter sales in 2019 and single-family homes 34%, in 2020, condo sales dropped to representing 18% of the borough’s residential sales, while single-family homes made up 40%.
With the median sale price of single-family homes — $525,000 in Q2 2020 — significantly higher than that of condos — $225,000 in Q2 2020 — the Bronx’s overall median sale price grew from the year-ago $289,000 to $325,000 in Q2 of this year.
Queens, a borough dominated by single-family homes, saw sales activity drop at the sharpest rate for this property type, while condos outperformed every other residential property type both in terms of pricing and number of sales.
To be precise, Queens condo sales declined a mere 4% Y-o-Y, while their median sale price rose 13% Y-o-Y to reach $644,000 in Q2 2020. Additionally, condos also made up a larger share of all sales in 2020, representing 22% of all Q2 transactions this year, as opposed to 13% in 2019.
However, as condos still made up a relatively small percentage of all Queens sales, the borough’s second quarter sales activity dropped 42% Y-o-Y, fueled by the 47% decline in co-op sales and 48% decrease in single-family home sales. As a result, co-ops represented 37% of all Q2 sales in Queens and single-family 41%, down from last year’s 40% and 47%, respectively.
While sales activity decreased across the board, the borough’s 12.3% price increase was sustained by a 7% Y-o-Y increase in the median sale price of both co-ops — $320,000 in Q2 2020 — and single-family homes — $644,000 — and boosted by the 13% Y-o-Y hike for condos.
Kingsbridge Median Surges 147% Y-o-Y, Gowanus Sales Activity Heats Up 230%
At the neighborhood level, the Bronx’s Kingsbridge led in terms of pricing gains with its 147% Y-o-Y surge, going from $230,000 in Q2 2019 to $568,000 in Q2 2020. That was influenced by the change in sold property types. While the seven sales recorded in Q1 2019 were all co-ops, Q2 saw six sales, three of which were single-family homes.
Kingsbridge’s pricing surge was followed by Williamsbridge’s 100% Y-o-Y boom, which brought the Bronx neighborhood’s median sale price to $478,000. That jump was the result of an increase in the number of single family homes sold. While single-family homes made up half of Williamsbridge sales in Q2 2019 and featured a median sale price of $462,000, in Q2 2020, single-family homes represented 67% of the neighborhood’s sales at a noticeably higher $512,000 median sale price.
At the other end of the spectrum stood Prospect Park South, which experienced the sharpest drop at -54% Y-o-Y, going from a median sale price of $1.23 million a year ago to $568,000 in Q2 2020. That change was brought on by a change in the mix of property types sold and their respective lower price points.
While in Q2 2019 Prospect Park South’s residential sales were 57% co-op units and 43% single-family homes, this year single-family represented 17% of sales, co-ops 33% and condos 50%. That change was significant, as Q2’s condo sales had a median of $560,000.
Furthermore, the median sale price of Hunter’s Point co-ops decreased 23% Y-o-Y from $778,000 to $592,000. Additionally, while the three single-family homes sold in Q2 2019 had a median of $2.215 million, only two homes sold in Q2 2020, averaging $959,000.
In terms of sales activity, Brooklyn’s Gowanus witnessed the sharpest growth rate at a whopping 230% Y-o-Y. However, it must be noted that, in terms of actual transactions, that figure represents an increase from 10 deals registered in Q2 2019 to 33 transactions registered in Q2 2020. That surge was fueled by sales at new developments in the neighborhood, such as Luna at 229 9th Street, which originated 12 condo sales in Q2 2020 and none in Q2 2019.
Fellow Brooklyn neighborhood Greenwood Heights and Queens’ Hunters Point experienced the next sharpest gains in transactional activity, both recording 123% more sales than in Q2 2019. All in all, only 15 of the 157 NYC neighborhoods included in this report registered year-over-year increases in transactional activity.
Brooklyn’s Greenpoint stood on the opposite end of the spectrum with an 83% Y-o-Y drop — the sharpest rate of decrease in sales activity among all neighborhoods with at least five sales. Specifically, only 14 deals closed in Greenpoint in Q2 2020, as opposed to the 80 that were registered here in the same time frame last year, fueled by 48 luxury condo sales at then-new mixed-use development The Greenpoint.
As a result, the neighborhood’s median sale price also contracted, dropping 22% Y-o-Y from $1.36 million in Q2 2019 to to $1.06 million in Q2 2020.
Brooklyn Overtakes Manhattan for First Time, Lands More Neighborhoods in Top 50 Priciest
Among the neighborhoods omitted from our analysis due to insufficient sales activity were high-profile names like Hudson Yards, Malba and the Columbia Street Waterfront District, which ranked as the #1, #7 and #9 most expensive NYC neighborhoods in Q1 2020. As a result, TriBeCa reclaimed the title of #1 most expensive neighborhood in NYC, despite a 14% Y-o-Y price drop,which brought its median sale price to $3.73 million. At the same time, sales activity plummeted 52% Y-o-Y.
The city’s #2 most expensive neighborhood was Little Italy at $2.75 million. Its median sale price registered a mild 3% Y-o-Y uptick, paired with a 4% gain Q-o-Q. But its sales activity dropped 22% Y-o-Y, closing only seven deals in Q2 2020.
Similarly, SoHo’s $2.425 million median sale price earned it the title of NYC’s #3 most expensive neighborhood, despite its 8% median sale price contraction. However, its drop in transactional activity was more dramatic — down 67% — closing only 15 sales compared to 46 registered in Q2 2019.
Overall, Manhattan supplied six of the city’s 10 most expensive neighborhoods and Brooklyn four. However, when looking at the 50 most expensive neighborhoods, Brooklyn had a heavier presence than Manhattan — a historic first. Of the 52 neighborhoods that featured the 50 highest median sale prices of Q2, Brooklyn supplied 23 entries versus Manhattan’s 21 neighborhoods and Queens was represented by eight.
Manhattan Snapshot: TriBeCa Retakes Top Spot, Inwood Features Lowest Borough Median at $405K
As is most often the case, Manhattan’s three most expensive neighborhoods were also NYC’s three priciest: TriBeCa, Little Italy and SoHo. But its competitively priced neighborhoods are often what incite the most interest here in what is, historically, the city’s priciest borough.
With a median sale price of $405,000, Inwood was Manhattan’s #1 most affordable neighborhood following a 5% Y-o-Y drop. However, Inwood’s sales activity was halved, as was Tudor City’s, Manhattan’s #2 most affordable area. The latter posted a median sale price of $455,000 following a 10% Y-o-Y hike, which was the only year-over-year pricing gain among Manhattan’s five lowest-priced neighborhoods.
Washington Heights, for example, underwent an 18% Y-o-Y price crunch that cemented its $468,000 median as the borough’s #3 lowest.
Brooklyn Snapshot: Sales Activity Drops Only 32% Y-o-Y, DUMBO Becomes #4 Priciest NYC Neighborhood
In Brooklyn, three of its priciest neighborhoods were among the city’s top 10 most expensive. Brooklyn’s median sale price leader, DUMBO, landed at #4 with a $2.075 million median. That came as a result of a noticeable 38% Y-o-Y increase spurred by the sale of three units at 100 Jay Street with a median of $2.45 million. At the same time, DUMBO’s sales activity was halved.
Carroll Gardens was right on DUMBO’s heels as Brooklyn’s #2 most expensive neighborhood and the city’s #5 priciest. Its median was on the rise, as well, gaining 42% Y-o-Y. However, sales activity in Carroll Gardens dropped at an even sharper rate than in DUMBO, coming in 65% below Q2 2019.
Hitting a median sale price of $1.46 million following a 38% Y-o-Y drop, Cobble Hill was Brooklyn’s #3 priciest neighborhood in Q2 20201 and #8 city-wide. This was after a somewhat artificially inflated median in Q2 2019, elevated by the 17 sales registered at The Cobble Hill House, which featured a median sale price of $2.32 million.
On the other end of the borough’s pricing spectrum stood Gerritsen Beach, Coney Island and Midwood, which logged the lowest median sale prices. In particular, Gerritsen Beach was Brooklyn’s #1 most affordable neighborhood at $402,000, following a 7% Y-o-Y slide. Sales activity here dropped a mere 5% Y-o-Y, while Coney Island dropped 39% Y-o-Y. However, Coney Island’s median gained 6% to become Brooklyn’s #2 lowest median.
Meanwhile, Midwood’s 32% Y-o-Y drop pulled its median sale price down from last year’s $650,000 to $441,000 in Q2 2020, and transactional activity was slashed by 43% Y-o-Y.
All in all, the borough’s median sale price dipped 2% Y-o-Y, closing Q2 at $702,000. Notably, Brooklyn’s sales activity dropped only 32%, representing the lowest depression in transactional activity among the four boroughs.
Queens Snapshot: 34% Y-o-Y Drop Makes Briarwood Borough’s Lowest-Priced Neighborhood
In Queens, eight neighborhoods were among the city’s 50 most expensive. Nonetheless, the borough navigated a tumultuous second quarter with its sales activity dropping 42% Y-o-Y. It registered only 1,365 sales, as opposed to 2,340 in Q2 2019. Queens’ median sale price, however, rose 12.3% Y-o-Y, reaching $520,000 in Q2 2020.
Fresh Meadows was its #1 most expensive neighborhood at a median sale price of $930,000, following a 9% Y-o-Y uptick. That gain made Fresh Meadows the #27 most expensive neighborhood in NYC. Similarly, Queensboro Hill was Queens’ #2 priciest neighborhood with an $893,000 median sale price. That number tied it with Manhattan’s Gramercy Park to secure the city’s #32 priciest neighborhood.
While Queensboro Hill’s sales activity plummeted 60% Y-o-Y, Hunters Point saw sales surge 123%. The borough’s #3 priciest neighborhood at $890,000, Hunters Point tied Brooklyn’s Greenwood Heights for the NYC neighborhood with the second-highest gain in transactional activity.
Queens’ #1 lowest-priced neighborhood was Briarwood at $213,000, following a 34% Y-o-Y reduction in its median sale price. Both here and in the borough’s #2 most affordable neighborhood of Corona, sales activity was halved.
Likewise, Corona’s median was also on the downswing, dropping 32% Y-o-Y to $260,000. In the meantime, Lindenwood — Queens’ #3 best-priced neighborhood — bucked the trend with a 7% Y-o-Y increase to reach $270,000 in Q2.
Bronx Snapshot: Up 13% Y-o-Y, Spencer Estates Becomes Most Expensive Neighborhood in the Bronx
As usual, the Bronx didn’t manage to make its way among the city’s 50 priciest neighborhoods. However, it did register the sharpest pricing gain among the four boroughs, climbing 12.5% to a median sale price of $325,000, while sales activity fell 46% Y-o-Y. Its #1 most expensive neighborhood was Spencer Estates, which logged a $619,000 median after a 26% Y-o-Y price expansion. As such, it ranked as the #67 priciest NYC neighborhood.
NYC’s #74 priciest neighborhood and the Bronx’s #2 highest, Morris Park just made the cut with five sales at a $585,000 median sale price. And, with an 8% Y-o-Y pricing gain, Pelham Gardens was the #3 priciest Bronx neighborhood at $572,500, while its sales activity dipped 8%.
Tied at a median sale price of $162,500, High Bridge and Fordham became the #1 lowest-priced neighborhoods in the Bronx. Specifically, High Bridge’s median ticked up 3% Y-o-Y with transactional activity unchanged, while Fordham’s sales were halved, and its median dropped 34% Y-o-Y.
Meanwhile, following a 16% Y-o-Y appreciation, Kingsbridge Heights became the #2 most affordable Bronx neighborhood at $185,000, while Parkchester’s 8% Y-o-Y bump gave it the #3 lowest median sale price in the Bronx at $188,750.
Explore the interactive table below for our snapshot of New York City’s neighborhoods in Q2 2020:
| Borough | Neighborhood | Median Sale Price Q2 2020 | Y-o-Y Change | Number of Sales Q2 2020 | Y-o-Y Change | |
|---|---|---|---|---|---|---|
| 1 | Manhattan | TriBeCa | $3,731,500 | -14% | 48 | -52% |
| 2 | Manhattan | Little Italy | $2,750,000 | 3% | 7 | -22% |
| 3 | Manhattan | SoHo | $2,425,000 | -8% | 15 | -67% |
| 4 | Brooklyn | DUMBO | $2,075,000 | 38% | 6 | -50% |
| 5 | Brooklyn | Carroll Gardens | $2,062,550 | 42% | 8 | -65% |
| 6 | Manhattan | Hudson Square | $2,025,000 | -18% | 18 | -65% |
| 7 | Manhattan | Flatiron District | $1,695,000 | -22% | 33 | -70% |
| 8 | Brooklyn | Cobble Hill | $1,464,000 | -38% | 8 | -72% |
| 9 | Manhattan | Upper West Side | $1,412,000 | 9% | 333 | -38% |
| 10 | Brooklyn | Prospect Heights | $1,253,872 | 16% | 54 | 0% |
| 11 | Manhattan | Greenwich Village | $1,252,643 | -26% | 69 | -53% |
| 12 | Manhattan | West Village | $1,250,000 | -12% | 53 | -26% |
| 13 | Manhattan | Chelsea | $1,245,000 | -1% | 68 | -42% |
| 14 | Brooklyn | Fort Greene | $1,225,000 | -3% | 9 | -65% |
| 15 | Brooklyn | Boerum Hill | $1,140,000 | -1% | 19 | -14% |
| 16 | Brooklyn | Manhattan Beach | $1,124,000 | 7% | 6 | 0% |
| 17 | Manhattan | Sutton Place | $1,117,500 | 21% | 30 | -52% |
| 18 | Manhattan | Lower East Side | $1,071,250 | -23% | 34 | -79% |
| 19 | Brooklyn | Greenpoint | $1,060,000 | -22% | 14 | -83% |
| 20 | Manhattan | Theatre District - Times Square | $1,045,000 | -32% | 28 | -46% |
| 21 | Manhattan | Central Midtown | $1,024,883 | -28% | 33 | -48% |
| 22 | Manhattan | Upper East Side | $997,000 | -23% | 312 | -49% |
| 23 | Brooklyn | Gowanus | $992,794 | -13% | 33 | 230% |
| 24 | Brooklyn | Brooklyn Heights | $985,000 | 0% | 39 | -35% |
| 25 | Brooklyn | Park Slope | $972,500 | -5% | 80 | -18% |
| 26 | Brooklyn | Williamsburg | $958,669 | -4% | 72 | -56% |
| 27 | Queens | Fresh Meadows | $930,000 | 9% | 16 | -33% |
| 28 | Manhattan | Battery Park City | $923,750 | -13% | 13 | -54% |
| 29 | Brooklyn | Mill Basin | $920,000 | - | 5 | - |
| 30 | Brooklyn | Madison | $915,000 | 38% | 19 | 6% |
| 31 | Manhattan | East Village | $895,000 | -21% | 33 | -55% |
| 32 | Queens | Queensboro Hill | $892,500 | 1% | 6 | -60% |
| Manhattan | Gramercy Park | $892,500 | -46% | 40 | -67% | |
| 33 | Queens | Hunters Point | $890,000 | 0% | 87 | 123% |
| 34 | Queens | Auburndale | $880,000 | 19% | 15 | -46% |
| 35 | Queens | East Flushing | $865,000 | 4% | 8 | -50% |
| 36 | Brooklyn | Greenwood Heights | $855,356 | 8% | 29 | 123% |
| 37 | Brooklyn | Crown Heights | $847,500 | 21% | 18 | -42% |
| 38 | Brooklyn | Borough Park | $844,000 | -4% | 30 | -14% |
| 39 | Queens | East Elmhurst | $830,000 | 18% | 14 | -48% |
| 40 | Manhattan | Turtle Bay | $828,750 | -8% | 62 | -26% |
| 41 | Brooklyn | Bensonhurst | $827,500 | 19% | 14 | -30% |
| 42 | Queens | Little Neck | $820,000 | 94% | 11 | -27% |
| 43 | Brooklyn | Bergen Beach | $800,000 | 12% | 6 | -45% |
| Manhattan | Financial District | $800,000 | -27% | 45 | -42% | |
| 44 | Brooklyn | Downtown Brooklyn | $765,000 | -10% | 45 | 45% |
| 45 | Brooklyn | Bath Beach | $741,286 | 95% | 13 | -32% |
| 46 | Manhattan | Harlem | $732,500 | 25% | 66 | -43% |
| 47 | Manhattan | Murray Hill | $725,000 | -22% | 41 | -56% |
| 48 | Brooklyn | Marine Park | $719,500 | 18% | 22 | -15% |
| 49 | Queens | Middle Village | $715,000 | -1% | 23 | -28% |
| 50 | Brooklyn | Windsor Terrace | $695,000 | 21% | 11 | -15% |
| 51 | Manhattan | Clinton - Hell's Kitchen | $693,000 | -18% | 63 | -32% |
| 52 | Brooklyn | Brighton Beach | $692,500 | 28% | 16 | -52% |
| 53 | Queens | Rockwood Park | $690,000 | -18% | 11 | -15% |
| 54 | Brooklyn | Clinton Hill | $678,500 | -5% | 34 | -15% |
| 55 | Queens | Bayside | $675,000 | 25% | 72 | -43% |
| 56 | Queens | Old Howard Beach | $652,500 | 11% | 6 | 20% |
| 57 | Queens | Old Astoria | $647,500 | 3% | 14 | 8% |
| 58 | Brooklyn | Bedford-Stuyvesant | $641,498 | -10% | 52 | -45% |
| 59 | Queens | Jamaica Estates | $632,500 | -16% | 20 | -20% |
| 60 | Brooklyn | Prospect - Lefferts Gardens | $630,000 | -19% | 11 | 0% |
| 61 | Queens | Maspeth | $628,000 | 0% | 13 | -38% |
| 62 | Brooklyn | Old Mill Basin | $625,000 | 23% | 9 | -47% |
| 63 | Queens | South Astoria | $625,000 | 18% | 13 | 8% |
| 64 | Manhattan | Kips Bay | $622,500 | -11% | 28 | -39% |
| 65 | Brooklyn | Dyker Heights | $622,226 | -25% | 12 | -48% |
| 66 | Queens | Floral Park | $620,000 | 5% | 5 | -50% |
| 67 | Bronx | Spencer Estates - Country Club | $618,500 | 26% | 6 | -33% |
| 68 | Queens | College Point | $611,944 | 0% | 20 | -31% |
| 69 | Queens | Glendale | $603,500 | -14% | 6 | -68% |
| 70 | Queens | Rochdale | $598,000 | 25% | 6 | -73% |
| 71 | Queens | Richmond Hill | $594,525 | 0% | 10 | -58% |
| 72 | Queens | Douglaston | $592,000 | -3% | 24 | -27% |
| 73 | Manhattan | East Harlem | $586,143 | -24% | 18 | -57% |
| 74 | Bronx | Morris Park | $585,000 | 2% | 5 | -29% |
| 75 | Brooklyn | East Flatbush | $580,000 | 10% | 21 | -54% |
| 76 | Bronx | Pelham Gardens | $572,500 | 8% | 12 | -8% |
| 77 | Brooklyn | Gravesend | $570,000 | 5% | 29 | -61% |
| 78 | Bronx | Kingsbridge | $567,661 | 147% | 6 | -14% |
| 79 | Brooklyn | Prospect Park South | $567,610 | -54% | 12 | 71% |
| 80 | Queens | Woodhaven | $560,000 | 3% | 13 | -61% |
| 81 | Queens | Ozone Park | $560,000 | 2% | 17 | -41% |
| 82 | Queens | Hollis | $555,000 | 0% | 5 | -81% |
| 83 | Bronx | Pelham Bay | $552,500 | 6% | 10 | -29% |
| 84 | Brooklyn | Ditmas Park | $550,000 | -46% | 17 | 89% |
| 85 | Brooklyn | Canarsie | $546,950 | 17% | 26 | -10% |
| 86 | Queens | Saint Albans | $540,000 | 11% | 39 | -43% |
| 87 | Queens | Cambria Heights | $535,000 | 4% | 24 | -20% |
| 88 | Queens | Queens Village | $535,000 | 3% | 27 | -56% |
| 89 | Queens | Downtown Flushing | $535,000 | 35% | 83 | 1% |
| 90 | Queens | Bellerose | $532,500 | 0% | 26 | -40% |
| 91 | Brooklyn | Flatbush | $529,895 | -10% | 16 | -63% |
| 92 | Brooklyn | Bushwick | $528,750 | -21% | 26 | -4% |
| 93 | Brooklyn | Bay Ridge | $527,500 | 22% | 64 | -23% |
| 94 | Brooklyn | Wingate | $525,000 | - | 5 | - |
| 95 | Queens | Rosedale | $525,000 | 11% | 16 | -50% |
| 96 | Bronx | City Island | $520,000 | 16% | 11 | -35% |
| 97 | Queens | Jamaica | $520,000 | 27% | 46 | -57% |
| 98 | Brooklyn | Homecrest | $517,000 | -35% | 8 | -53% |
| 99 | Queens | Breezy Point | $515,000 | 26% | 13 | -19% |
| 100 | Queens | Far Rockaway | $515,000 | 12% | 16 | -53% |
| 101 | Queens | South Ozone Park | $515,000 | -2% | 33 | -54% |
| 102 | Queens | Ridgewood | $510,000 | -10% | 5 | -38% |
| 103 | Brooklyn | Georgetown | $505,000 | 12% | 6 | 20% |
| 104 | Queens | Whitestone | $505,000 | 30% | 51 | -31% |
| 105 | Brooklyn | Kensington | $495,000 | -26% | 26 | -64% |
| 106 | Brooklyn | East New York | $485,000 | 9% | 31 | -38% |
| 107 | Bronx | Laconia | $480,000 | 17% | 5 | -17% |
| 108 | Queens | LIC | $480,000 | -32% | 6 | -60% |
| 109 | Brooklyn | Sunset Park | $480,000 | 2% | 13 | -46% |
| 110 | Bronx | Throggs Neck | $479,300 | 15% | 20 | -43% |
| 111 | Queens | Springfield Gardens | $479,000 | 1% | 12 | -54% |
| 112 | Bronx | Williamsbridge | $477,500 | 100% | 12 | 20% |
| 113 | Queens | Elmhurst | $474,500 | 5% | 26 | -37% |
| 114 | Brooklyn | Sheepshead Bay | $470,000 | 43% | 37 | -41% |
| 115 | Manhattan | Washington Heights | $467,500 | -18% | 40 | -47% |
| 116 | Brooklyn | Flatlands | $465,000 | -8% | 10 | -67% |
| 117 | Manhattan | Tudor City | $455,000 | 10% | 15 | -48% |
| 118 | Queens | Astoria Heights / Upper Ditmars | $452,500 | -11% | 10 | 11% |
| 119 | Brooklyn | Midwood | $440,500 | -32% | 54 | -43% |
| 120 | Brooklyn | Coney Island | $440,000 | 6% | 19 | -39% |
| 121 | Queens | Woodside | $437,700 | 5% | 19 | -47% |
| 122 | Queens | Sunnyside Gardens | $425,000 | - | 8 | - |
| 123 | Bronx | Clason Point | $425,000 | -7% | 9 | -50% |
| 124 | Queens | Laurelton | $410,000 | -12% | 17 | -59% |
| 125 | Manhattan | Inwood | $405,000 | -5% | 7 | -50% |
| 126 | Brooklyn | Gerritsen Beach | $401,750 | -7% | 18 | -5% |
| 127 | Queens | Forest Hills | $391,000 | -2% | 102 | -40% |
| 128 | Queens | Sunnyside | $385,000 | -5% | 13 | -55% |
| 129 | Queens | Jackson Heights | $375,000 | -6% | 44 | -54% |
| 130 | Queens | Rego Park | $362,500 | 17% | 36 | -56% |
| 131 | Queens | Murray Hill - Queens | $362,000 | 3% | 29 | -52% |
| 132 | Queens | Kew Gardens Hills | $353,500 | 17% | 28 | -64% |
| 133 | Bronx | North Riverdale | $350,000 | 20% | 11 | -63% |
| 134 | Bronx | Woodstock | $340,000 | 18% | 6 | -25% |
| 135 | Bronx | Spuyten Duyvil | $340,000 | 25% | 9 | -63% |
| 136 | Bronx | Wakefield | $326,500 | -19% | 10 | -38% |
| 137 | Queens | Broad Channel | $325,000 | -24% | 9 | 29% |
| 138 | Queens | Glen Oaks | $325,000 | -3% | 31 | -38% |
| 139 | Bronx | Riverdale | $324,784 | 4% | 24 | -41% |
| 140 | Queens | Oakland Gardens | $320,000 | 0% | 14 | -75% |
| 141 | Bronx | Fieldston | $304,750 | 2% | 12 | -20% |
| 142 | Queens | Rockaway Park | $302,500 | 29% | 5 | -44% |
| 143 | Queens | Kew Gardens | $287,030 | -4% | 36 | -37% |
| 144 | Queens | Lindenwood | $270,000 | 7% | 15 | -67% |
| 145 | Queens | Corona | $260,000 | -32% | 15 | -50% |
| 146 | Bronx | Concourse Village | $253,000 | -37% | 9 | -47% |
| 147 | Bronx | Eastchester | $250,000 | - | 7 | - |
| 148 | Bronx | Allerton | $237,500 | 40% | 11 | -15% |
| 149 | Bronx | Bedford Park | $220,000 | 22% | 7 | -13% |
| 150 | Queens | Briarwood | $212,500 | -34% | 20 | -49% |
| 151 | Bronx | Bronxdale | $199,000 | 37% | 5 | -69% |
| 152 | Bronx | Parkchester | $188,750 | 8% | 26 | -66% |
| 153 | Bronx | Kingsbridge Heights - Jerome Park | $185,000 | 16% | 5 | -17% |
| 154 | Bronx | High Bridge | $162,500 | 3% | 6 | 0% |
| 155 | Bronx | Fordham | $162,500 | -34% | 9 | -53% |
Methodology
Median sale prices were calculated based on residential property sales closed between April 1 and June 30, 2019, and April 1 and June 30, 2020. Residential asset types included were single-family homes, condos and co-ops. Package deals were excluded.
Median sale prices were calculated only for neighborhoods that recorded at least five sales in Q2 2020.
The boundaries of some Manhattan neighborhoods vary, as data on several small neighborhoods is included in stats for larger areas. For example, Central Park South is included in Theatre District – Times Square area, NoLita is included in Little Italy, and NoHo is included in Greenwich Village, while Carnegie Hill, Lenox Hill and Yorkville are all included in the Upper East Side.
Want to stay on top of the real estate market?
Access comprehensive property data and ownership information with intuitive research tools.
POSTED IN: Market Studies, New York Real Estate

Eliza Theiss is a senior writer reporting real estate trends in the US. Her work has been cited by CBS News, Curbed, The Los Angeles Times, and Forbes among others. With an academic background in journalism, Eliza has been covering real estate since 2012. Before joining PropertyShark, Eliza was an associate editor at Multi-Housing News and Commercial Property Executive. She has also contributed extensively to CommercialEdge. Reach her at [email protected]
Recent Reports

2026 Q2 Foreclosure Report: Bronx Caseload Hits 7-Year High, Brooklyn & Manhattan Slow to 4-Year Low
Manhattan yet again slowed to become the city’s least active foreclosure market, Brooklyn’s caseload dropped so low it barely edged out Staten Island, while the Bronx heated up enough to surpass all boroughs except Queens.

NYC Resale Gains & Losses: Every Borough Made Money in 2025, Except Manhattan
In 2025, NYC home-sellers mostly made money. But, in Manhattan, resales came with losses — and it was apartments and recent buyers that absorbed them.

World Cup or Your Mortgage/Rent? Ticket Prices Rival Host City Housing Costs
World Cup ticket prices rival monthly housing expenses in the 11 U.S. host cities, with even the cheapest seats covering weeks or even months of rent or mortgage payments.