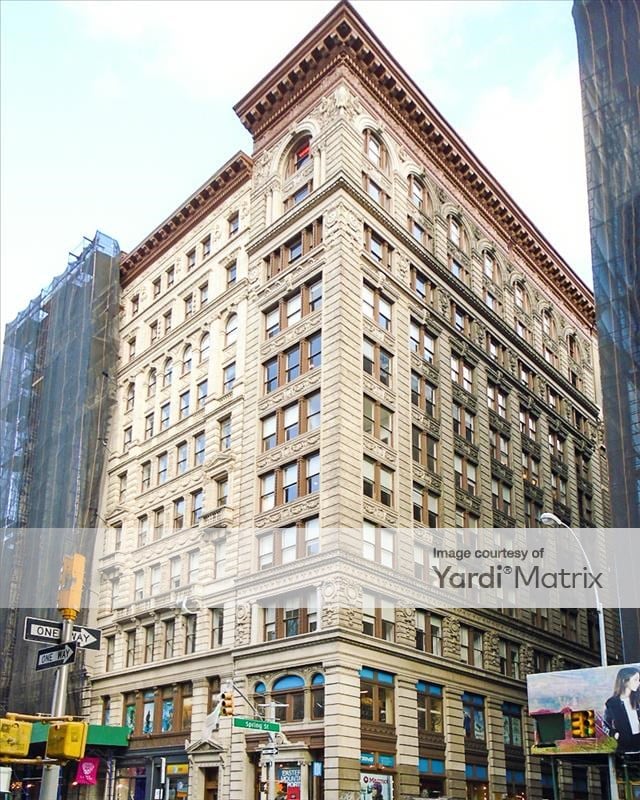
530 Broadway, New York, NY 10012
Property Overview
|
||
|
||
|
||
|
||
|
Ownership Information
Owner name, mailing address and phone numbers for 530 Broadway. For LLC-owned properties, see who is behind the LLC, manually researched by our team. We are calling NYC property owners to verify that phone numbers reach the right person. Find out more about real owners and phone numbers.
See Owner
|
||
|
||
|
||
|
See building contacts
Sales & Property History for 530 Broadway
Sales history, mortgages, liens, and pre-foreclosures for 530 Broadway. The complete property history is available in a single place, including buyer and seller information, detailed mortgage & lien records, distressed property records.
Title Documents for 530 Broadway
Records go back to 1966 and include the complete history of deeds, mortgages, assignments of leases and rents, and more! Plus, document images are one-click away.
View title documents
R: Recorded date
D: Document date
Property Taxes for 530 Broadway
Access detailed property tax data for 530 Broadway. Tax information included: property tax, market value and assessed value, exemptions, abatements, and assessment history.
|
||
|
||
|
Assessment History for 530 Broadway
Here's the assessment & property tax history for 530 Broadway, including the evolution of the total tax rate and corresponding property tax.
Year | Building class | Market value | Assessed value | Taxable | Tax rate% | Base tax | Property tax |
---|---|---|---|---|---|---|---|
2020/21 | O6 | $129,475,000 | $58,263,750 | $52,330,410 | 10.694% | $5,596,214 | $5,596,214 |
2019/20 | O6 | $125,324,000 | $56,395,800 | $46,879,285 | 10.537% | $4,939,670 | $4,939,670 |
2018/19 | O6 | $66,428,000 | $29,892,600 | $21,367,170 | 10.514% | $2,246,544 | $2,246,544 |
2017/18 | O6 | $59,644,000 | $26,839,800 | $18,001,620 | 10.514% | $1,892,690 | $1,892,690 |
2016/17 | O6 | $46,164,000 | $20,773,800 | $14,854,860 | 10.574% | $1,570,753 | $1,570,753 |
2015/16 | O9 | $33,578,000 | $15,110,100 | $12,681,000 | 10.656% | $1,351,287 | $1,351,287 |
2014/15 | O9 | $31,599,000 | $14,219,550 | $11,413,980 | 10.684% | $1,219,470 | $1,219,470 |
2013/14 | O9 | $29,033,000 | $13,064,850 | $10,217,070 | 10.323% | $1,054,708 | $1,054,708 |
2012/13 | O9 | $24,680,000 | $11,106,000 | $9,215,100 | 10.228% | $942,520 | $942,520 |
2011/12 | O9 | $22,010,000 | $9,904,500 | $8,604,900 | 10.152% | $873,569 | $873,569 |
2010/11 | O9 | $19,500,000 | $8,775,000 | $8,032,000 | 10.312% | $828,260 | $828,260 |
2009/10 | O9 | $18,300,000 | $8,235,000 | $7,685,000 | 10.426% | $801,238 | $801,238 |
2008/09 | O9 | $17,900,000 | $8,055,000 | $7,100,000 | 10.241% | $727,111 | $727,111 |
2007/08 | O9 | $17,900,000 | $8,055,000 | $6,383,600 | 10.059% | $642,126 | $642,126 |
2006/07 | O9 | $16,200,000 | $7,290,000 | $5,708,700 | 10.997% | $627,786 | $627,786 |
2005/06 | O9 | $16,200,000 | $7,290,000 | $5,105,700 | 11.306% | $577,250 | $577,250 |
2004/05 | O9 | $11,800,000 | $5,310,000 | $4,277,700 | 11.558% | $494,417 | $494,417 |
Permits for 530 Broadway
Assess the condition of a property with access to the history of permits filed, including new construction or demolition permits, plus any work pertaining to plumbing, heating, sprinkler systems, and more! Data goes back to 1990.
Check permits
SoHo residential market stats
View a detailed real estate market overview of SoHo and check out current trends, home values, types of properties sold and transaction volume.
View the median home sale price in Soho and compare it to other neighborhoods in Manhattan.
Neighbors
Here are the neighbors for 530 Broadway.
Address | Square feet | Purchase date | Purchase price |
---|---|---|---|
250 Lafayette St, New York | 16,766 | 1/3/1995 | |
246 Lafayette St, New York | 9/26/2007 | $4,850,000 | |
242 Lafayette St, New York | 14,961 | 12/30/1977 | |
240 Lafayette St, New York | 5,545 | 9/28/2006 | |
238 Lafayette St, New York | 728 | 5/9/1984 | |
63 Spring St, New York | 5,140 | 3/20/2017 | $10,500,000 |
65 Spring St, New York | 7,690 | 11/1/2016 | $14,500,000 |
71-73 Spring St, New York | 56,340 | 10/21/1992 | |
75 Spring St, New York | 54,800 | 6/24/2003 | |
70 Prince St, New York | 3,285 | ||
540 Broadway, New York | 25,050 | 1/6/1983 | |
546 Broadway, New York | 96,000 | 2/21/2007 | |
550 Broadway, New York | 16,125 | 11/17/1967 | |
552-556 Broadway, New York | 67,440 | 11/17/1967 | |
558 Broadway, New York | 22,916 | 5/1/2013 | |
560 Broadway, New York | 122,454 | 5/22/2007 | |
83 Spring St, New York | 13,078 | ||
76 Crosby St, New York | 45,280 | ||
92 Prince St, New York | 6,188 | 4/2/2009 | $2,500,000 |
Alternate Addresses
You will find all alternate addresses for the property in this section.
• 530-534 Broadway, New York, NY 10012 | • 536-538 Broadway, New York, NY 10012 | • 85-87 Spring St, New York, NY 10012 |
Property Description
530 Broadway, New York, NY 10012 is a Office with Commercial 7-19 Stories (O6) property. This property is located in zip code 10012 and was built in 1900. 530 Broadway, New York, NY 10012 has a total lot square footage of 15,299. 530 Broadway, New York, NY 10012 was last sold on 3/3/2020. The tax assessors market value for this property is $129,475,000 and is projected to be - next year. Total property tax paid is $5,596,214. 530 Broadway, New York, NY 10012 is assigned to school district 2.