
RELEASED ON November 21, 2017
Boston’s Top 5 Fastest-Rising Neighborhoods in 2017
Roxana Poenar | 4 minute read
The Boston housing market has been on a fast track in the past year and, according to Forbes, it’ll continue to thrive as the city further develops into an international hub. In a quest to better understand how the market has evolved over the past few years, we started digging deeper to see to what extent this growth has impacted the city of Boston. To get a better picture of how market prices have changed in the last five years, we analyzed all residential transactions to close in Boston during the first three quarters of 2012 and compared them to sales closed in the first three quarters of 2017. This allowed us to pinpoint which of the city’s neighborhoods had the most accelerated growth in prices during this interval. Read on to find out which were the five Boston neighborhoods to see the highest increases in median home prices compared to 2012: #1. Bay Village Median sale price: $1,528,000 Change in median sale price compared to 2012: $533,500 Number of recorded transactions: 97 Ranking first on our list is Bay Village, the smallest recognized neighborhood in Boston. The median sale price in this neighborhood appreciated $533,500 compared to 2012 (a 54%…
The Boston housing market has been on a fast track in the past year and, according to Forbes, it’ll continue to thrive as the city further develops into an international hub. In a quest to better understand how the market has evolved over the past few years, we started digging deeper to see to what extent this growth has impacted the city of Boston.
To get a better picture of how market prices have changed in the last five years, we analyzed all residential transactions to close in Boston during the first three quarters of 2012 and compared them to sales closed in the first three quarters of 2017. This allowed us to pinpoint which of the city’s neighborhoods had the most accelerated growth in prices during this interval.
Read on to find out which were the five Boston neighborhoods to see the highest increases in median home prices compared to 2012:
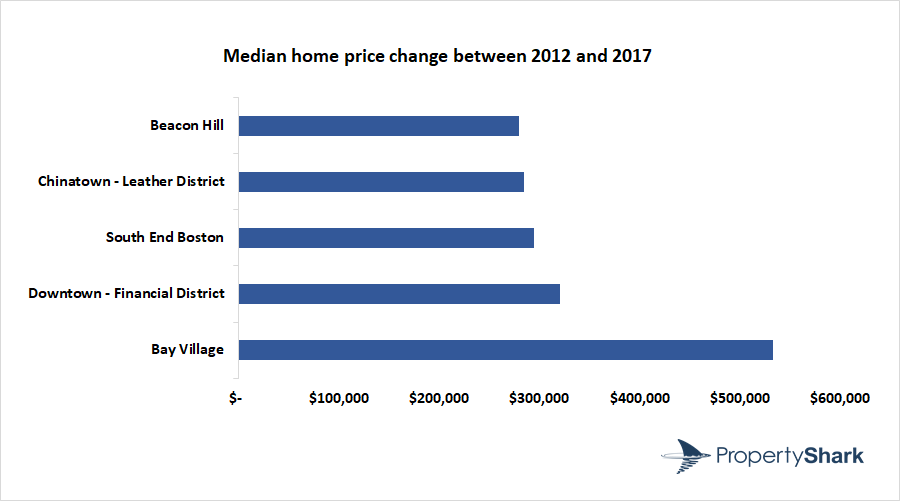
#1. Bay Village
Median sale price: $1,528,000
Change in median sale price compared to 2012: $533,500
Number of recorded transactions: 97
Ranking first on our list is Bay Village, the smallest recognized neighborhood in Boston. The median sale price in this neighborhood appreciated $533,500 compared to 2012 (a 54% growth), reaching a median sale price of $1,528,000 at the end of Q3 2017.
It’s not difficult to see why prices surged in the neighborhood. Just look at this swanky Bay Village condo at 1 Charles Street South. For an asking price of $1,499,000, you get a roomy two-bedroom, two-bathroom apartment with plenty of space for entertaining guests. The property comes with many other amenities, including 24/7 concierge and a residents’ Club Room.
#2. Downtown – Financial District
Median sale price: $1,111,000
Change in median sale price compared to 2012: $321,000
Number of recorded transactions: 97
The Downtown – Financial District neighborhood takes the second spot on our list, with a spike in median sale prices of $321,000 compared to 2012. At the close of 2017’s third quarter, properties here traded for a median sale price of $1,111,000—a 40% increase compared to five years ago.
Take for instance this cozy home located right on the Washington Street Corridor, at 3 Avery Street. The one-bedroom condo has an asking price just shy of $1 million and features over 1,200 square feet of space. The property has been meticulously renovated with floor-to-ceiling windows and high-end finishes, giving the space a casual vibe.
#3. South End Boston
Median Sale Price: $880,000
Change in median sale price compared to 2012: $294,500
Number of recorded transactions: 377
A thriving arts community, the cosmopolitan South End snatched the third spot on our list. The median sale price appreciated nearly $295,000 over the past five years, reaching $880,000 in Q3 2017.
Here’s a fitting example of what the South End Boston housing market looks like. Boasting an asking price of $810,000, this custom-detailed two-bedroom home at 455 Massachusetts Avenue is a real South End gem, and even comes with its own private deck.
#4. Chinatown – Leather District
Median Sale Price: $845,000
Change in median sale price compared to 2012: $285,000
Number of transactions: 29
Established in the early 1800s as a commercial and cultural core for Boston’s Chinese community, the Chinatown – Leather District lands the fourth spot on our list. The neighborhood saw its median home price appreciate $285,000 compared to 2012, resting at $845,000 at the close of September 2017.
Located right in the heart of Boston, this luxury condo at 501 3 Avery Street is the way to go for those who like to enjoy a lavish lifestyle. The home features an asking price of $879,000 and is part of the well-known Ritz Carlton Residences. The property also enjoys a prime location and plenty of amenities, including access to the Ritz Carlton Hotel services.
#5. Beacon Hill
Median sale price: $870,000
Change in median sale price compared to 2012: $280,000
Number of recorded transactions: 121
Landing at number five on our list, the quaint neighborhood of Beacon Hill boasted a median sale price of $870,000 in Q3 2017. Home to the Massachusetts State House, and many notable residents like Louisa May Alcott and Uma Thurman, the historical neighborhood saw its median sale price appreciate $280,000 over 2012.
Located at 39 Chestnut Street, this cozy two-bedroom home is an example of the kind of dwellings one can find in Beacon Hill. The property features roughly 1,000 square feet of space and has an asking price of $879,000.
East Boston, Roxbury median sale prices grew 100% compared to 2012
Looking at the absolute numbers, the neighborhoods listed above are truly the cream of the crop of Boston real estate. However, some of them boasted high prices to begin with, so it’s no surprise they made it to the top five. However, if we look at the market in terms of percentage gains, two other areas step into the limelight: East Boston and Roxbury.
Granted, median sale prices in these neighborhoods don’t come anywhere near the exorbitant price tags fetched by Downtown or South End properties, yet these two up-and-coming neighborhoods recorded the highest increases over the past five years. The median sale price for East Boston properties more than doubled compared to 2012, while in Roxbury, median sale prices increased 94% from 2012 to 2017.
A former shipbuilding center, East Boston is now one of the most diverse neighborhoods in town. The neighborhood was cited by Curbed Boston as one to watch, due to the increasing number of new developments that keep popping up in the area. The median sale price in East Boston reached $450,000 in 2017.
With a history of being mostly a farming neighborhood, Roxbury has started to reinvent itself and adapt to 21st century trends. The median home price in the area climbed to $437,500 in 2017, and the neighborhood isn’t showing signs of slowing down anytime soon.
Check out the table below to see how median sale prices changed compared to 2012, in all the neighborhoods we looked at:
| Neighborhood | Median Sale Price 2012 | Median Sale Price 2017 | Difference in Median Sale Price 2012/2017 |
|---|---|---|---|
| Bay Village | $994,500 | $1,528,000 | $533,500 |
| Downtown - Financial District | $790,000 | $1,111,000 | $321,000 |
| South End Boston | $585,500 | $880,000 | $294,500 |
| Chinatown - Leather District | $560,000 | $845,000 | $285,000 |
| Beacon Hill | $590,000 | $870,000 | $280,000 |
| Back Bay | $684,000 | $955,000 | $271,000 |
| Fenway - Kenmore | $340,000 | $575,000 | $235,000 |
| East Boston | $222,750 | $450,000 | $227,250 |
| South Boston | $390,250 | $615,000 | $224,750 |
| Roxbury | $225,000 | $437,500 | $212,500 |
| Dorchester | $243,000 | $438,000 | $195,000 |
| Roslindale | $289,500 | $477,000 | $187,500 |
| North End Boston | $571,000 | $757,000 | $186,000 |
| Jamaica Plain | $369,900 | $552,500 | $182,600 |
| Charlestown | $470,000 | $650,000 | $180,000 |
| Mission Hill | $350,000 | $525,000 | $175,000 |
| Allston - Brighton | $275,000 | $447,500 | $172,500 |
| West Roxbury | $351,000 | $515,000 | $164,000 |
| West End Boston | $380,000 | $530,000 | $150,000 |
| Mattapan | $219,000 | $345,000 | $126,000 |
| Hyde Park | $250,000 | $370,000 | $120,000 |
Methodology: To determine which are the fastest-developing neighborhoods in terms of home prices, we looked at all residential transactions closed between January 2012 and September 2012 and compared them with the figures from January 2017 to September 2017. We considered condos, co-ops, and single- and two-family homes. All package deals were excluded.
Want to stay on top of the real estate market?
Access comprehensive property data and ownership information with intuitive research tools.
POSTED IN: Boston Real Estate, Market Studies

With a taste for learning, Roxana joined PropertyShark in order to expand her knowledge of all things real estate. Passionate about reading and travelling, if she's not at her desk or engrossed in one of her books, then she's probably packing her backpack for a new adventure.
Recent Reports

World Cup or Your Mortgage/Rent? Ticket Prices Rival Host City Housing Costs
World Cup ticket prices rival monthly housing expenses in the 11 U.S. host cities, with even the cheapest seats covering weeks or even months of rent or mortgage payments.

Locked-In Owners, Mobile Renters: Homeowners Stay Put as Renters Move 3.7x More Across Largest U.S. Cities
Renters became the primary drivers of long-distance mobility across the largest U.S. cities, moving 3.7 times more than owners in 2024, as high mortgage rates and housing costs kept many homeowners in place.

$4.6M Hudson Yards Maintains Top Spot, Luxury Sales in Malba Set $2.5M Price Record for Queens
Despite prices declining, Hudson Yards remained the most expensive NYC neighborhood, but TriBeCa’s growth closed the gap to under $400,000, while Malba set a new historic price record for Queens at $2.5 million, securing the highest ranking ever for the borough at #5.