
RELEASED ON May 7, 2018
Was Buying an NYC Home a Good Investment During the Past Decade?
Robert Demeter | 5 minute read
Buying a home is on almost everyone’s bucket list, but as soon as you find the perfect place, the all-too-familiar question pops up: is this investment worth it? Ever since the 2008 market crash, homebuyers think twice before spending their hard-earned money and savings on a down payment. Banks have also become more cautious and do not lend so easily to clients without guarantees that the mortgage will be sustainable. At the height of the financial crisis, some people thought investing or buying a condo in NYC was actually a good idea, and as crazy as it sounds, most of them were right. Most homebuyers who acquired a piece of real estate back in 2008—especially in Brooklyn and Manhattan—managed to sell their assets for a profit in 2017. PropertyShark gathered data on all the condos and co-ops that were purchased in Manhattan, Brooklyn, Queens and the Bronx in 2008, and sold a decade later, in 2017. We calculated the median sale price of these properties to see how citywide prices grew and which of these four boroughs saw the biggest increase. Before diving into the story, here are some key takeaways: NYC median prices grew from $500,000 in 2008 to…
Buying a home is on almost everyone’s bucket list, but as soon as you find the perfect place, the all-too-familiar question pops up: is this investment worth it? Ever since the 2008 market crash, homebuyers think twice before spending their hard-earned money and savings on a down payment. Banks have also become more cautious and do not lend so easily to clients without guarantees that the mortgage will be sustainable.
At the height of the financial crisis, some people thought investing or buying a condo in NYC was actually a good idea, and as crazy as it sounds, most of them were right. Most homebuyers who acquired a piece of real estate back in 2008—especially in Brooklyn and Manhattan—managed to sell their assets for a profit in 2017.
PropertyShark gathered data on all the condos and co-ops that were purchased in Manhattan, Brooklyn, Queens and the Bronx in 2008, and sold a decade later, in 2017. We calculated the median sale price of these properties to see how citywide prices grew and which of these four boroughs saw the biggest increase.
Before diving into the story, here are some key takeaways:
- NYC median prices grew from $500,000 in 2008 to $677,000 in 2017
- Brooklyn prices recorded the biggest surge, rising 50% in 10 years
- Manhattan saw a 25% median price change from $850K to $1.1 million
- Around 230 homes were bought in Queens and sold for a 32% profit after a decade
- Even if you add inflation into the mix, decreases only occurred in the Bronx
Let’s Start with City-Level Home Sales
Ten years ago, uncertainty loomed around every investment, especially in real estate. In 2008, more than 1,000 residences were bought in New York City, which ended up being sold in 2017. Looking just at these sales, the median sale price across the four boroughs was $500,000 in 2008, which increased by more than $150,000 in 10 years to a median of $677,500.
When you add inflation into the mix, things look slightly different. The median sale price of the 1,000+ assets would’ve been around $586,000 10 years ago, which would translate to a mere $91,200 increase in prices. That’s still a decent profit, but far from what investing in the stock market, for example, would’ve gotten you.
Buying Dow Jones Stock Instead of Real Estate in ‘08
Investing in the stock market right after the financial crash wasn’t a popular thing to do either. However, for $500,000, you could’ve bought 56 shares of each company in the Dow Jones Industrial Index. If kept from 2008 until 2017, these would’ve ended up being worth almost $1.4 million, drawing in a profit significantly larger than you would’ve made by selling an apartment.
$500,000 investment from 2008 to 2017, with no in-between transactions:
Profit by investing in DJI stock: $900,000
Profit by buying and selling an NYC apartment: $91,200
Take a look at our interactive zip code heat map to see which areas saw the biggest increases in prices and read on for more borough-level information.
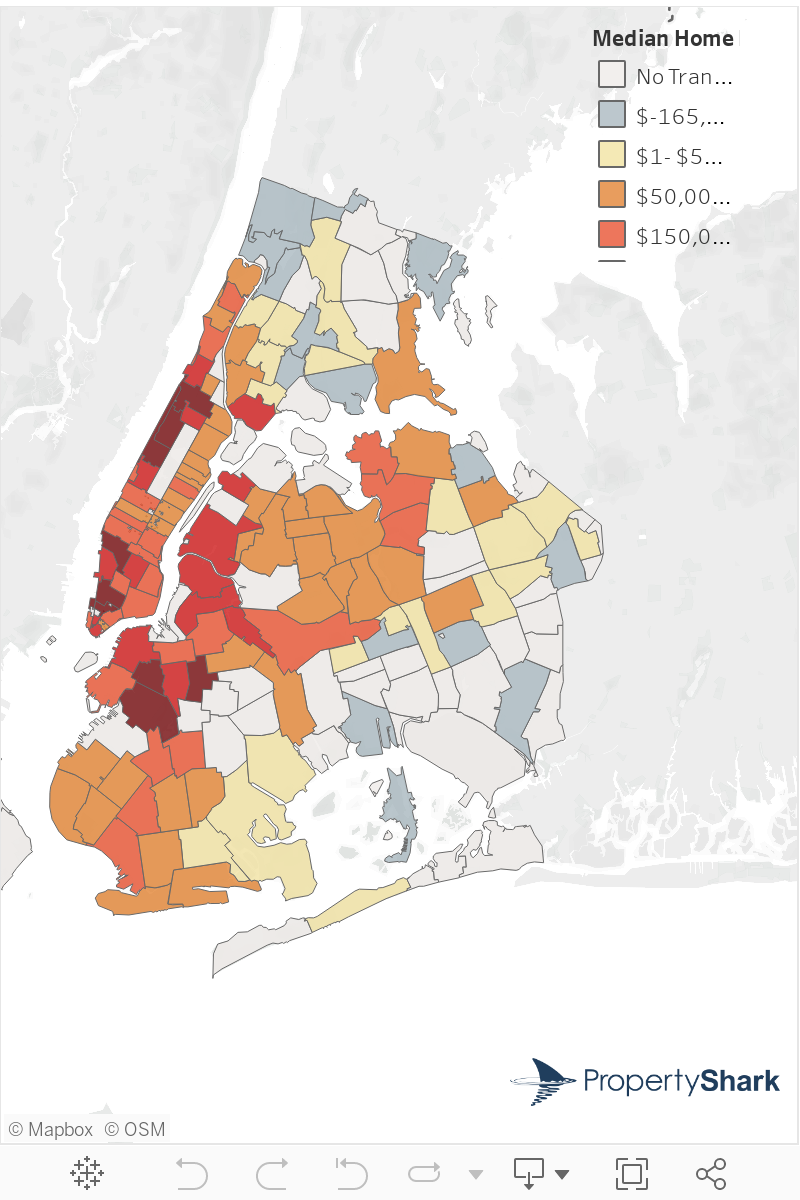
Just by looking at the map, it’s clear that prices in Brooklyn blew up in the last decade. Gentrification played a huge role in shaping and revitalizing some of the borough’s now high-end neighborhoods—for better or worse, depending on whom you ask. Priced out of Manhattan, homebuyers crossed the river and developers followed.
There were around 230 Brooklyn houses that were bought in in 2008 and sold in 2017, the 2008 median sale price being $440,000. Because of the borough’s ongoing growth and momentum, the same properties traded for a median of $635,000 in 2017: a 47% increase in 10 years and a $207,000 median price growth.
With inflation, the median price of the properties would’ve been $516,000, cutting the growth to almost half: $119,000.
Evidently, neighborhoods closest to Manhattan saw the biggest price increases, including Brooklyn Heights, Dumbo, Boerum Hill and Park Slope. The 11215 zip code registered the largest median change, of $425,000. Out of the 230 homes, the most expensive transaction in 2017 was a unit at 360 Furman St. in Brooklyn Heights, which fetched more than $5.6 million. Having bought it for $3.1 million back in 2008, the lucky seller made an 81% profit last year.
Manhattan Sees Median Sale Prices Go Past $1M
Manhattan is also lit up on the map, with two zip codes in Lower Manhattan and Upper West Side and an area in Harlem standing out. It’s no secret by now that no matter the cost of living, Manhattan will always remain the most sought-after area in New York City.
When looking at the roughly 500 transactions of 2008 which later sold in 2017, the borough saw a 25% increase in sale prices. The median sale price of the 500 properties was $850,000 in 2008 and $1.1 million in 2017. The 10027 Harlem zip code saw a huge spike in price increases, as 5 expensive transactions ended up causing a $600,000 median price change. On the other side of Manhattan, the TriBeCa and SoHo zip area had a $900,000 growth.
If you would’ve invested the $850,000 in Dow Jones Industrial shares, the profit in 2017 would’ve been more than double: $2.4 million
Queens Clocks In with a 32% Increase to $285,000
Queens saw a change in prices of roughly 32% over the past decade. The median price was $219,000 in 2008 and rose to $285,000 in 2017, with the western part of the borough seeing the largest price increases. In terms of sales activity, Queens was on par with Brooklyn—the same number of homes were bought in 2008 and sold in 2017, although at a lower price.
Looking at the numbers with inflation added, Queens experienced a mere 10.5% growth. Median prices would have been $258,000 in 2008.
The Long Island City zip area had the most expensive transactions and a median change of $285,000. The priciest sale in the borough was recorded in Hunters Point: a unit at 509 48th Avenue changed hands for almost $2 million in 2017, 70% more than it did in 2008.
Prices in the Bronx Flatline, Rising a Mere 4%
The Bronx didn’t record the same groundbreaking performance as the other boroughs. Out of the 70 assets that were bought in 2008 and sold in 2017, only a few turned a profit. Looking at these transactions, the median sale price increased a mere 4.2% in 2017, from $190,000 to $197,000.
Overall, buying a house back in 2008 and selling it a decade later was not a poor decision—and the numbers prove it. The sole exception is the Bronx. By adding inflation into the mix, the borough saw an 11% drop in median prices.
Methodology:
We gathered data on all the condos and co-ops that were purchased in New York City in 2008 and sold a decade later, in 2017. Only assets that were bought in 2008 and sold in 2017 with no in-between transactions were selected. We calculated the median sale price of these properties in each borough. Staten Island was not included.
Inflation numbers were calculated on the BLS website and the historical Dow Jones Industrial data set was extracted from The Wall Street Journal.
Want to stay on top of the real estate market?
Access comprehensive property data and ownership information with intuitive research tools.
POSTED IN: Market Studies, New York Real Estate

Robert is a copywriter at CommercialCafe and brings 3+ years of experience in commercial real estate. He previously worked as a copywriter at PropertyShark, as a senior associate editor at Commercial Property Executive and Multi-Housing News, and also wrote monthly market reports at Yardi Matrix.
Recent Reports

World Cup or Your Mortgage/Rent? Ticket Prices Rival Host City Housing Costs
World Cup ticket prices rival monthly housing expenses in the 11 U.S. host cities, with even the cheapest seats covering weeks or even months of rent or mortgage payments.

Locked-In Owners, Mobile Renters: Homeowners Stay Put as Renters Move 3.7x More Across Largest U.S. Cities
Renters became the primary drivers of long-distance mobility across the largest U.S. cities, moving 3.7 times more than owners in 2024, as high mortgage rates and housing costs kept many homeowners in place.

$4.6M Hudson Yards Maintains Top Spot, Luxury Sales in Malba Set $2.5M Price Record for Queens
Despite prices declining, Hudson Yards remained the most expensive NYC neighborhood, but TriBeCa’s growth closed the gap to under $400,000, while Malba set a new historic price record for Queens at $2.5 million, securing the highest ranking ever for the borough at #5.