

RELEASED ON May 30, 2019
The Post-Recession Housing Pulse of Medical Centers – Nursing Wages and Home Price Growth
Eliza Theiss | 8 minute read
After looking at the best cities to buy a home in based on your occupation, we decided to switch things around and analyze cities from the perspective of one occupation. With roughly 1 in 53 Americans now employed as nurses, we decided to take a look at the evolution of home prices and nursing wages in the nation’s top medical centers in the decade since the recession. Why nursing? Not only is it one of the most common professions in the country, but unlike many other job sectors, it’s one that remains thoroughly protected from the threat of automation. Additionally, it’s one of the fastest growing job sectors nationally, projected to grow at more than double the rate of the average industry. According to Bureau of Labor Statistics projections, a 15% expansion is expected in the nursing industry through 2026, adding close to 440,000 new jobs nationally. Many of those will be in major medical hubs like New York, Boston and Los Angeles. Although not a universally held opinion, there is ample evidence to support the claim that nursing is a recession-proof occupation. A comprehensive BLS report on employment and wage growth in the nursing industry found that between 2007 and 2010…
After looking at the best cities to buy a home in based on your occupation, we decided to switch things around and analyze cities from the perspective of one occupation. With roughly 1 in 53 Americans now employed as nurses, we decided to take a look at the evolution of home prices and nursing wages in the nation’s top medical centers in the decade since the recession.
Why nursing? Not only is it one of the most common professions in the country, but unlike many other job sectors, it’s one that remains thoroughly protected from the threat of automation. Additionally, it’s one of the fastest growing job sectors nationally, projected to grow at more than double the rate of the average industry. According to Bureau of Labor Statistics projections, a 15% expansion is expected in the nursing industry through 2026, adding close to 440,000 new jobs nationally. Many of those will be in major medical hubs like New York, Boston and Los Angeles.
Although not a universally held opinion, there is ample evidence to support the claim that nursing is a recession-proof occupation. A comprehensive BLS report on employment and wage growth in the nursing industry found that between 2007 and 2010 employment grew 7.6%, while the national average employment contracted 5.6%. Moreover, the nursing industry added hundreds of thousands of jobs during a period when other industries shed millions of jobs nationally. Wage growth was also steady at 8.4%, about the same rate as national wage growth.
Meanwhile, the recession saw home prices tumble, then quickly recover, almost immediately outpacing wage growth. In fact, looking at our target cities, 10 out 12 were already an on upswing in median home prices by 2012, in some cases at spectacular rates – Phoenix’s median jumped 53% in 2012 alone.
Follow the evolution of median home sale prices and nursing wages in 12 of the top medical centers in the country in the interactive table below. Scroll though the drop-down list and select your city.
Baltimore and Philadelphia the most affordable housing markets for nurses
When comparing the median home prices of 2018 and 2008, growth is undeniable. While the national median home price increased 15% in the ten years after the downturn, 10 of our 12 target cities saw their median rise by significantly higher rates. But even Baltimore – which saw the median home price expand only 8% total – closed 2018 with a median of $128,000, a full $10,000 higher than 2008.
At the same time, nursing wages expanded only 2% in the Baltimore MSA. Despite reduced wage growth however, Baltimore ranks as the #1 most affordable city for nurses, with a nursing professional able to buy a home with 1.7 years’ worth of wages.
Philadelphia remains the #2 most affordable housing market for nurses among the nation’s top healthcare hubs, close behind Baltimore – it would take the equivalent of only 1.8 years’ full wages for a nurse to buy a home here. Philadelphia registered a 20% expansion in its median home price, closing 2018 at $138,000. During the same period, nursing wages gained 14% in the Philadelphia MSA. The 2018 average wage for a registered nurse stood at $76,910, per BLS data, following a 7% contraction between 2017 and 2018.
Chicago more affordable for nurses now, than in 2008
Meanwhile, Chicago, the only other city in our list that experienced lower than the national growth rate in home prices, still registered a 13% expansion between 2008 and 2018. This makes Chicago the only large medical center where the rate of wage growth outstripped the median home price growth rate, and the only city where affordability has actually increased for nurses – albeit marginally. It also marks Chicago as one of only two cities in our list where the 2018 median hasn’t reached pre-crash levels – last year’s $225,000 median home price is higher than 2008’s, but still falls short of 2007’s $245,000.
Phoenix is the only other major medical center where pre-crash medians have yet to be reached. However, Phoenix medians have been on an unrelenting climb since 2012, closing 2018 with a median of $240,000 – just $7,500 lower than its 2007 peak. Overall, between 2008 and 2018 the Phoenix median home price climbed 23%, while nursing wages in the Phoenix MSA grew 21%.
Shrinking purchasing power for nurses from NYC to Saint Louis
New York, of course, is far from affordable. Nurse wage growth may have kept better pace with the rising cost of homeownership here compared to most of the other metros we analyzed, but NYC’s housing market remains one of the most unaffordable. Wage growth in the nursing industry totaled 15% between 2008 and 2018, while home prices grew 22%. As things stand, a New York nurse would have to spend their full wage of 7 years to buy a home.
When analyzing home price and nursing wage growth at the national level, the picture is more balanced – both the national median home price and the national nursing wage grew 15% between 2008 and 2018. As such, the national housing market hovers on the lower end of moderately unaffordable for nursing professionals, with the Median Multiple steady at 3.2 both in 2008 and 2018.
However, as the housing markets of large metro areas and small-town America grow further apart, that evolution has an increasing effect on housing affordability metrics in the country’s top metros. Applying the Median Multiple ratio, we get a picture of growing affordability struggles in most top medical hubs, even for an industry that pays above the national median.
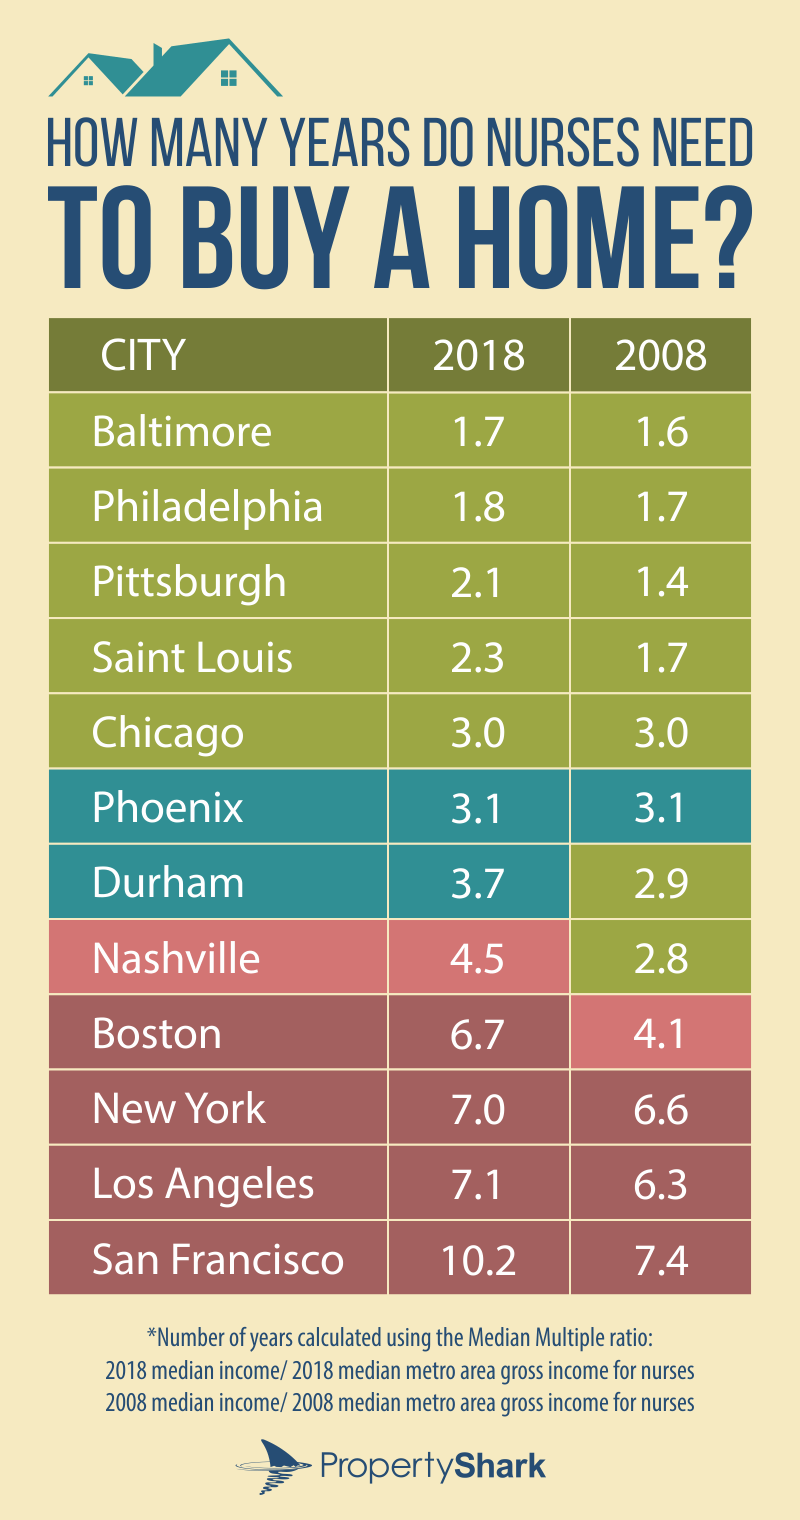
Of our 12 focus cities, only five offer an affordable housing market for nursing professionals – 10 years ago seven were affordable. In fact, was it not for the sluggish recovery of Chicago’s housing market, the only major medical hub where affordability rates increased – albeit by a very small margin – only 4 of the nation’s top medical centers would offer a housing market that is affordable to nursing professionals: Baltimore, Philadelphia, Pittsburgh and Saint Louis. But here too, purchasing power is decreasing.
Saint Louis nurses saw their income expand 14%, while the local median home price grew 56%. While this shift still lands Saint Louis among affordable markets for nurses, it’s characteristic of shrinking purchasing power. The same trend can be observed in Pittsburgh, where a nurse can buy a home with just over two years’ worth of income. In 2008, it would have taken 1.4 yearly wages. Here too, home price growth far outstripped wage growth. While a Pittsburgh nurse saw their income grow 11% between 2008 and 2018, the median home price shot up 57%.
A nurse needs 7 annual wages to buy a home in LA or Boston
In urban hotspots where the housing market was already unaffordable, the situation has only exacerbated. In 2008, Boston was just graduating from moderately unaffordable to seriously unaffordable for nursing professionals. Today, it’s severely unaffordable, with the median home price $605,000 – 6.7 yearly nurse incomes. This comes as the result of massive shifts in the local housing market. Between 2008 and 2018, Boston’s median home price shot up a whopping 78%, while nurse wages grew only 7%.
Then there’s behemoths Los Angeles and San Francisco. Both unaffordable to begin with, nurses’ buying power has only decreased here – unsurprising, considering both are ranked among the top 10 least affordable housing markets globally by the latest International Housing Affordability Survey. Nursing wages in L.A. may have increased 26% between 2008 and 2018, but the median home price gained 43%. From $497,000 in 2008, L.A.’s median climbed to $711,000 in ten years, meaning a nurse would need to spend 7 years’ wages to buy a home. This is just below New York’s affordability rate, despite wages being close to 10% higher in L.A.
San Francisco leader in home price and nursing wage growth
The epitome of sizzling hot West Coast real estate markets, San Francisco is in a category of its own. Nursing wages registered a 36% increase since the recession, clocking in at $132,430 in 2018 – the highest in all of the markets we analyzed. However, that wage growth was accompanied by the meteoric rise of home values. San Francisco was already the leader in 2008 with a median home sale price of $725,000 – a figure higher than any major city managed to reach, even by 2018.
Meanwhile, San Francisco’s economic expansion pushed the median home price up a whopping 86%. As a result, a nurse would need more than 10 annual salaries to buy a home in San Francisco, double what is internationally recognized as severely unaffordable. Then again, in 2008, a San Francisco nurse already needed to spend more than 7 years’ worth of wages to buy a home.
Affordable no longer – Nashville home prices up 75% in the last decade
Then there are the formerly affordable markets where large-scale socio-economic changes transformed the urban landscape and outsized housing cost burdens. Durham, NC added about 43,000 residents between 2008 and 2017 according to the latest Census data, reaching a population of nearly 268,000. Meanwhile, nursing wages gained just 8% between 2008 and 2018, closing 2018 at an annual $63,710.
However, median home prices surged along with the dynamic economic climate, expanding 37%. From $170,000 in 2008, the median home sale price in Durham, NC jumped to $232,250 in 2018, taking Durham’s housing market from affordable for nurses, to moderately unaffordable. While ten years ago a nurse could buy a home with the income of 2.9 years, now it takes 3.7.
Nashville presents an even more dramatic shift. While in 2008 a nurse could buy a home in 2.8 years, in 2018 the median home was equivalent to 4.5 years’ worth of nursing wages. Nashville went from being affordable for nurses in 2008 to seriously unaffordable, as the median sale price went from $161,191 to $285,000.
Nashville’s spectacular median home price growth of 75% is the third highest rate among the top medical centers in the country, surpassed only by boomtown Boston and perennially pricey San Francisco. Nashville too has experienced significant changes in its economy, as well as its population, adding close to 84,000 residents between 2008 and 2017, per Census data.
A San Francisco home earned more in one year than a nurse did
To get the latest snapshot of the country’s top medical centers, we looked at median wage and home price growth in all 12 medical hubs between 2017 and 2018. It turns out that in just one year, a San Francisco home earned more than a nurse – the annual wage for a nurse in the San Francisco MSA was $128,990, while the median home price gained $136,000 year-over-year.
Although by far the most notable example, San Francisco isn’t the only top medical center where home prices grew at spectacular rates compared to nursing wages. Second only to San Francisco’s meteoric price growth, Boston’s median gained $50,000 – about 50% of a Boston nurse’s annual wage, meaning a home earned in a year as much as a nurse did in 6 months.
L.A. wasn’t far behind, with a home here earning 41% of a nurse’s annual wage. Nashville was next in line, with Music City’s median home price climbing $20,000 – meaning a home here earned in a year as much as a nurse did in 4 months. Baltimore’s median expanded 20% year-over-year or about $21,000 in net numbers – more than a quarter of a nurse’s annual wage in Baltimore.
New York ranked in the bottom half due to sluggish home price growth, with a 2% uptick in the median home price equal to 17% of a New York nurse’s annual wage. Philadelphia’s median also gained 17% of a nurse’s annual wage. Durham, Pittsburgh and Chicago medians’ modest price growth meant good news for buyers, as did Saint Louis’ nearly negligible gain – the median home price grew by less than 1%. In fact, Saint Louis was the only city were nurses’ home purchasing power grew between 2017 and 2018 – albeit by only $1,000 annually.
| City | Median Home Price 2018 | Home Price Increase 2017-2018 | MSA Nurse Income 2018 | Home Price Increase as % of Nurse Income |
|---|---|---|---|---|
| San Francisco | $1,350,000 | $136,000 | $128,990 | 105% |
| Boston | $605,000 | $50,000 | $95,270 | 52% |
| Los Angeles | $711,000 | $41,000 | $99,930 | 41% |
| Nashville | $285,000 | $20,000 | $63,830 | 31% |
| Baltimore | $128,000 | $21,000 | $77,920 | 27% |
| Phoenix | $240,000 | $17,200 | $78,080 | 22% |
| New York | $640,300 | $15,300 | $91,160 | 17% |
| Philadelphia | $138,000 | $13,000 | $77,680 | 17% |
| Durham | $232,250 | $7,250 | $67,030 | 11% |
| Pittsburgh | $131,500 | $6,500 | $66,250 | 10% |
| Chicago | $225,000 | $5,000 | $77,710 | 6% |
| Saint Louis | $151,000 | $1,000 | $67,870 | 1% |
To determine the yearly median sale prices for each city, we looked at all residential transactions for single-, two-, three- and four-family homes, condos, coops, row- and townhouses. All package deals were excluded.
For national median sale prices, we sourced Census data, with the exception of 2018. The national median sale price for 2018 is an estimate based on a 4% year-over-year expansion, built on historic price evolution in the past 5 years and current housing trends.
Median income data was sourced from the Bureau of Labor Statistics and represents the annual median wage for each city’s MSA.
To calculate affordability scores, we used the Median Multiple method, the ratio of the median house price by the gross annual income. The World Bank-endorsed Median Multiple indicator separates housing markets into four affordability categories by dividing a market’s median home price by the market’s gross yearly income. This figure represents how many years it would take to buy a home if all wages would be funneled into paying the median home price.
Affordable: median home price/gross income = 3 or less
Moderately unaffordable: median home price/gross income = 3.1 to 4
Seriously unaffordable: median home price/gross income = 4.1 to 5
Severely unaffordable: median home price/gross income = 5.1 or more
We determined the following cities to be the top medical centers in the U.S.: Baltimore, Boston, Chicago, Durham, Los Angeles, Nashville, New York, Philadelphia, Phoenix, Pittsburgh, Saint Louis and San Francisco based on the number of nursing professionals in each city, number and ranking of hospitals and healthcare centers. Only cities with populations over 200,000 were taken into consideration.
Want to stay on top of the real estate market?
Access comprehensive property data and ownership information with intuitive research tools.
POSTED IN: Market Studies, National

Eliza Theiss is a senior writer reporting real estate trends in the US. Her work has been cited by CBS News, Curbed, The Los Angeles Times, and Forbes among others. With an academic background in journalism, Eliza has been covering real estate since 2012. Before joining PropertyShark, Eliza was an associate editor at Multi-Housing News and Commercial Property Executive. She has also contributed extensively to CommercialEdge. Reach her at [email protected]
Recent Reports

World Cup or Your Mortgage/Rent? Ticket Prices Rival Host City Housing Costs
World Cup ticket prices rival monthly housing expenses in the 11 U.S. host cities, with even the cheapest seats covering weeks or even months of rent or mortgage payments.

Locked-In Owners, Mobile Renters: Homeowners Stay Put as Renters Move 3.7x More Across Largest U.S. Cities
Renters became the primary drivers of long-distance mobility across the largest U.S. cities, moving 3.7 times more than owners in 2024, as high mortgage rates and housing costs kept many homeowners in place.

$4.6M Hudson Yards Maintains Top Spot, Luxury Sales in Malba Set $2.5M Price Record for Queens
Despite prices declining, Hudson Yards remained the most expensive NYC neighborhood, but TriBeCa’s growth closed the gap to under $400,000, while Malba set a new historic price record for Queens at $2.5 million, securing the highest ranking ever for the borough at #5.