

RELEASED ON November 12, 2019
Multifamily Sales Volume Declines City-Wide, But Gains 26% Y-o-Y in Brooklyn
Eliza Theiss | 6 minute read
Key Takeaways: City-wide multifamily sales volume down 60% Y-o-Y. Brooklyn sales volume climbs 26% Y-o-Y. NYC price per unit gains 26% over year-ago figures. Top multifamily sale in Manhattan fetches $53 million. YTD unit volume drops 65% in Queens. Sales activity down 60% in the Bronx. As New York City’s commercial real estate market adjusts to the new Housing Stability and Tenant Protection Act of 2019 (TPA), PropertyShark continues to keep a close eye on the evolution of the city’s multifamily landscape. Specifically, after analyzing multifamily sales recorded in the month of November in Manhattan, Brooklyn, the Bronx and Queens, it became clear that NYC’s multifamily slowdown is ongoing. In particular, city-wide sales volume was down 60% year-over-year to $412 million from November 2018’s $1.04 billion. At the same time, sales activity dropped, too – just 71 transactions closed this November. And, as we observed in September, the size of traded properties was also smaller. While NYC’s multifamily sales activity contracted 30% year-over-year, unit volume fell at more than twice that rate, plunging 65%. Year-to-date figures were also significantly lower than they were in the same period last year; this year, NYC recorded a sales volume of $7.34 billion, which…
Key Takeaways:
- City-wide multifamily sales volume down 60% Y-o-Y.
- Brooklyn sales volume climbs 26% Y-o-Y.
- NYC price per unit gains 26% over year-ago figures.
- Top multifamily sale in Manhattan fetches $53 million.
- YTD unit volume drops 65% in Queens.
- Sales activity down 60% in the Bronx.
As New York City’s commercial real estate market adjusts to the new Housing Stability and Tenant Protection Act of 2019 (TPA), PropertyShark continues to keep a close eye on the evolution of the city’s multifamily landscape. Specifically, after analyzing multifamily sales recorded in the month of November in Manhattan, Brooklyn, the Bronx and Queens, it became clear that NYC’s multifamily slowdown is ongoing.
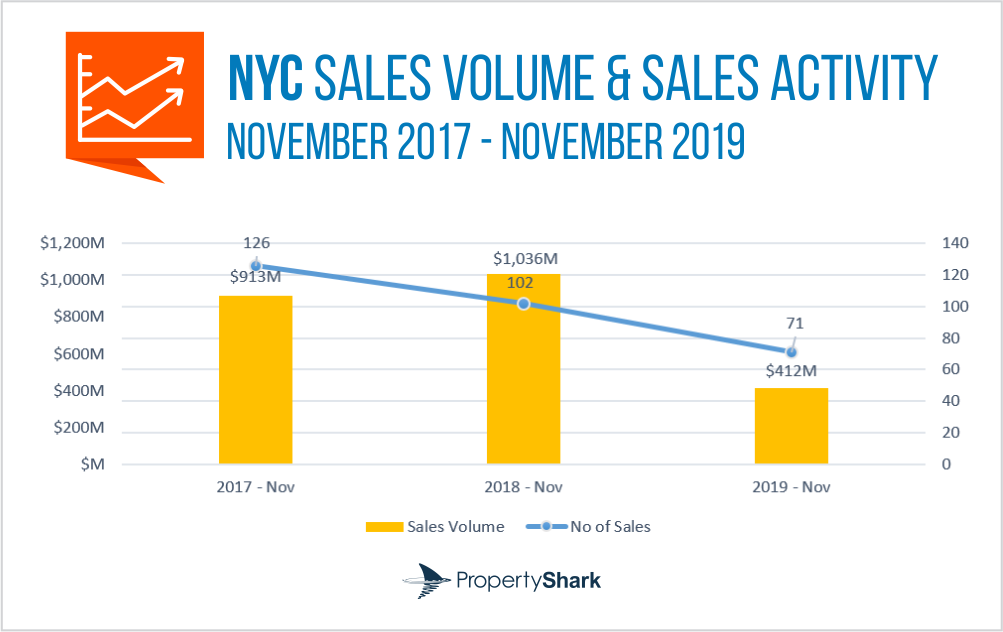
In particular, city-wide sales volume was down 60% year-over-year to $412 million from November 2018’s $1.04 billion. At the same time, sales activity dropped, too – just 71 transactions closed this November. And, as we observed in September, the size of traded properties was also smaller. While NYC’s multifamily sales activity contracted 30% year-over-year, unit volume fell at more than twice that rate, plunging 65%.
Year-to-date figures were also significantly lower than they were in the same period last year; this year, NYC recorded a sales volume of $7.34 billion, which is $3.83 billion less than what was sold between January 1 and November 30, 2018. The slowdown of multifamily transactional activity was also evident in the number of deals closed year-to-date, with 893 recorded sales in the first 11 months of 2019. By comparison, the first 11 months of 2018 saw 1,209 deals close.
However, the slowdown of NYC’s multifamily market was perhaps most evident when looking at the number of units sold: 20,124 between January 1 and November 30 of the current year, as opposed to the 44,308 that traded hands in the same timeframe last year.
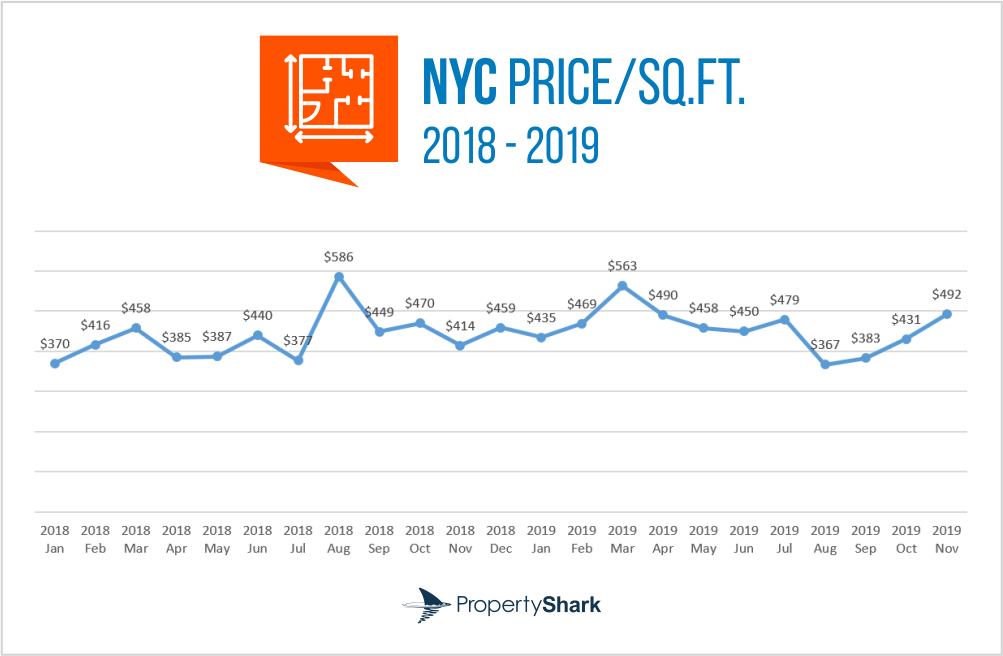
But, it wasn’t all bad news for city-wide multifamily metrics. November brought positive price trends, such as the city-wide price per square foot, which climbed 19% year-over-year to $492. At the same time, the price per unit registered an even sharper gain of 26% to close November at $419,937 per unit.
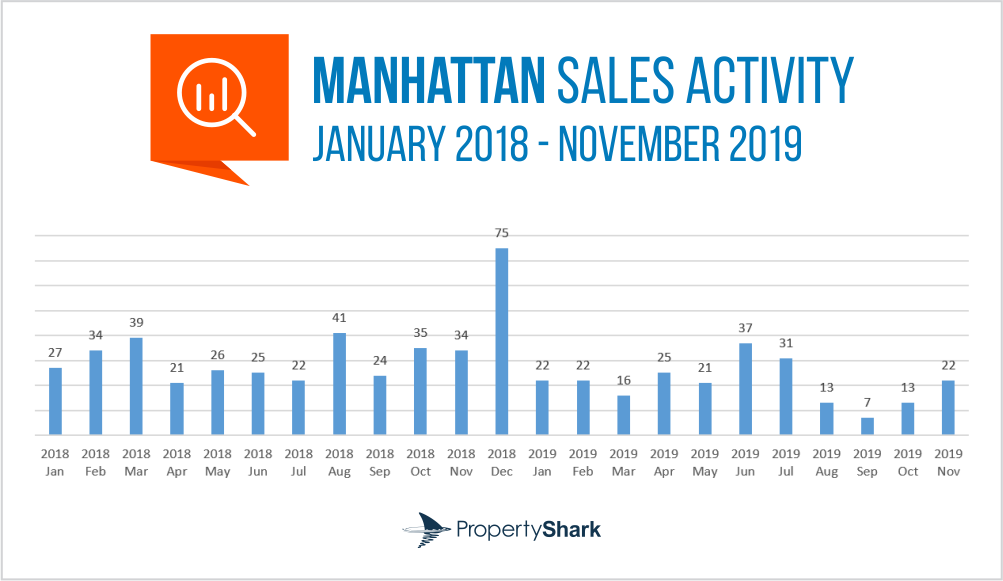
Manhattan Sales Volume Down 55%, While Price/Sq. Ft Gains 25% Y-o-Y
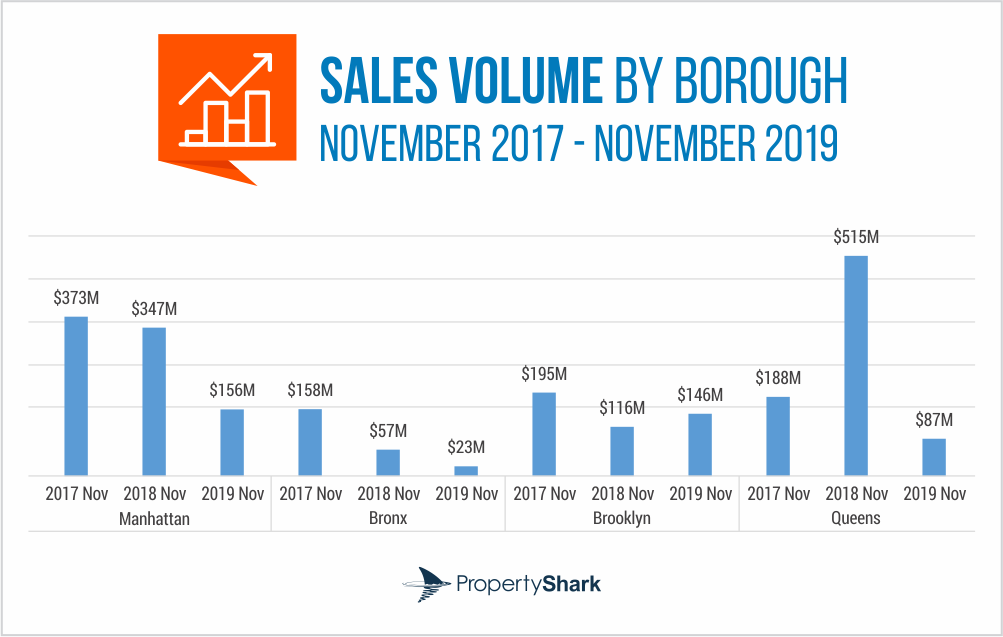
Multifamily metrics in Manhattan were in line with city-wide trends, namely positive price trends accompanied by a slowdown in transactional activity. Specifically, sales activity was 35% lower in the borough in 2019 than it was a year ago, with 22 deals closed for a total November sales volume of $156 million. As such, Manhattan’s multifamily sales volume registered a 55% year-over-year drop.
At the same time, unit volume in the borough plummeted 64% year-over-year, with only 335 multifamily units sold in November 2019. Of those, 127 units were included in the sale of 360 Amsterdam Avenue. The Upper West Side high-rise was the borough’s top deal in November, trading hands for $53.2 million. It was also NYC’s second-most expensive multifamily deal in November.
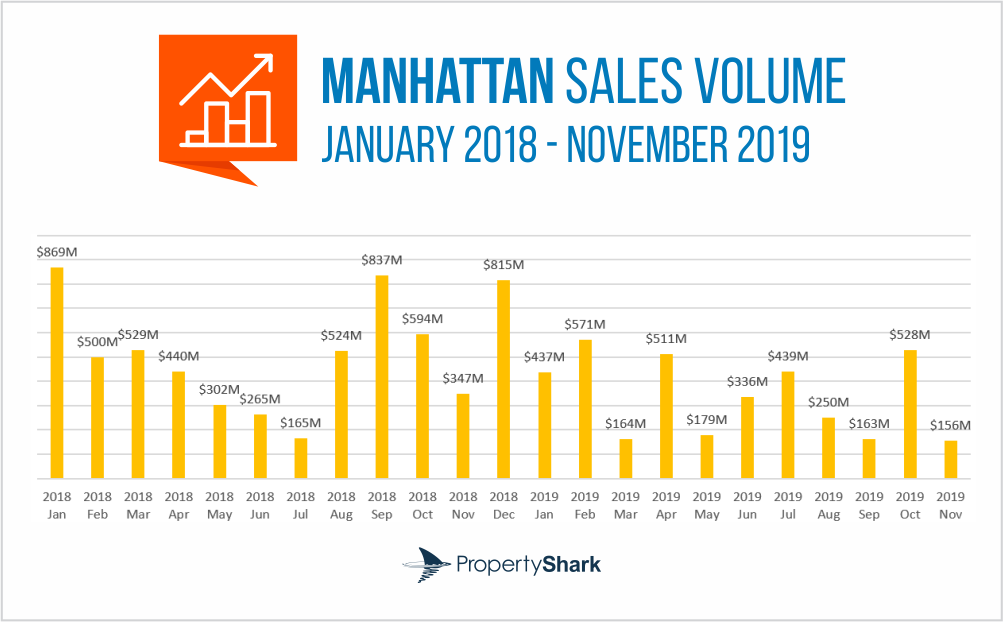
When looking at year-to-date figures, the slowdown of Manhattan’s multifamily market is just as evident. Between January and November, 6,589 units were sold in the borough – 54% less than during the same timeframe last year – while the borough’s sales volume came in at $3.73 billion, which is $1.64 billion less than it was in the first 11 months of 2018.
Price trends, however, were on the upswing in November. The average price per unit in Manhattan was $582,163 – by far the highest of the four boroughs – and up 22% year-over-year. The average price per square foot reached $782, up 25% over November 2018 figures.
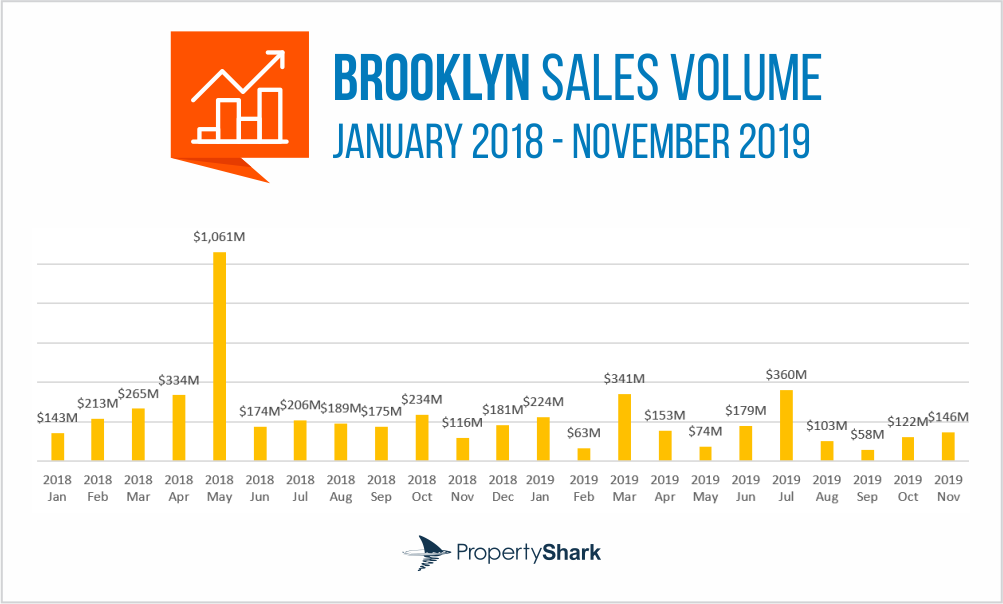
Brooklyn Sales Volume Up 26% Y-o-Y, As Price Per Unit Surges 46%
Brooklyn’s multifamily price trends were also on the rise in November, with the average price per square foot gaining 8% year-over-year. At $401 per square foot, this was the second highest in the four boroughs. Furthermore, the average price per unit in Brooklyn registered an even more significant gain compared to last year’s figures, closing the month at $446,610 – an impressive 46% increase.
Brooklyn’s sales activity trended in line with the rest of NYC, experiencing a slowdown in transactional activity. As such, the borough registered 28 multifamily deals, 20% fewer than in November 2018. However, among those transactions was the sale of 39 Waverly Avenue, which at $67,250,000 was NYC’s most expensive multifamily deal in November.
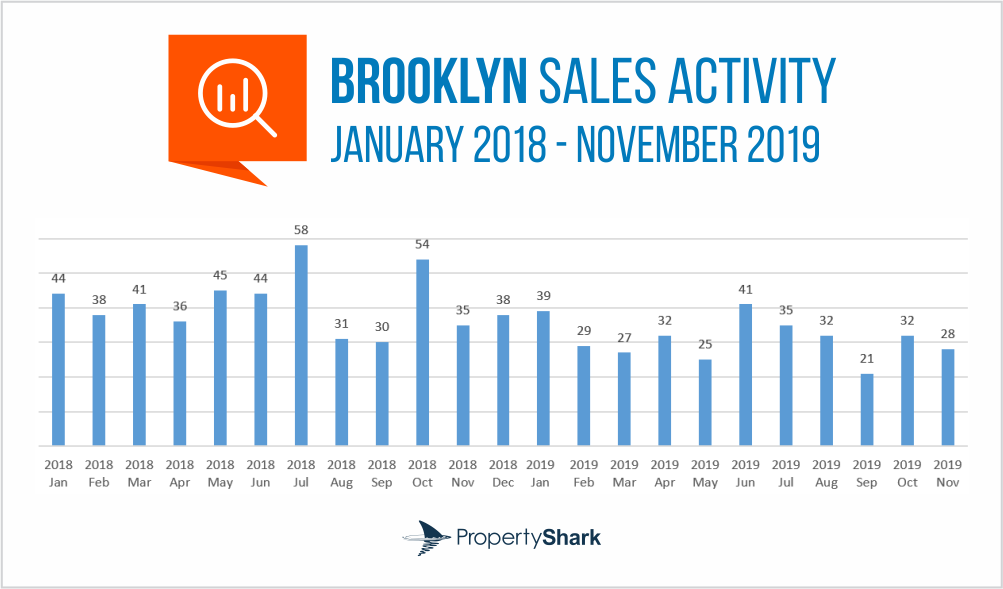
The sale of 39 Waverly Avenue contributed to the year-over-year increase of the borough’s sales volume. Totaling $146 million, Brooklyn’s multifamily sales volume was 26% higher than November 2018’s $116 million. As such, Brooklyn was also the only borough to register growth; the other three boroughs all experienced contractions in their sales volumes.
Unit volume, however, was down 29% year-over-year for the borough, with only 264 units traded in November. What’s more, year-to-date figures show an even sharper rate of slowdown in multifamily transactions in Brooklyn, with only 5,617 units sold since January – a 63% drop compared to the same period last year. Additionally, year-to-date sales volume was down 41% compared to the first 11 months of 2018.
Queens Sales Volume Tumbles 83% Y-o-Y, While YTD Unit Volume Drops 65%
Sales activity in Queens was relatively stable, with November only 7% slower in 2019 than it was in 2018. In total, 14 multifamily deals were recorded in Queens; among them was the sale of 41-15 29th Street. At $47 million, this was the borough’s top deal, as well as NYC’s third-priciest multifamily transaction for November. In fact, the 103-unit apartment building accounted for more than one-third of the borough’s unit volume for the month and more than half of its sales volume.
Queens’ sales volume totaled $86,862,500 in November, a drastic 83% below its 2018 figure. However, it must be noted that November 2018 was an unusually strong month for Queens; at that time, its sales volume surpassed $515 million, which was a whopping 175% over November 2017 levels. Still, transactional activity in the borough has slowed drastically. Year-to-date, Queens’ sales volume stood at $917 million – 43% lower than it was in the same period in 2018.
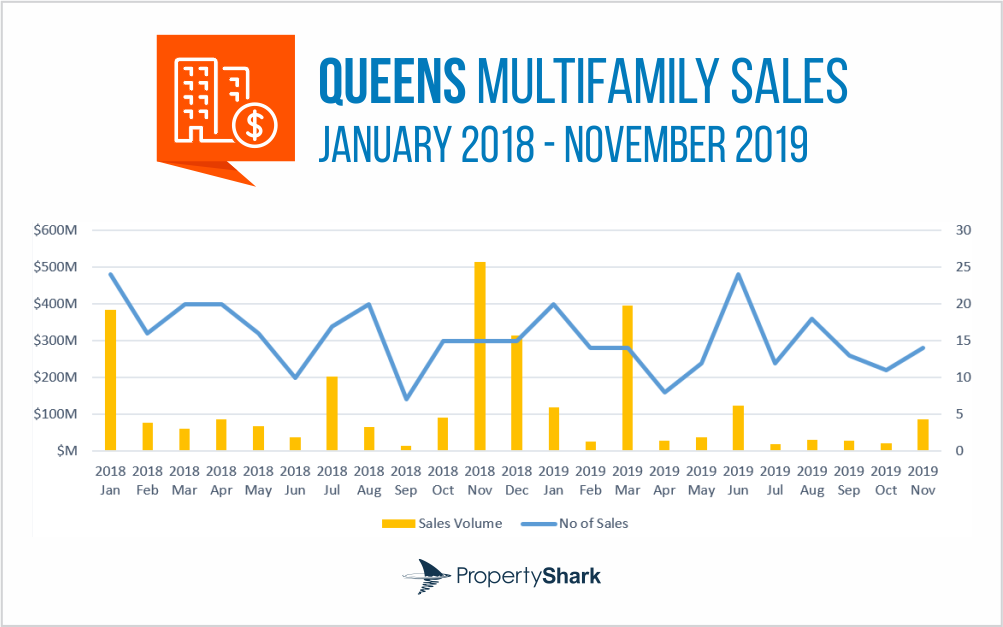
Year-to-date unit volume reflected the same trend, with a total of 2,797 units traded in the first 11 months of the year. This represents a 65% drop compared to the same time period last year. That contraction was even sharper in November, which saw 306 units trade hands in 2019, a 79% year-over-year drop.
But it wasn’t all negative growth for Queens; the borough’s price trends were up. While the average price per unit in Queens expanded only 1% year-over-year, the average price per square foot gained 23% over last year’s numbers. As a result, the average price for a Queens multifamily unit was $254,563 in November, while the price per square foot stood at $381.
Sales Activity Slows 61% Y-o-Y in the Bronx, Sales Volume Contracts 60%
The Bronx was the only borough where price trends were negative in November. At $167, the average price per square foot came in 8% below 2018 prices. Similarly, the average price per unit came in at $134,142, undergoing a 25% contraction year-over-year.
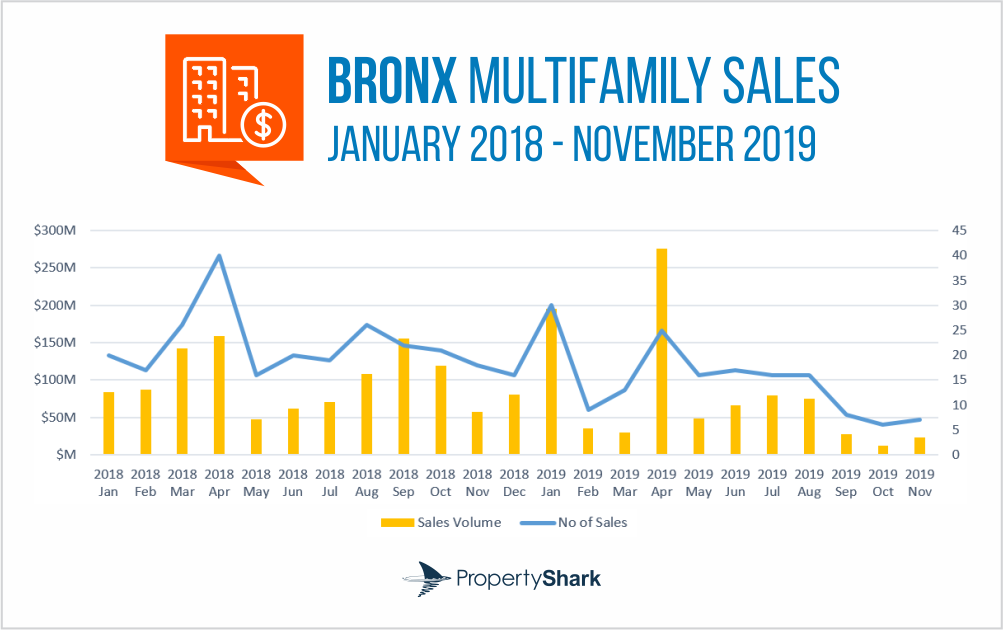
Sales activity was on a sharp downward curve, as well, coming in at 61% below November 2018 figures. Of the seven multifamily deals closed in November, the highest price was commanded by a seven-building portfolio in Mott Haven. With a sale price of $8,242,381, the sale represented more than one-third of the borough’s sales volume for the month. Reaching $23 million, the Bronx’s November sales volume was down 60% year-over-year.
Year-to-date trends in the Bronx were also on a downward curve compared to 2018. Between January 1 and November 30 of the current year, the Bronx saw $867 million worth of multifamily deals close, coming in 21% below the same period last year. And, in the same timeframe, 33% fewer multifamily deals were closed in the Bronx than in 2018, while unit volume was down 28%.
Read the September 2019 Multifamily Report here.
Methodology
The seven-building portfolio that represented the largest multifamily deal in the Bronx included the following properties: 510 East 139th Street, 518 East 139th Street, 227 St. Ann’s Avenue, 225 St. Ann’s Avenue, 605 East 138th Street, 278 St. Ann’s Avenue and 282 St. Ann’s Avenue.
For November’s multifamily snapshot, we took into consideration all multifamily building sales registered between January 1, 2017 and November 30, 2019, in the boroughs of Manhattan, Brooklyn, Queens and the Bronx. All sales were counted for the month they were registered in.
All deals between related parties were excluded. Properties with fewer than five units were excluded, as well, as were deals with a sale price below $100,000.
Want to stay on top of the real estate market?
Access comprehensive property data and ownership information with intuitive research tools.
POSTED IN: Bronx Real Estate, Market Studies

Eliza Theiss is a senior writer reporting real estate trends in the US. Her work has been cited by CBS News, Curbed, The Los Angeles Times, and Forbes among others. With an academic background in journalism, Eliza has been covering real estate since 2012. Before joining PropertyShark, Eliza was an associate editor at Multi-Housing News and Commercial Property Executive. She has also contributed extensively to CommercialEdge. Reach her at [email protected]
Recent Reports

Locked-In Owners, Mobile Renters: Homeowners Stay Put as Renters Move 3.7x More Across Largest U.S. Cities
Renters became the primary drivers of long-distance mobility across the largest U.S. cities, moving 3.7 times more than owners in 2024, as high mortgage rates and housing costs kept many homeowners in place.

$4.6M Hudson Yards Maintains Top Spot, Luxury Sales in Malba Set $2.5M Price Record for Queens
Despite prices declining, Hudson Yards remained the most expensive NYC neighborhood, but TriBeCa’s growth closed the gap to under $400,000, while Malba set a new historic price record for Queens at $2.5 million, securing the highest ranking ever for the borough at #5.
2026 Q1 Foreclosure Report: Brooklyn Filings Fall Sharply, Bronx & Staten Island Hit New Peaks
Behind a deceptively mild citywide downtick, borough foreclosure markets pulled into significantly diverging paths as Brooklyn cases were nearly halved and the Bronx hit a new, record high. Meanwhile, Queens remained unchanged, Staten Island surged back up and Manhattan cooled slowly.