

RELEASED ON October 29, 2019
NYC Multifamily Market Continues Slowdown in September, Y-O-Y Sales Volume Declines 76%
Eliza Theiss | 6 minute read
Key Takeaways: September slowest sales month for NYC multifamily, down 51% Y-O-Y Queens doubles September sales volume Bronx prices hit lowest figure in 18 months YTD unit volume down 74% in Brooklyn Y-O-Y sales volume falls 81% in Manhattan City-wide sales volume drops 76% Y-O-Y New York City’s new Housing Stability and Tenant Protection Act of 2019 (TPA) sent shockwaves through the residential and commercial real estate market, especially the multifamily sector. While plenty has been said about the new law’s effects, we were curious to see exactly what dynamics were at play in a post-TPA multifamily market. We analyzed multifamily sales in Manhattan, Brooklyn, Queens and the Bronx for the month of September to get an accurate snapshot of the situation on the ground. The key trend for the city’s multifamily market in September was a large-scale slowdown. City-wide, sales volume fell a staggering 76%, totaling a mere $284 million across the four boroughs. By comparison, in September 2018, Manhattan alone registered $837 million in multifamily sales. Sales activity also dropped sharply, falling 34% year-over-year. In fact, the 55 deals registered in September represent the slowest month for NYC multifamily sales in at least 33 months (we analyzed monthly…
Key Takeaways:
- September slowest sales month for NYC multifamily, down 51% Y-O-Y
- Queens doubles September sales volume
- Bronx prices hit lowest figure in 18 months
- YTD unit volume down 74% in Brooklyn
- Y-O-Y sales volume falls 81% in Manhattan
- City-wide sales volume drops 76% Y-O-Y
New York City’s new Housing Stability and Tenant Protection Act of 2019 (TPA) sent shockwaves through the residential and commercial real estate market, especially the multifamily sector. While plenty has been said about the new law’s effects, we were curious to see exactly what dynamics were at play in a post-TPA multifamily market. We analyzed multifamily sales in Manhattan, Brooklyn, Queens and the Bronx for the month of September to get an accurate snapshot of the situation on the ground.
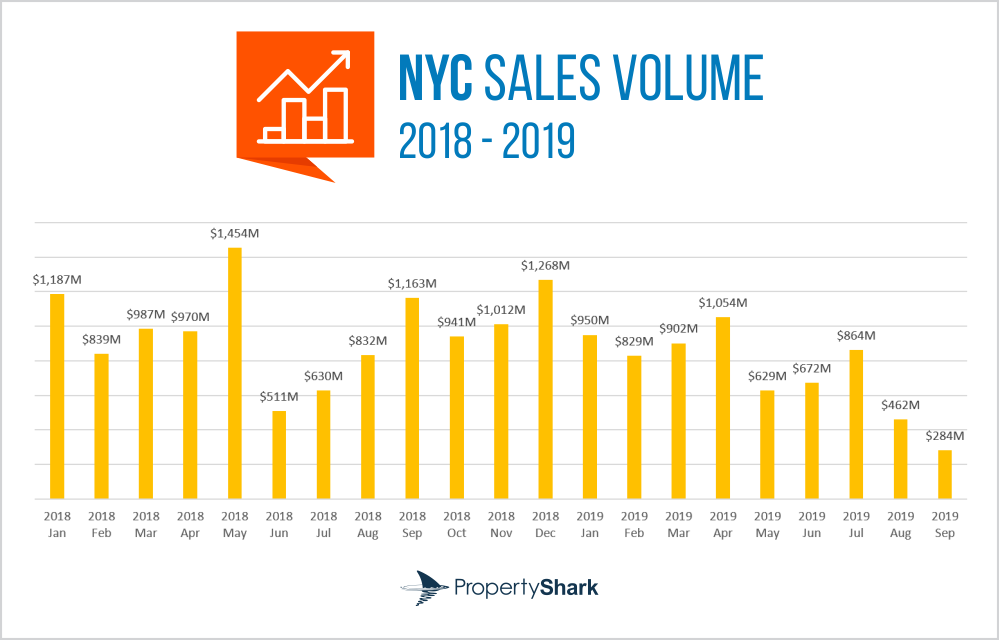
The key trend for the city’s multifamily market in September was a large-scale slowdown. City-wide, sales volume fell a staggering 76%, totaling a mere $284 million across the four boroughs. By comparison, in September 2018, Manhattan alone registered $837 million in multifamily sales. Sales activity also dropped sharply, falling 34% year-over-year. In fact, the 55 deals registered in September represent the slowest month for NYC multifamily sales in at least 33 months (we analyzed monthly sales data going back to January 2017).
But it wasn’t just that there were significantly fewer deals closed this September compared to September 2018; the size of the multifamily properties that were traded fell, as well. While there were 34% fewer multifamily sales registered last month than one year ago, unit volume was halved. Only 1,146 multifamily units traded hands last month across the four boroughs, while September 2018 saw 916 units traded in the Bronx alone.
Additionally, year-to-date unit volume across the four boroughs was 51% lower than the same period last year, and 7% lower than it was two years ago. Between January 1 and September 30 of the current year, 14,509 multifamily units were sold, while the same period last year saw 25,368 units go under new ownership. NYC’s year-to-date sales volume stood at $6.65 billion in September – nearly $2 billion less than the first nine months of 2018, which registered $8.57 billion in multifamily sales.
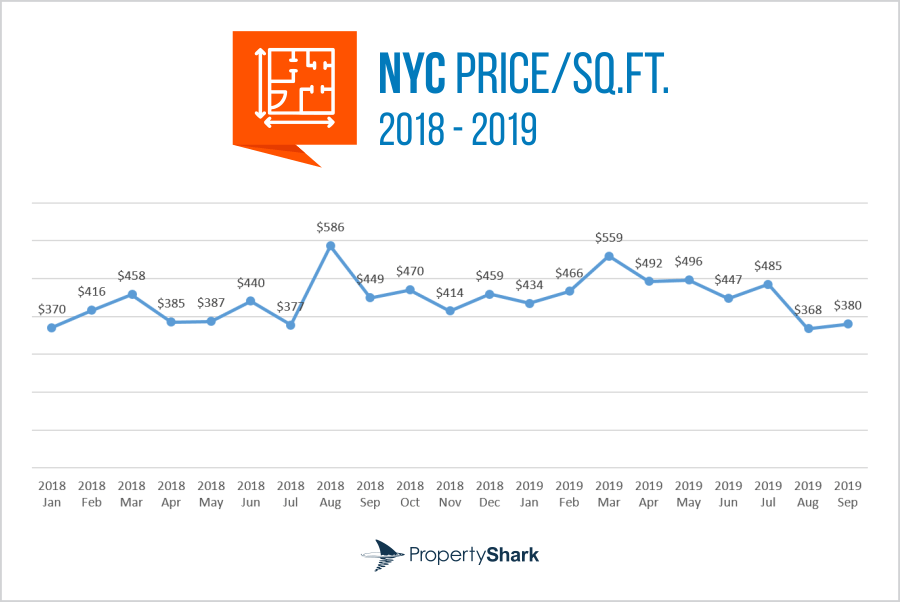
At $335,032, September’s average price per unit stayed in line with the city’s downward trend – depreciating 17% year-over-year – while the $380 average price per square foot was 15% lower than in September 2018. Both figures were also lower than their September 2017 values.
Manhattan Multifamily Units Hit Hardest; Sales Volume Plummets 81%
Much of NYC’s post-TPA multifamily slowdown was fueled by sharp drops in Manhattan’s multifamily scene. As the city’s most expensive submarket, Manhattan’s influence over city metrics is undeniable: in 2018, nearly half of NYC’s $11.8 billion sales volume originated in Manhattan, which totaled $6.2 billion in multifamily sales.
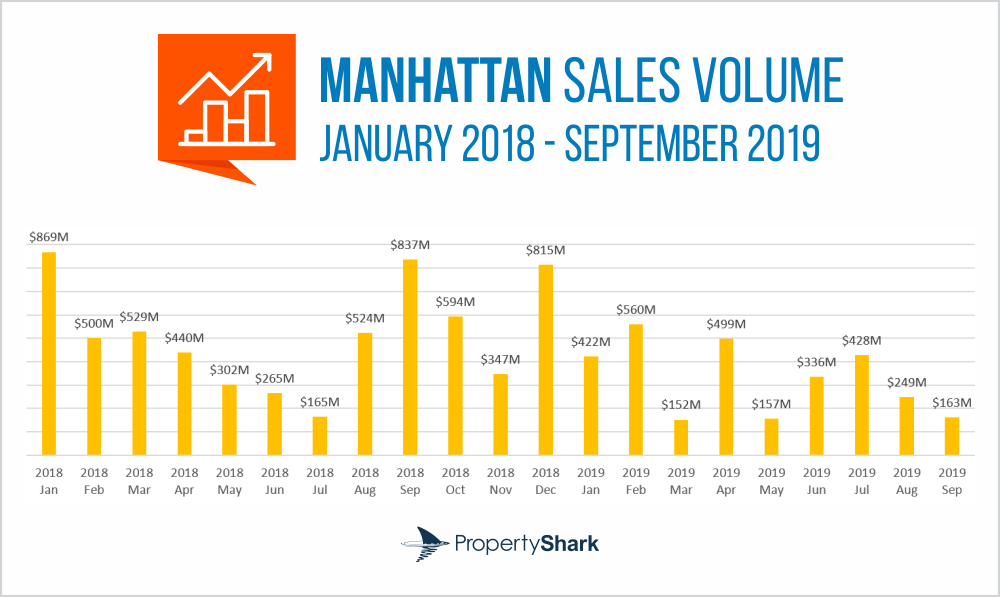
As sales volume fell 76% across the four boroughs, Manhattan’s sales volume was in freefall in September, plummeting 81% year-over-year. What’s more, this came on the heels of August’s 52% year-over-year contraction. Last month’s $163 million sales volume was a mere fraction of September 2018’s $837 million in multifamily sales, or even the $413 million recorded in September 2017.
Manhattan’s multifamily slowdown is also emphasized by year-to-date figures: while the first nine months of 2018 totaled $4.43 billion in sales, the borough has recorded only $2.96 billion in multifamily sales year-to-date. That’s just $200 million more than Brooklyn saw during the same period last year.
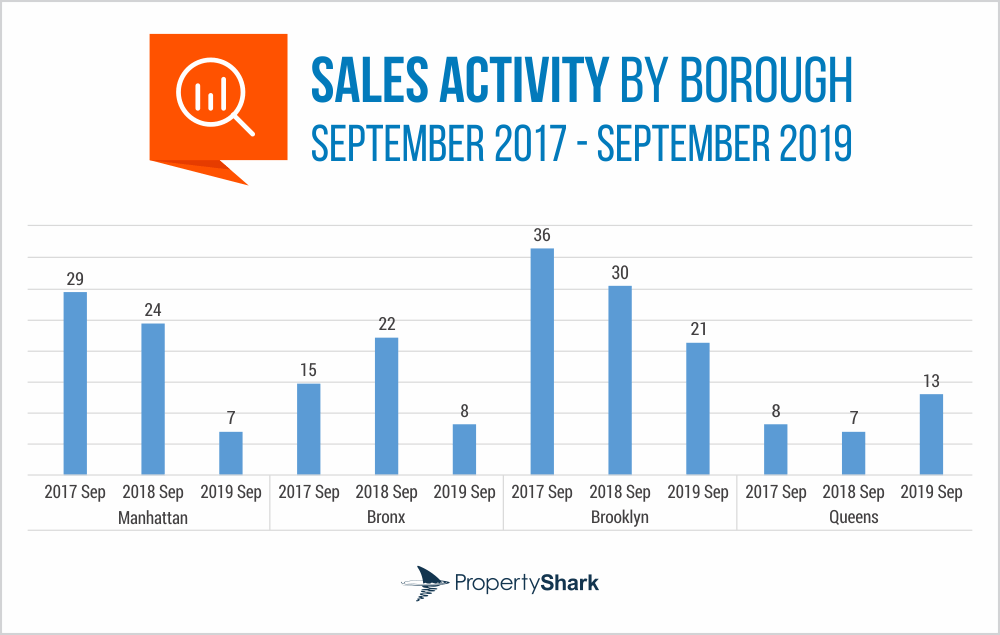
Sales activity also fell in Manhattan, dropping 71% year-over-year with only seven deals closed. Of that, three transactions represented the overwhelming majority of the borough’s sales volume, totaling $153 million, as well as the city’s top three priciest deals. In particular, 400 W 113 Street, a 430-unit high-rise in Morningside Heights, was NYC’s most expensive multifamily deal in September at $57 million. It was followed by the $44,792,000 price tag fetched by the East Village’s 60 E 12th Street. 18 E 73rd Street in Lenox Hill rounded out the podium at $27 million.
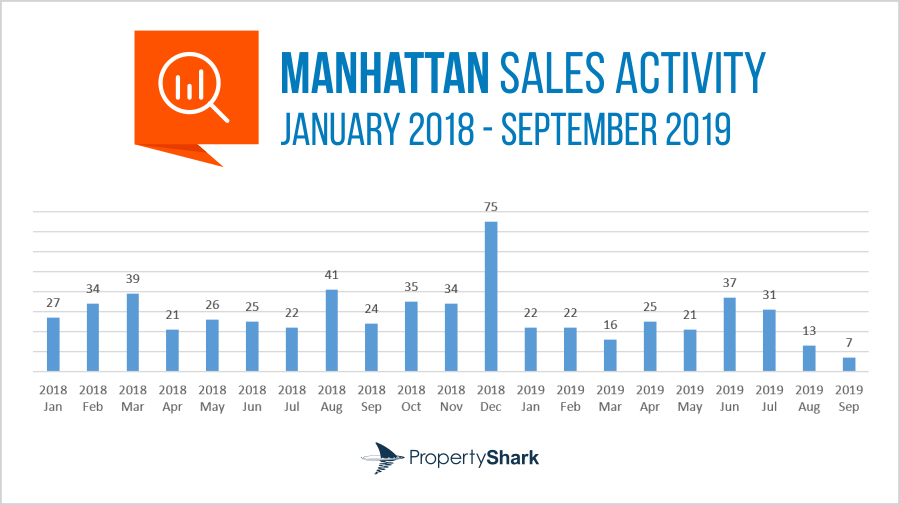
As proved by the location of NYC’s top deals, Manhattan remains the absolute price leader despite massive slowdowns in sales. In fact, the borough saw a 12% uptick in its price per square foot compared to 2018 figures, while its price per unit expanded 40% – surpassing the $1 million mark. However, unit volume was down sharply, with only 663 units sold last month, compared to 1,308 in September 2018.
Transactional Activity Surges in Queens; Sales Volume Doubles
Queens was the darling of NYC multifamily in September, with $29 million in sales registered, as opposed to the $14.5 million in September 2018. That 100% growth rate was fueled by an 86% acceleration in sales activity, totaling 147 units across 13 deals. Of those, the highest price was commanded by 18-82 Madison Street, a six-unit walk-up that sold for $2.89 million.
However, the positive growth in Queens’ September sales volume and sales activity is less a signifier of shifting slowdown trends, and more a sign of the unusually slow sales month that was September 2018. When looking at year-to-date figures, Queens is more in line with NYC’s overall multifamily slowdown.
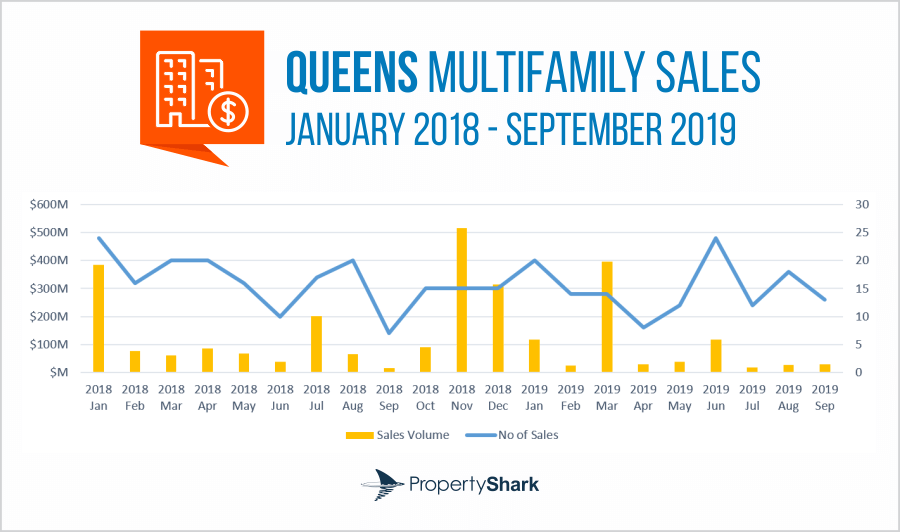
Year-to-date, Queens registered $795 million in sales, representing a 20% contraction over the same period last year. Year-to-date unit volume figures also emphasize the reduced transactional activity of the borough: between January 1 and September 30 of the current year, only 1,949 multifamily units were sold here – 69% fewer than during the same period last year.
Similarly, Queens posted a $276/square foot average in September – 11% lower than year-ago figures and the lowest price per square foot since October 2018. The average price per unit stood at $204,852, a 14% expansion year-over-year, and the second-lowest figure since September 2018.
Brooklyn Multifamily Halts, YTD Sales Volume 76% Below 2018 Levels
With 21 deals recorded in September, Brooklyn’s sales activity was down 30%, marking the second consecutive September of reduced sales activity. Those 21 deals totaled $57 million, meaning that Brooklyn’s sales volume fell 68% year-over-year and 74% compared to September 2017. The priciest of those deals was the $8.2 million sale of 205 E 17th Street, a 54-unit high-rise in Prospect Park South.
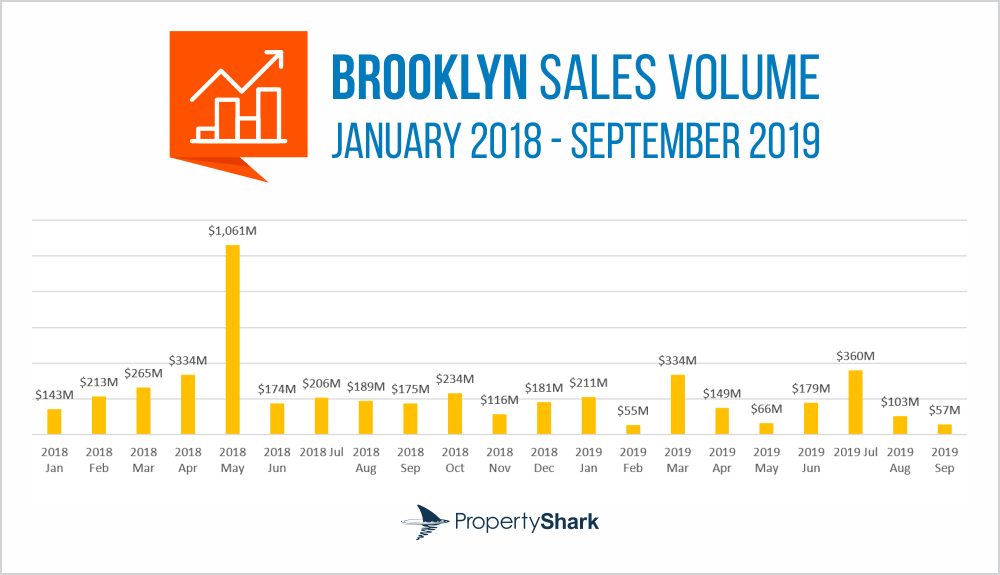
Similar to Manhattan, Brooklyn’s year-to-date sales figures emphasize the multifamily market’s slowdown. While the first nine months of 2018 totaled $2.76 billion in multifamily deals here, the same time frame in the current year registered only $1.51 billion.
With just 171 units traded, September figures were down 73% year-over-year. That slowdown in transactional activity fit with the overall trend in Brooklyn this year: 3,639 units traded year-to-date as opposed to the 14,006 sold during the same timeframe last year, representing a sharp 74% decline.
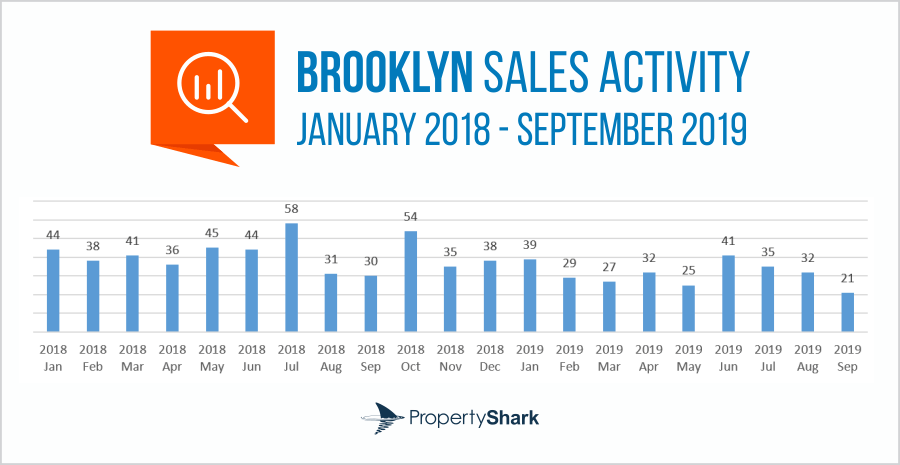
Multifamily prices represented a mix in September: Brooklyn’s $348/square foot was a negligible 2% higher year-over-year, while the average price per unit depreciated 21% year-over-year to $271,160.
Bronx Sales Drop to Single Digits, Hit Lowest Prices in 18 Months
With just eight deals closed last month, September saw sales activity decrease 64% in the Bronx. As a result, the borough recorded a sales volume of only $28 million, representing a steep 82% decrease year-over-year. Half of that was represented by the borough’s top deal, a $14-million portfolio of 11 properties located in the Bronx’s Morrisania, Woodstock and Foxhurst neighborhoods.
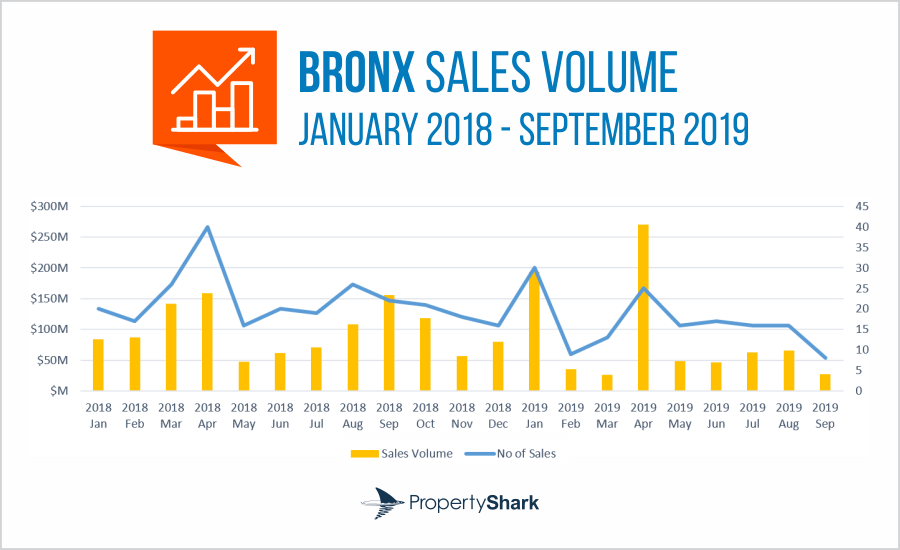
Year-to-date trends in the Bronx lined up with those of the other three boroughs, as transactional metrics stayed below 2018 levels. The borough’s year-to-date sales totaled $777 million in September, 15% less than the same time last year, while the 4,208 units sold since the start of the year represented a 31% contraction compared to the first nine months of 2018.
Prices were also on a downward slide in September, with the Bronx’s $161/square foot the result of a 23% year-over-year drop. The average price per unit dropped at a steeper 27% rate year-over-year, bottoming out at $128,041, the lowest price per unit in the borough since March 2018.
Methodology
For September’s multifamily snapshot, we took into consideration all multifamily building sales registered between January 1, 2017 and September 30, 2019 in the boroughs of Manhattan, Brooklyn, Queens and the Bronx. All sales were counted for the month they were registered in.
All deals between related parties were also excluded. Properties with fewer than 5 units were excluded as well, as were deals with a sale price below $100,000.
The 11-building portfolio that ranked as the top multifamily deal in The Bronx included the following properties: 3414 Park Avenue, 3416 Park Avenue, 3428 Park Avenue, 3430 Park Avenue, 3318 Third Avenue, 3414 Third Avenue, 3416 Third Avenue, 581 E 164th Street, 915 Prospect Avenue, 635 E 169th Street and 797 E 170th Street.
Want to stay on top of the real estate market?
Access comprehensive property data and ownership information with intuitive research tools.
POSTED IN: Bronx Real Estate, Brooklyn Real Estate

Eliza Theiss is a senior writer reporting real estate trends in the US. Her work has been cited by CBS News, Curbed, The Los Angeles Times, and Forbes among others. With an academic background in journalism, Eliza has been covering real estate since 2012. Before joining PropertyShark, Eliza was an associate editor at Multi-Housing News and Commercial Property Executive. She has also contributed extensively to CommercialEdge. Reach her at [email protected]
Recent Reports

2026 Q2 Foreclosure Report: Bronx Caseload Hits 7-Year High, Brooklyn & Manhattan Slow to 4-Year Low
Manhattan yet again slowed to become the city’s least active foreclosure market, Brooklyn’s caseload dropped so low it barely edged out Staten Island, while the Bronx heated up enough to surpass all boroughs except Queens.

NYC Resale Gains & Losses: Every Borough Made Money in 2025, Except Manhattan
In 2025, NYC home-sellers mostly made money. But, in Manhattan, resales came with losses — and it was apartments and recent buyers that absorbed them.

World Cup or Your Mortgage/Rent? Ticket Prices Rival Host City Housing Costs
World Cup ticket prices rival monthly housing expenses in the 11 U.S. host cities, with even the cheapest seats covering weeks or even months of rent or mortgage payments.