

RELEASED ON January 13, 2020
Central Business Districts vs. Urban vs. Suburban: Breaking Down 10 Years of Office Expansion in the US
Alexandra Farcas | 3 minute read
Between 2008 and 2018, the U.S. expanded its office footprint by 682 million square feet, 370 million of which have been added in the top 20 markets. Using data from Yardi Matrix, a recent COMMERCIALCafé study looked closely at where this space was added—urban areas, suburban areas or central business districts (CBDs). The findings highlight regional differences and offer insight into what drives demand in certain areas. To avoid confusion, it is important to note that “urban” does not include the central business district. Regionally, the Northeast—which includes New York City, Philadelphia, and Boston—added the most office space during the decade, specifically 130.5 million square feet. Urban areas here grew by 16.5%, representing 55 million square feet. In addition, CBDs grew by 5.3%, or 24 million square feet. This is an impressive feat considering how dense these downtowns already are, and it shows that there’s still interest in central locations. Meanwhile, the Southwest increased its office inventory by more than 108 million square feet. However, in contrast to the Northeast, three-quarters of this added square footage was in suburban locations. This comes as no surprise given the different compositions of the two regions—sprawling suburbs as opposed to dense cities. Similarly,…
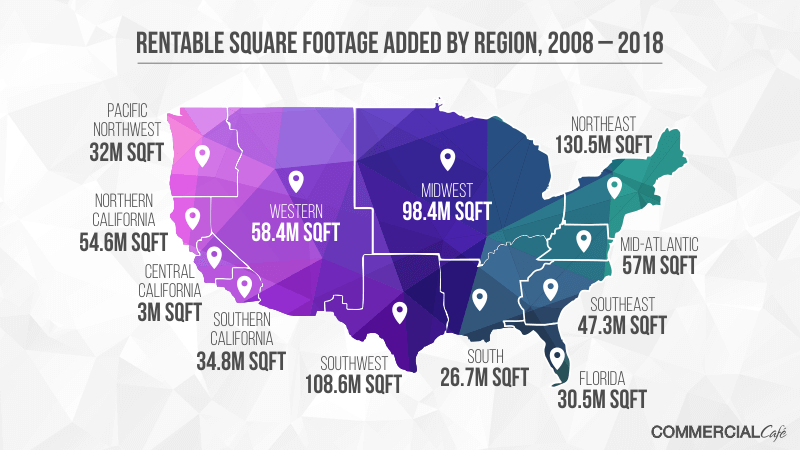
Between 2008 and 2018, the U.S. expanded its office footprint by 682 million square feet, 370 million of which have been added in the top 20 markets. Using data from Yardi Matrix, a recent COMMERCIALCafé study looked closely at where this space was added—urban areas, suburban areas or central business districts (CBDs). The findings highlight regional differences and offer insight into what drives demand in certain areas. To avoid confusion, it is important to note that “urban” does not include the central business district.
Regionally, the Northeast—which includes New York City, Philadelphia, and Boston—added the most office space during the decade, specifically 130.5 million square feet. Urban areas here grew by 16.5%, representing 55 million square feet. In addition, CBDs grew by 5.3%, or 24 million square feet. This is an impressive feat considering how dense these downtowns already are, and it shows that there’s still interest in central locations.
Meanwhile, the Southwest increased its office inventory by more than 108 million square feet. However, in contrast to the Northeast, three-quarters of this added square footage was in suburban locations. This comes as no surprise given the different compositions of the two regions—sprawling suburbs as opposed to dense cities. Similarly, 43 million square feet out of the roughly 58 million added by the Western region was in the suburbs. This includes markets like Denver, Salt Lake City, Las Vegas, and Phoenix.
The tech industry, in particular, is driving the greater suburban expansion in the west. Several “tech corridors”—such as the Platinum Corridor in Dallas and Silicon Slopes in Salt Lake City—have already sprung up. The availability of cheaper land for development, as well as the adoption of office campuses as opposed to office buildings, are fueling this phenomenon.
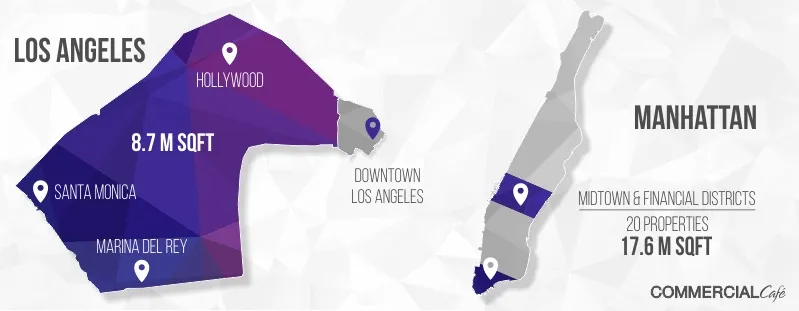
At a market level, Manhattan and Los Angeles both added significant square footage to their CBDs, even though these CBDs didn’t grow by a large margin given their existing inventory. Together, Manhattan’s Midtown and Financial District added 17.6 million square feet across 20 properties. In addition, by the end of 2018, Hudson Yards had completed two buildings—10 Hudson Yards and 55 Hudson Yards—totaling more than 3 million square feet.
On the opposite coast, the Los Angeles CBD grew by 1.2 million square feet across 16 buildings—365,000 square feet of which were added as part of the 1.3 million-square-foot Wilshire Grand Center. Most of this construction occurred down the hill from Grand Avenue. However, it was LA’s primary urban areas that added the most square footage. Encompassing Hollywood, Culver City, Santa Monica, and the Jefferson Corridor in Marina Del Rey, these California areas collectively grew by 10%, or 8.7 million square feet.
San Francisco, on the other hand, added only one new building to its CBD between 2008 and 2018—350 Bush Street. Meanwhile, its primary urban areas around the CBD increased their inventory by roughly 4 million square feet across nine properties. This includes the 1.4 million-square-foot Salesforce Tower. Additionally, secondary urban areas also increased their office inventory by 4.6 million square feet. In fact, the neighborhood of SoMa alone added 26 properties totaling 3.1 million square feet.
Like San Francisco, Pacific Northwest cities Seattle and Portland, grew the most around their respective CBDs. In Seattle, Bellevue together with Lake Union, Denny Triangle, Belltown, and Pioneer Square added 13.9 million square feet in Washington for a 50% increase in 10 years; the expansion of Amazon’s campus contributed to most of this growth. Portland’s primary urban areas, which include the Pearl District, Chinatown and the West End, grew by 24%, or 3.6 million square feet.
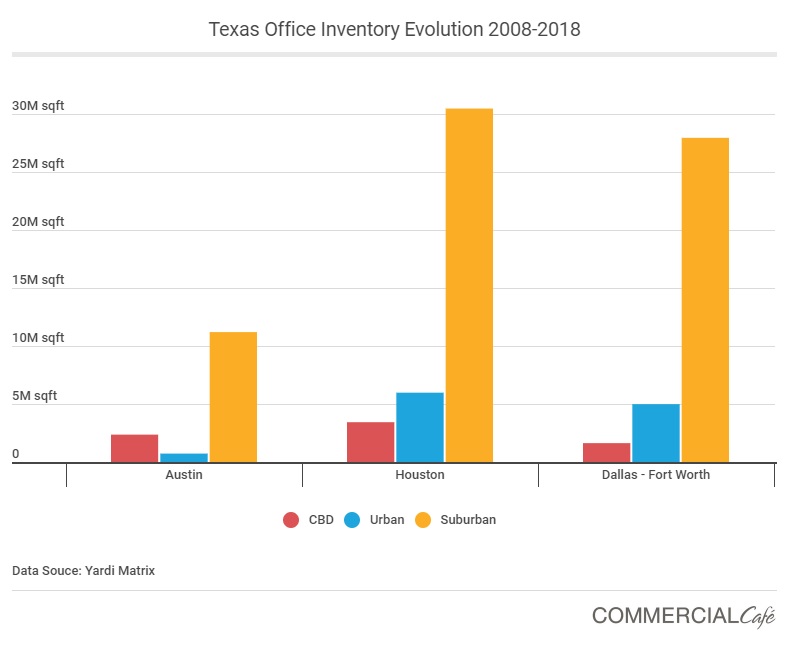
While the Texas markets also saw considerable growth, most of this expansion was localized in certain suburban areas. In Houston, The Woodlands added more than 5.7 million square feet and the Energy Corridor grew by 47 buildings, totaling 12.5 million square feet. In Dallas, the Platinum Corridor, Plano, and Las Colinas collectively added 17.7 million square feet, marking a 19% increase in 10 years. Furthermore, Austin’s suburban market grew by more than 22%, adding 11.2 million square feet across 98 properties.
For this study, COMMERCIALCafé used Yardi Matrix data to compare all office properties completed between January 1, 2008, and December 31, 2018. Only properties of at least 25,000 square feet were included in the study.
Want to stay on top of the real estate market?
Access comprehensive property data and ownership information with intuitive research tools.
POSTED IN: California Real Estate, Los Angeles Real Estate

Alexandra is a staff writer and communications specialist at CommercialCafe, covering commercial real estate trends, news and tips. Her work can also be found on the PropertyShark blog, where she usually writes about the latest office deals. Alexandra’s articles have been featured by Bustle, NBC Washington, Thrive Global, the Boston Business Journal, The Durst Organization, Philly Mag, HR Dive.
Recent Reports

Locked-In Owners, Mobile Renters: Homeowners Stay Put as Renters Move 3.7x More Across Largest U.S. Cities
Renters became the primary drivers of long-distance mobility across the largest U.S. cities, moving 3.7 times more than owners in 2024, as high mortgage rates and housing costs kept many homeowners in place.

$4.6M Hudson Yards Maintains Top Spot, Luxury Sales in Malba Set $2.5M Price Record for Queens
Despite prices declining, Hudson Yards remained the most expensive NYC neighborhood, but TriBeCa’s growth closed the gap to under $400,000, while Malba set a new historic price record for Queens at $2.5 million, securing the highest ranking ever for the borough at #5.
2026 Q1 Foreclosure Report: Brooklyn Filings Fall Sharply, Bronx & Staten Island Hit New Peaks
Behind a deceptively mild citywide downtick, borough foreclosure markets pulled into significantly diverging paths as Brooklyn cases were nearly halved and the Bronx hit a new, record high. Meanwhile, Queens remained unchanged, Staten Island surged back up and Manhattan cooled slowly.