

RELEASED ON February 13, 2020
2019 Annual Foreclosure Report: NYC Foreclosures Dip 6% Y-o-Y, Manhattan Cases Surge 39%
Eliza Theiss | 6 minute read
Key Takeaways: Foreclosure activity increased in just one borough, with Manhattan surging 39%. Y-o-Y NYC foreclosures dipped 6%, while pre-foreclosures slid 7%. Bronx undergoes steepest drop in first-time foreclosures – down 21% Y-o-Y. Queens logs most foreclosures with 1,164 unique cases. Staten Island foreclosures remain relatively flat, yet still 313% above 2014 levels. Brooklyn’s 11236 zip code was 2019’s foreclosure hotspot with 4% of all city-wide cases. Coming off of a year of significant changes for the New York real estate market – from the new rent regulation laws to the new mansion tax – we decided to take an in-depth look at foreclosures in New York City last year. Although Q3 foreclosure activity was stagnate overall, first-time foreclosures in 2019 came in 6% lower than 2018 figures. Meanwhile, as foreclosures trended down year-over-year across the city, Manhattan saw a 39% surge in foreclosure activity. As such, it was the sole borough to post an increase in foreclosures in 2019. Nonetheless, Manhattan still had the lowest total number of foreclosures – 149 unique cases in the entire year; on the other end of the spectrum, Queens had 1,164. Additionally, Staten Island proved to be the steadiest borough for foreclosure activity…
Key Takeaways:
- Foreclosure activity increased in just one borough, with Manhattan surging 39%.
- Y-o-Y NYC foreclosures dipped 6%, while pre-foreclosures slid 7%.
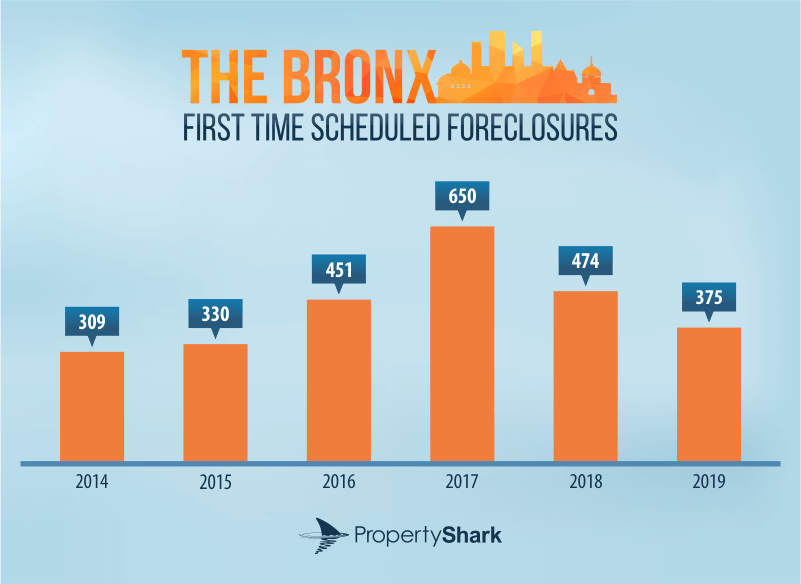
- Bronx undergoes steepest drop in first-time foreclosures – down 21% Y-o-Y.
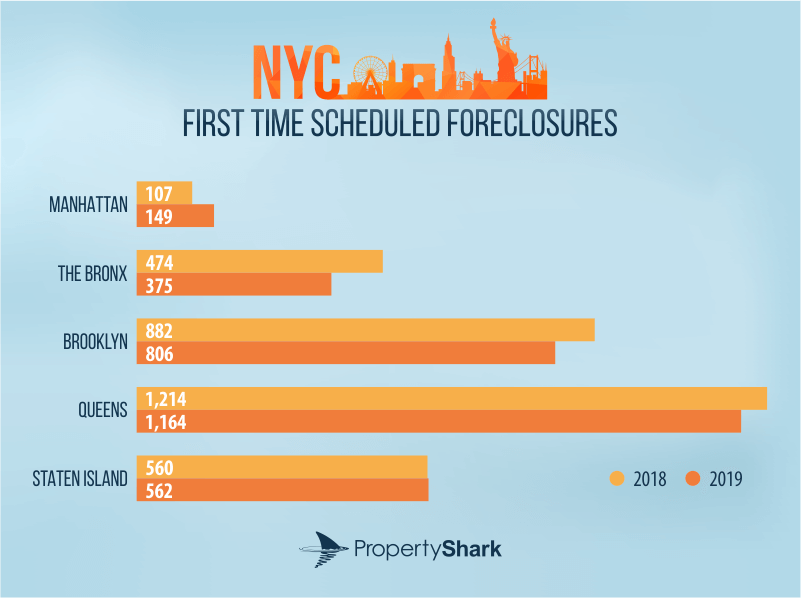
- Queens logs most foreclosures with 1,164 unique cases.
- Staten Island foreclosures remain relatively flat, yet still 313% above 2014 levels.
- Brooklyn’s 11236 zip code was 2019’s foreclosure hotspot with 4% of all city-wide cases.
Coming off of a year of significant changes for the New York real estate market – from the new rent regulation laws to the new mansion tax – we decided to take an in-depth look at foreclosures in New York City last year.
Although Q3 foreclosure activity was stagnate overall, first-time foreclosures in 2019 came in 6% lower than 2018 figures. Meanwhile, as foreclosures trended down year-over-year across the city, Manhattan saw a 39% surge in foreclosure activity. As such, it was the sole borough to post an increase in foreclosures in 2019.
Nonetheless, Manhattan still had the lowest total number of foreclosures – 149 unique cases in the entire year; on the other end of the spectrum, Queens had 1,164. Additionally, Staten Island proved to be the steadiest borough for foreclosure activity in 2019, remaining relatively flat compared to its 2018 figures.
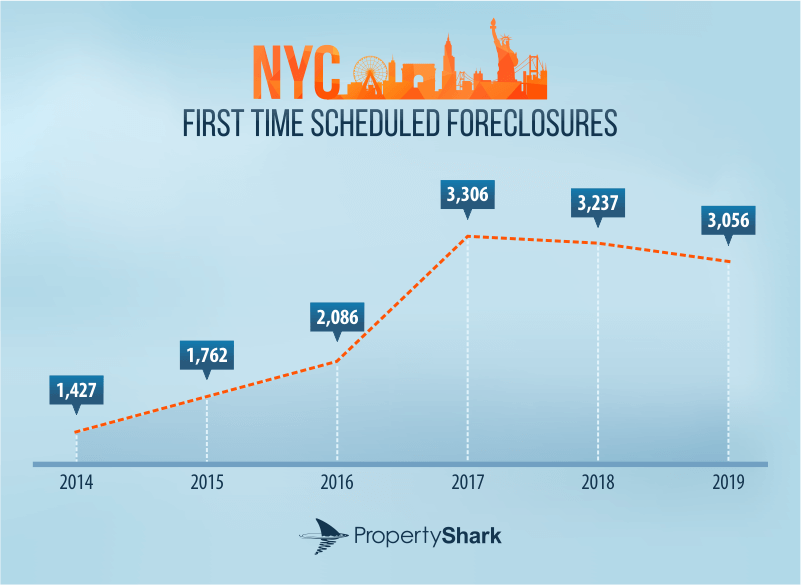
Overall, NYC had a total of 3,056 first-time foreclosure cases in 2019, compared to 2018’s 3,237 – marking the second consecutive year of decreased foreclosure activity in the city. In fact, NYC recorded its lowest foreclosure volume since 2016. However, zooming out to a five-year snapshot of foreclosure trends shows that 2019 still saw more than double the amount of first-time foreclosures (114%) than were recorded in 2014.
Specifically, while unique foreclosures in the Bronx were only 21% above their 2014 levels, first-time foreclosures in Queens doubled in five years, and Brooklyn registered a 187% higher incidence of foreclosures in 2019. Furthermore, Staten Island was in a league of its own, with foreclosure activity 313% higher last year than it was in 2014; there were 562 unique cases here in 2019.
Similar to the trend of foreclosures, pre-foreclosures in NYC also trended downward in 2019; 7% fewer residential lis pendens were filed last year than the year before. In particular, Queens recorded the largest Y-o-Y drop, with 20% fewer pre-foreclosure cases than in 2018. Conversely, Staten Island had 4% more lis pendens in 2019 than it did in 2018.
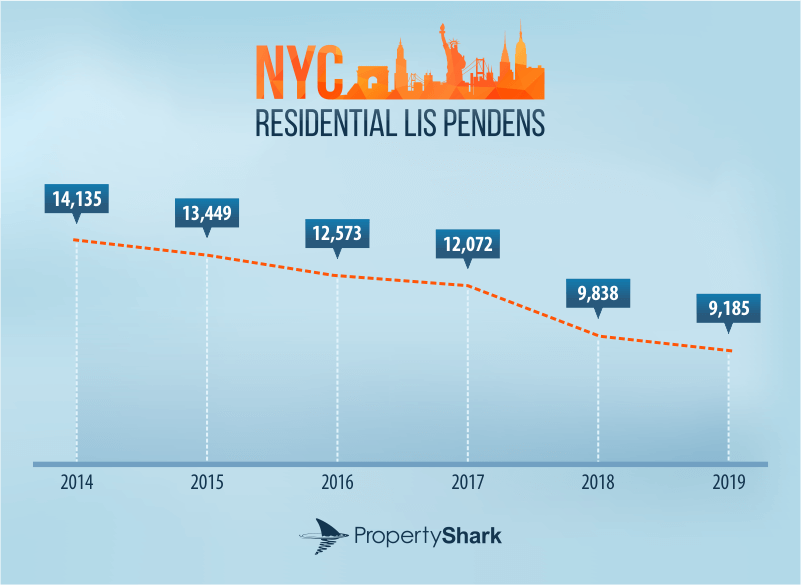
All in all, pre-foreclosure incidences have been trending steadily downward. Moreover, last year marked the lowest volume since at least 2014 – the sixth consecutive year of decreasing activity. In fact, the 9,185 lis pendens filings recorded city-wide in 2019 represented a 35% drop compared to 2014 levels.
Notably, Manhattan – which consistently had the lowest number of lis pendens of any borough in the past six years – saw pre-foreclosures drop by 24%. But, Queens experienced the largest decrease in pre-foreclosure filings, with 45% fewer lis pendens recorded in 2019 than in 2014.
Foreclosure Increase Only in Manhattan, Record 39% Surge
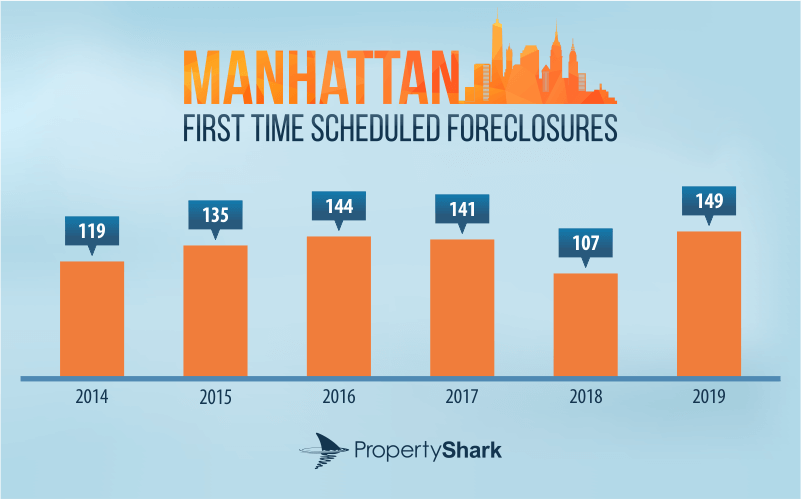
Although foreclosure activity trended downward city-wide, Manhattan stood out among the five boroughs as the only one where the number of first-time foreclosures went up; its total of 149 cases in 2019 was a 39% increase in first-time foreclosures.
It must be noted, however, that the 107 first-time foreclosures recorded in 2018 represented an unusually low figure for Manhattan, which had been averaging 140 foreclosures annually in the previous three years.
The highest concentration of foreclosures in Manhattan last year was recorded in the 10019 zip code. Covering parts of Clinton and Chelsea, 10019 saw 20 first-time foreclosures last year – 13% of the borough’s yearly total.
Even as foreclosure activity was up in Manhattan in 2019, pre-foreclosures were down, coming in 7% below the borough’s 2018 figures – 422 in 2019 compared to 452 in 2018. As a result, Manhattan had the lowest foreclosure and pre-foreclosure counts of the five boroughs, a recurring theme in recent years.
Manhattan also experienced the second-lowest increase in foreclosures during the last five years. Its 2019 total was only 25% higher than the 119 cases recorded in 2014; only the Bronx experienced a slower pace (21%). In the same timeframe, pre-foreclosures decreased by 24% in 2019 when compared to 2014.
Bronx Foreclosures Down 21%, Marking Sharpest Drop in All Five Boroughs
Of all five boroughs, the Bronx experienced the sharpest decrease in first-time foreclosures. In 2019, there were 375 first-time foreclosures here – a 21% drop below 2018 levels. Incidentally, 2019 figures were 21% above 2014 foreclosure figures in Bronx County.
Foreclosure cases were concentrated in the 10469 zip code, encompassing parts of Williamsbridge, Baychester, Woodlawn, Wakefield and Eastchester; 65 foreclosures were logged in this zip code in 2019, for 17% of the borough’s annual volume.
Pre-foreclosures in the Bronx dipped 2% last year for a total of 1,254 residential lis pendens. And, similar to Manhattan, the Bronx marked its sixth consecutive year of decreased pre-foreclosure activity; 2019 incidences were 35% below 2014 figures.
Brooklyn Zip Becomes NYC Foreclosure Hotspot, Recording 4% of All NYC Cases
Brooklyn foreclosures slid 9% last year, recording 806 unique cases, the second-highest volume in the five boroughs. Here, the foreclosure hotspot was in zip 11236 – which covers parts of Canarsie, Flatlands, Marine Park, Mill Basin and Bergen Beach – with 120 first-time foreclosures, accounting for 15% of the borough’s annual volume.
This was also the highest number of foreclosures observed in any NYC zip code in 2019; it represented 4% of all first-time foreclosures reported last year in NYC.
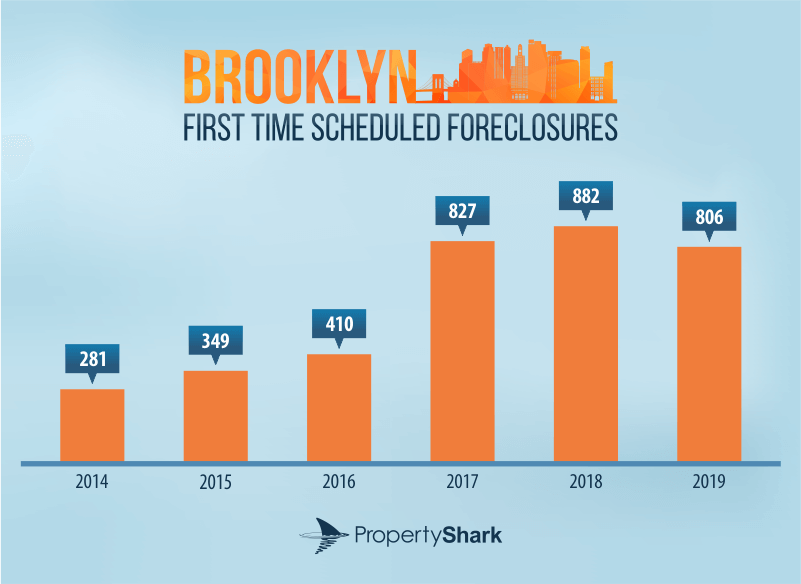
Brooklyn also had the second-highest increase in foreclosures when considering its five-year evolution; last year’s figures were a whopping 187% higher than its 2014 foreclosure cases. Moreover, in the same period, pre-foreclosures decreased at the second-lowest pace in NYC with a drop of only 27%. To top it off, Brooklyn was one of only two boroughs where the number of lis pendens went up Y-o-Y; its 3% uptick resulted in 3,197 pre-foreclosures, the highest figure for any borough.
Pre-Foreclosure Drop Sharpest in Queens, Declining 20% Y-o-Y
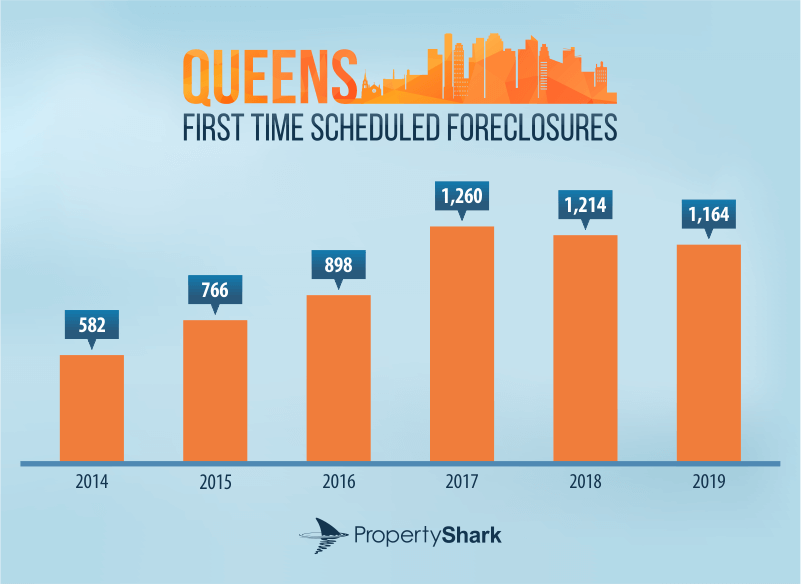
Queens had the most first-time foreclosures recorded in 2019 with 1,164 – the highest number of all five boroughs and double its 2014 levels. That figure represented 38% of all NYC foreclosures last year, despite the fact that the borough saw a 4% Y-o-Y dip in foreclosure activity.
With 96 unique cases – or 8% of the borough’s foreclosure volume – Queens’ foreclosure hotspot was zip code 11434, encompassing areas of Jamaica, South Jamaica, Hollis and St. Albans.
Queens also stood out in pre-foreclosures, recording the sharpest drop in lis pendens filings, which were down 20% Y-o-Y. Compared to 2014 levels, Queens had 45% fewer pre-foreclosures last year.
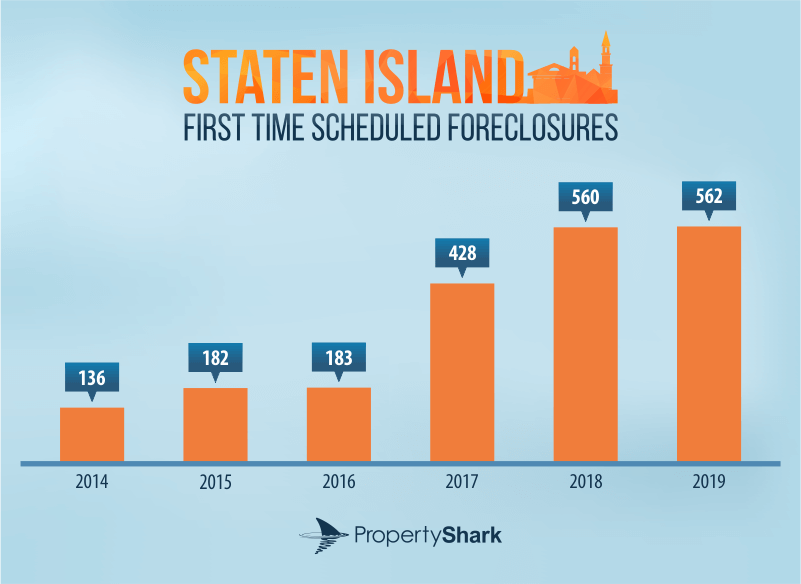
Staten Island Foreclosure Incidences Increase 313% in Five Years
Staten Island proved to be the steadiest market in terms of Y-o-Y changes in first-time foreclosures. Here, the number of cases remained virtually unchanged, with 562 unique cases in 2019 compared to 560 in 2018. Staten Island’s foreclosure hotspot was zip 10314. Located in the neighborhood of Mid-Island, 14% of the borough’s cases – 79 first-time foreclosures – took place in the 10314 area.
While foreclosure levels remained unchanged in the borough, lis pendens filings did increase by 4% Y-o-Y, marking the highest increase in all five boroughs. Even so, last year’s 1,378 pre-foreclosure filings were still 30% below Staten Island’s 2014 levels. On the other hand, first-time foreclosure incidences were a jaw-dropping 313% higher than in 2014, the most extreme difference across all boroughs.
Methodology
Having tracked foreclosure listings for more than a decade, PropertyShark is the only service in New York that guarantees 100% coverage of the local foreclosure market. Because auctions are frequently postponed and/or rescheduled, the statistics referenced in this report include only first-time foreclosures to avoid over-reporting the number of distressed properties in the city.
We report separately on lis pendens (pre-foreclosure) filings – legal notices that mark the beginning of the foreclosure process.
This report focuses exclusively on residential properties (single- and two-family homes, condos and co-op units) that were scheduled for auction for the first time in 2019.
Pre-foreclosure data refers to unique properties that had at least one lis pendens filing in 2019, which may be a first-time filing or a re-filing. The same building class restrictions apply, excluding co-ops. If more than three units were referenced on the same lis pendens filing, they were excluded in order to avoid accounting for entire buildings.
Access Every New York Foreclosure — First.
Get full access to NYC foreclosures, pre-foreclosures, REOs & auctions. Updated daily with lien & owner data. 100% coverage.
POSTED IN: Brooklyn Foreclosures, Manhattan Foreclosures

Eliza Theiss is a senior writer reporting real estate trends in the US. Her work has been cited by CBS News, Curbed, The Los Angeles Times, and Forbes among others. With an academic background in journalism, Eliza has been covering real estate since 2012. Before joining PropertyShark, Eliza was an associate editor at Multi-Housing News and Commercial Property Executive. She has also contributed extensively to CommercialEdge. Reach her at [email protected]
Recent Reports

NYC Resale Gains & Losses: Every Borough Made Money in 2025, Except Manhattan
In 2025, NYC home-sellers mostly made money. But, in Manhattan, resales came with losses — and it was apartments and recent buyers that absorbed them.

World Cup or Your Mortgage/Rent? Ticket Prices Rival Host City Housing Costs
World Cup ticket prices rival monthly housing expenses in the 11 U.S. host cities, with even the cheapest seats covering weeks or even months of rent or mortgage payments.

Locked-In Owners, Mobile Renters: Homeowners Stay Put as Renters Move 3.7x More Across Largest U.S. Cities
Renters became the primary drivers of long-distance mobility across the largest U.S. cities, moving 3.7 times more than owners in 2024, as high mortgage rates and housing costs kept many homeowners in place.