

Brooklyn Real Estate | RELEASED ON April 24, 2025
Top 50 Most Expensive NYC Neighborhoods Q1 2025: Prices Rise in 32 Neighborhoods, Little Italy Grabs #2 With $4.6M
Eliza Theiss | 9 minute read
NYC's strong +10% Y-o-Y start was also reflected among the city's 50 most expensive neighborhoods, most of which saw both prices and sales rise.
Key Takeaways:
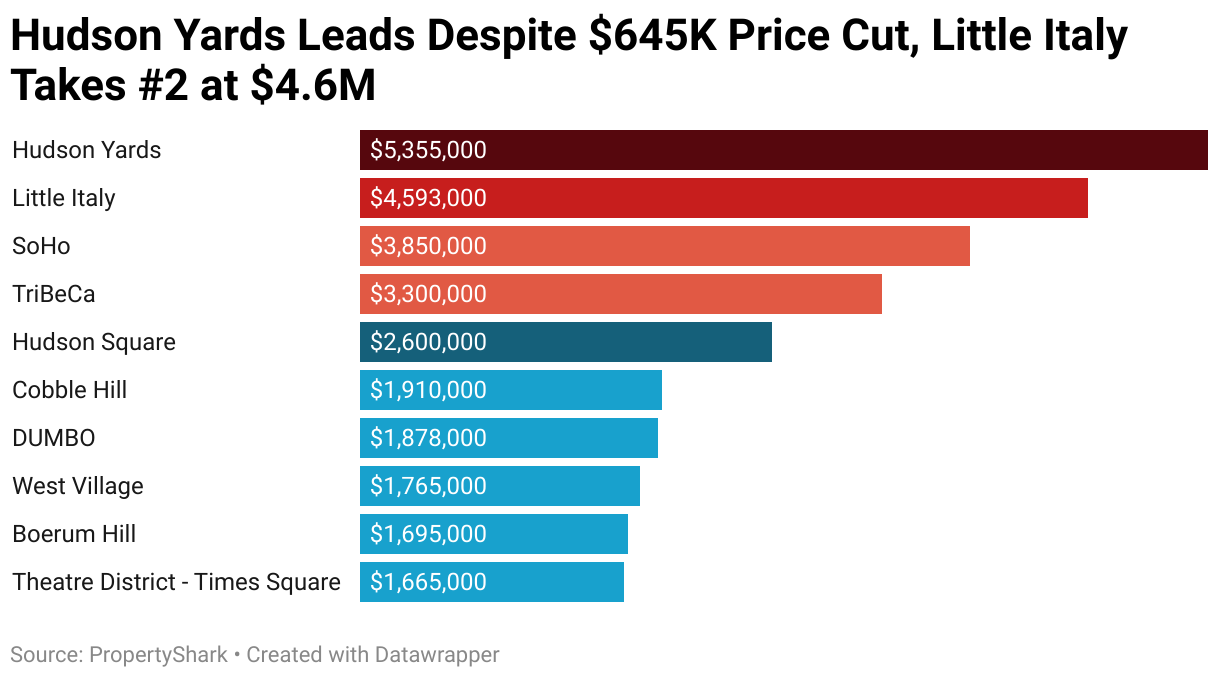
- $5.4M Hudson Yards remains #1 most expensive NYC neighborhood, even as home prices dip 11% amid sales surge
- After three-quarter absence, Little Italy takes #2 spot with $4.6M median sale price
- $1.55M Malba just $115,000 short of grabbing top 10 spot for Queens
- 145% median sale price surge pushes Brooklyn’s Madison from #104 to #25
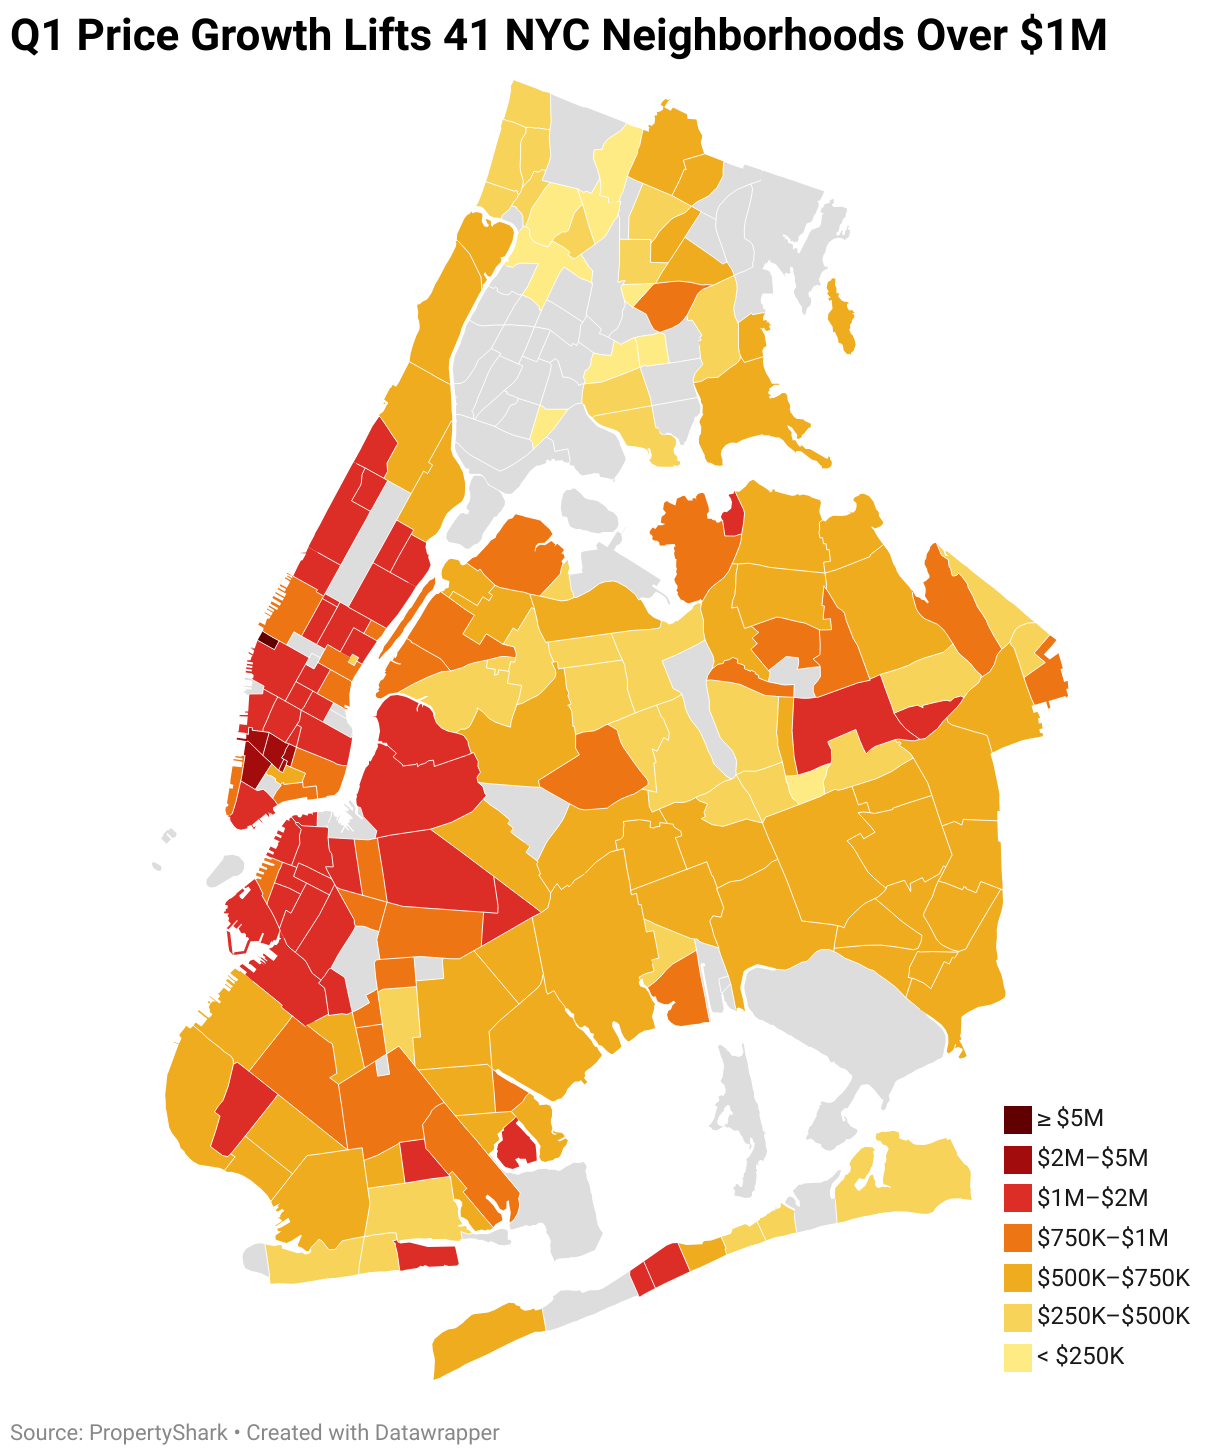
- 41 neighborhoods — 10 more than last year — surpass $1M median sale price
- 32 neighborhoods record price gains, while sales heat up in 30
- With 22 neighborhoods ranked, Brooklyn takes slight lead over Manhattan’s 20
- 15% Y-o-Y gain leads to $1.15M Manhattan median sale price
- Up 10% Y-o-Y, NYC median sale price rises to $768,000 across 7,154 transactions
The New York City real estate market started the new year strong, closing the first quarter of 2025 with a median sale price of $768,000 — up 10% year-over-year (Y-o-Y). This was paired with a 10% Y-o-Y increase in the number of new and existing sales, with 7,154 transactions of condos, co-ops and single family homes in the first three months of the year. Much of this growth was driven by Manhattan, where sales jumped 18% Y-o-Y and the median sale price rose 15% Y-o-Y to $1.15 million.
Focusing on the city’s 50 most expensive neighborhoods, 53 neighborhoods were included in the ranking in the first quarter of 2025 due to three pricing ties. Brooklyn took a slight lead, placing 22 neighborhoods among the city’s priciest, while Manhattan ranked 20, including the five most expensive.
As always, Queens came in third, represented by 11 neighborhoods. Notably, Queens just missed the top 10 with Malba’s $1.55 million median sale price just $115,000 shy of the Theatre District-Times Square area at #10. Queens also supplied the city’s #50 most expensive neighborhood: Auburndale’s $900,000 median sale price was 13% higher than the $795,000 median sale price that placed Bushwick at #50 back in Q1 2024.
Notably, 41 of the city’s most exclusive neighborhoods surpassed $1 million, which is 10 more than in Q1 2024. Of these, five neighborhoods reached median sale prices comfortably above $2.5 million.
Explore the interactive map below for at-a-glance price and sales insights for NYC’s neighborhoods in Q1 2025:
Top 10 Most Expensive NYC Neighborhoods
Manhattan Dominates Top 10 Priciest Neighborhoods, 5 Locations Surpass $2.5M
The city’s growing sales and price trends were also reflected among NYC’s top 10 most expensive zip codes, six of which saw their medians rise by as much as 61% Y-o-Y. At the same time, sales accelerated in seven of the city’s leading 10 neighborhoods, led by Hudson Yards.
Specifically, Hudson Yards sales surged a whopping 160% Y-o-Y to claim the second-sharpest increase in sales among the city’s 50 most expensive neighborhoods. However, in terms of actual sales, that translated to an increase of just eight transactions.
This acceleration was accompanied by an 11% Y-o-Y decrease in the neighborhood’s median sale price that translated to a $645,000 price cut. Nevertheless, Hudson Yards remained the #1 most expensive NYC neighborhood at $5.36 million, comfortably ahead of any competition.
In fact, the city’s second-priciest neighborhood was $762,000 behind Hudson Yards: Little Italy took #2 with a $4.59 million median. Six of the seven condos sold here at the start of the year were pricey NoLiTa units (which we include within the boundaries of Little Italy due to the neighborhood’s small size). Among them was a nearly 3,700-square-foot unit at The Residences at Prince which sold for $8 million and a nearly 3,200-square-foot unit at the Puck Building that traded for $7.85 million.
Often absent due to low sales activity, Little Italy last appeared in our top 50 in Q2 2024 with a $2.4 million median sale price. However, in the 2010s, Little Italy often ranked among the city’s top three most expensive neighborhoods.
SoHo was the #3 most expensive NYC neighborhood despite a 9% Y-o-Y price increase after losing one spot to Little Italy’s dizzying pricing. SoHo’s increase brought it to a $3.85 million median sale price while sales grew by one quarter. Similarly, transactional activity heated up 23% Y-o-Y in TriBeCa — now the #4 most expensive NYC neighborhood at $3.3 million.
Hudson Square rose to #5 with a $2.6 million median sale price, the result of a 61% Y-o-Y price increase — one of the sharpest among NYC’s 50 richest neighborhoods. Here, the million-dollar price jump was influenced by a change in the property types sold. Essentially, there was only one co-op sale (worth $1.27 million) among the neighborhood’s 13 transactions in Q1 2025, as compared to four out of seven sales being co-op units last year.
Hudson Square also had one of the sharpest increase in sales among the city’s most exclusive neighborhoods. Yet, like Hudson Yards, Hudson Square’s 86% Y-o-Y jump in sales actually translated to just six additional transactions, two of which were signed at the exclusive Spice Warehouse at 481 Washington St.
The next two spots were claimed by Brooklyn as rising prices placed Cobble Hill at #6 and DUMBO at #7. More precisely, a 22% Y-o-Y increase lifted Cobble Hill’s median sale price to $1.91 million. Meanwhile, DUMBO held on at #7 with $1.88 million thanks to a 7% Y-o-Y price gain, although the number of sales dropped by more than one third here.
The West Village stood at #8 after its median sale price jumped 36% Y-o-Y to reach $1.77 million. West Village sales rose 12% Y-o-Y, whereas over in Boerum Hill, transactional activity increased 15% Y-o-Y. At the same time, the $1.7 million Boerum Hill slid to #9, pushed down by the strong price gains of neighborhoods like the West Village and Cobble Hill.
Manhattan closed out the list of NYC’s 10 most expensive neighborhoods as the Theatre District-Times Square area took #10 with a $1.67 million median sale price after a 37% Y-o-Y hike. Even though the number of sales here contracted 22% Y-o-Y, the Theatre District-Times Square area still had 45 unique transactions, the same as Hudson Yards, Little Italy and SoHo combined.
Notable Top 10 Absences
+30% Price Cuts Take Some Neighborhoods Out of Top 10
It’s worth noting that some traditionally top-10 neighborhoods were conspicuously absent as prices dropped by significant margins, including in Carroll Gardens, where the median sale price was halved.
Meanwhile, the Flatiron District and Chelsea fell from their year-ago #5 and #6 spots tie at #19 with a $1.38 million median sale price. In both neighborhoods, prices dropped by more than 30% due to changing property mixes: In the Flatiron District, co-ops made up a higher percentage of sales, while in Chelsea, smaller units accounted for a larger share of sales than in early 2024.
Likewise, Battery Park City (#43) and Central Midtown (#32) also fell in rankings as prices were cut by nearly one-third. In fact, Central Midtown stayed just above $1 million, while Battery Park City actually slid below.
Most Expensive Brooklyn Neighborhoods
Brooklyn Ranks 22 Neighborhoods Among City’s Most Expensive, Takes Slight Lead Over Manhattan
After outranking Manhattan in Q3 2024 for the first time in nearly three years, Brooklyn yet again took the lead in Q1 2025 by placing 22 neighborhoods among the city’s priciest compared to Manhattan’s 20. However, Brooklyn only claimed three of NYC’s 10 most exclusive neighborhoods with $1.91 million Cobble Hill in the lead at #6.
Carroll Gardens — traditionally one of Brooklyn’s most expensive neighborhoods — was conspicuously absent from top 10 rankings at the start of the year. Claiming #4 with a $2.79 million median sale price in Q1 2024, Carroll Gardens’ median sale price was halved to just $1.38 million. Moreover, while the number of sales actually ticked up 11% Y-o-Y, the average size of Carroll Gardens homes sold at the start of this year fell to just 1,035 square feet, more than 600 square feet smaller than one year ago.
At the other end of the spectrum, Brooklyn was also home to three of the sharpest price jumps among the city’s priciest neighborhoods. Among these was the whopping 145% price surge in Madison that lifted the neighborhood from last year’s #104 to its current spot at #25. This came as Madison went from $510,000 a year ago to the current $1.25 million median sale price due to a significant shift in its sold-property mix.
Specifically, of the 15 transactions recorded in the first quarter of this year, 11 were houses and only one was a co-op unit, while in Q1 2024, co-ops accounted for nearly half of all Madison sales. Moreover, houses accounted for about 75% of sales this year — and the least expensive went for $585,000, well above last year’s median.
Mill Basin’s 62% Y-o-Y jump was the second-sharpest among NYC’s most expensive neighborhoods, lifting the area to $1.43 million from the year-ago $878,000. This surge was fueled by a more exclusive mix of properties trading. To be precise, five of the six Mill Basin homes sold in Q1 2025 changed hands for more than $1 million, as opposed to just three of the eight homes sold back in Q1 2024.
At the same time, Bedford-Stuyvesant’s 38% Y-o-Y price jump was influenced by similar trends: Although the number of condos sold remained virtually unchanged, their prices were noticeably higher. So, while Bed-Stuy condos sold at a median $780,000 at the start of 2024, prices jumped to just over $1 million in the first quarter of this year — driven in part by units being 20% larger on average.
Brooklyn also missed out on another potential top 10 ranking with Williamsburg, which shared #11 with Queens’ Malba at a $1.55 million median sale price.
Greenpoint (#12) and Greenwood Heights (#14) were Brooklyn’s next-priciest neighborhoods in the first quarter, but both also saw strong sales activity. Greenwood Heights logged the sharpest jump among NYC’s 50 richest neighborhoods with a 167% Y-o-Y surge. This was driven by sales at two recently completed condo developments: 194 30th St. and at 265 20th St.
Conversely, Greenpoint stood out with a significant deceleration in sales activity. Namely, its 38% Y-o-Y drop in sales was due, in part, to fewer transactions at 29 Huron St. — seven sales in Q1 2025 versus the year-ago 24. Furthermore, the lack of sales at 47 Diamond St. and 12 Broome St. were also contributing factors, considering each development contributed six transactions back in Q1 2024.
Most Expensive Queens Neighborhoods
Queens Misses Top 10 Ranking with Malba by Just $115K
Queens prices grew at a more sluggish pace of 6% Y-o-Y to close the first quarter of the year at $581,000. Even as sales grew 18% Y-o-Y in Manhattan and 17% Y-o-Y in the Bronx, Queens closed just 8% more deals.
Among Queens’ most exclusive neighborhoods, Malba reigned supreme with a $1.55 million median sale price to tie for #11 with Williamsburg. In fact, Malba was only $115,000 short of securing a top 10 spot for Queens. Neponsit was the next-most expensive Queens neighborhood, landing at #24 with $1.27 million — one of just five Queens neighborhoods north of $1 million.
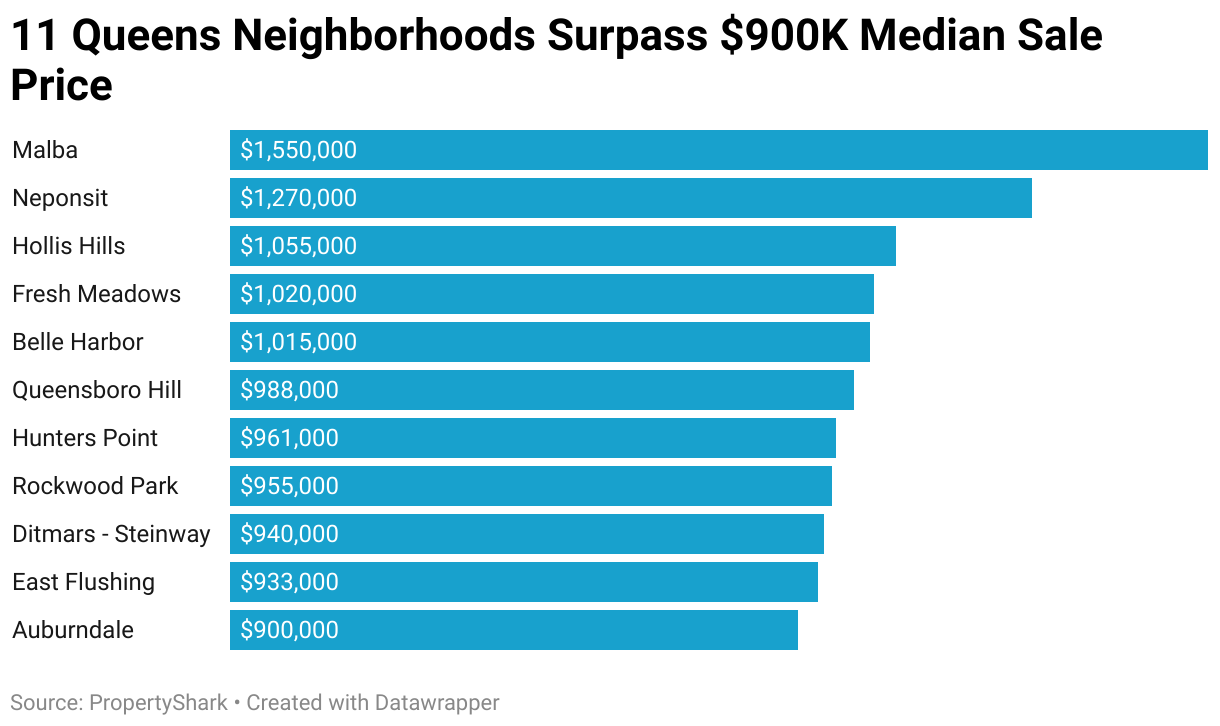
Both Malba and Neponsit were absent from Q1 2024 rankings due to insufficient sales and only had five sales each in Q1 2025. Other Queens neighborhoods also had low levels of transactional activity: Only seven deals were inked in Belle Harbor (#37) and just nine each Queensboro Hill (#41) and Rockwood Park (#45).
Queensboro Hill’s nine deals were the result of an 80% Y-o-Y increase in sales — one of the sharpest among the city’s 50 priciest neighborhoods. But Rockwood Park’s low deal count was due to a 59% Y-o-Y drop — the sharpest slowdown among NYC’s most expensive neighborhoods.
Meanwhile, Hunters Point transactions fell 47% Y-o-Y for the second sharpest drop, as sales dwindled and dried up at a number of new developments. For example, there were no new deals inked at The Alchemy or 5-15 47 Road at the start of this year, as opposed to the nearly 30 sales they generated in Q1 2024. Plus, there were only five new transactions at 2315 44th Drive, down from 25 sales a year ago.
Conversely, East Flushing’s 51% Y-o-Y price jump was among the most drastic, lifting the neighborhood from last year’s #83 to its current position at #47 with a $933,000 median sale price. This was fueled by an increase in the number of houses sold in the neighborhood as well as their higher price points — the lowest-priced home in Q1 2025 changed hands for $798,000.
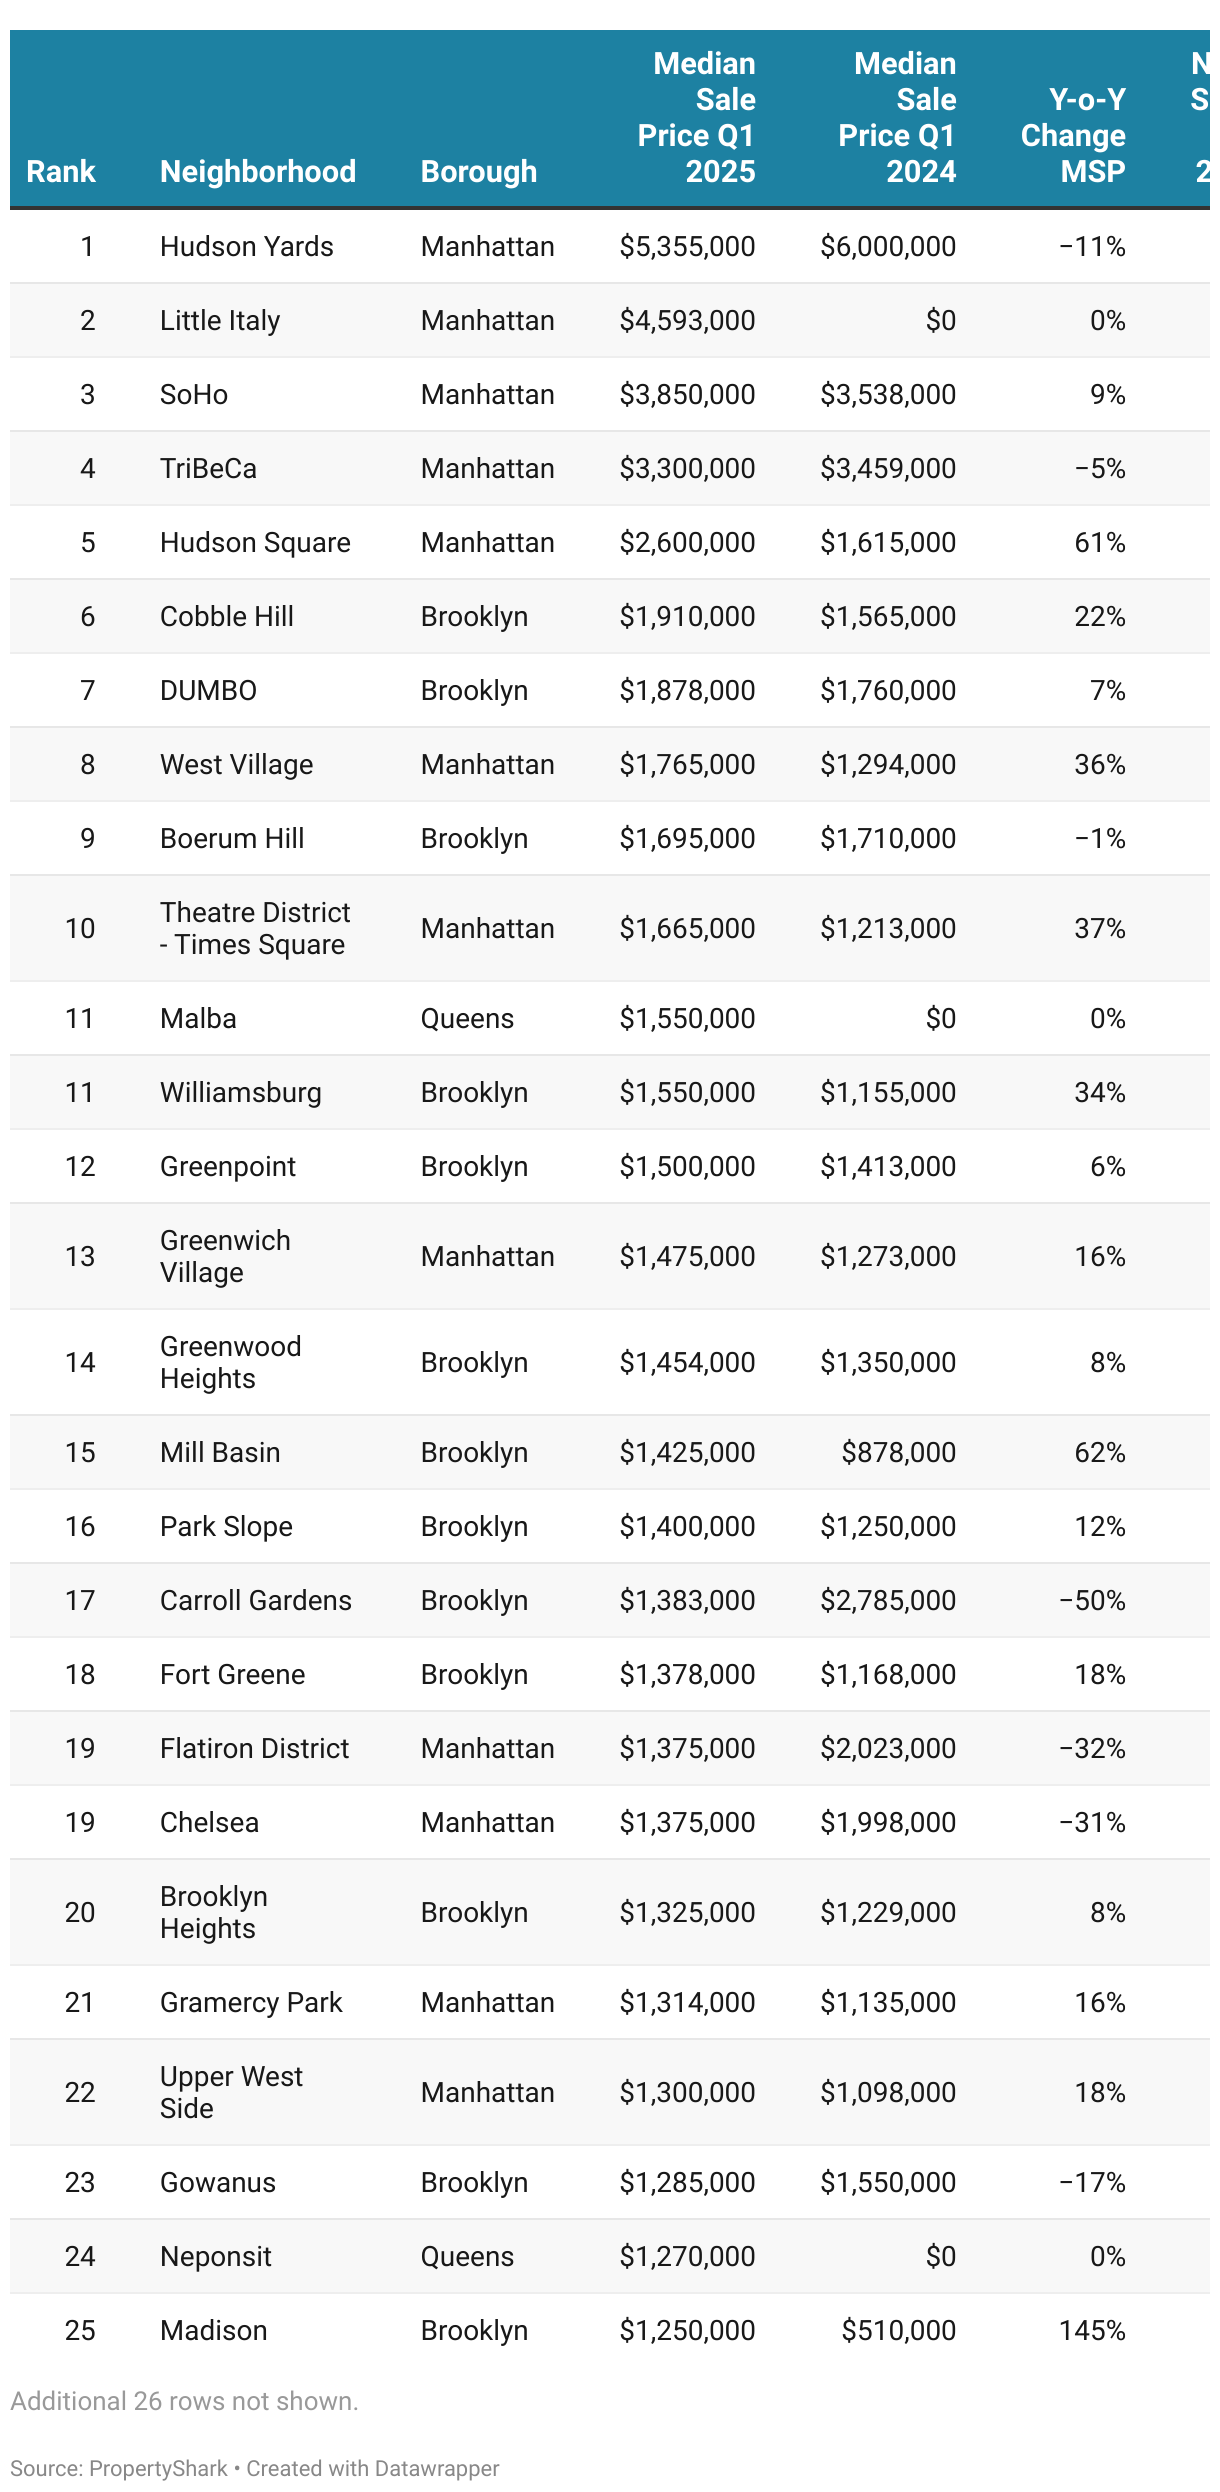
For more information, explore New York City’s 50 most expensive neighborhoods in Q1 2025 in the interactive table below:
Top 50 Most Expensive NYC Neighborhoods in Q1 2025
Methodology
Methodology
Median sale prices were calculated based on closed residential property sales recorded in ACRIS between January 1 and March 31, 2024, and January 1 and March 31, 2025. Residential asset types included were single family homes, condos and co-ops. Package deals were excluded.
Median sale prices were calculated only for neighborhoods that recorded at least five sales between January 1 and March 31, 2025. Year-over-year changes in median sale prices or the number of sales were calculated only for neighborhoods that also recorded a minimum of five sales between January 1 and March 31, 2024. Additionally, median sale prices were rounded to the nearest $1,000.
In this report, NYC is defined as the four boroughs of Brooklyn, the Bronx, Manhattan and Queens. Staten Island was excluded.
Fair Use & Redistribution
We encourage and freely grant permission to reuse and repost information, analysis, charts, tables and images included on this page. When doing so, we only ask that you link back to this page or PropertyShark.com as the official source.
About PropertyShark
PropertyShark is an online real estate database and property research tool that provides building details, ownership information, comparable sales, and foreclosure data. Founded in 2003, PropertyShark serves real estate professionals and consumers in New York and other major U.S. markets.
Want to stay on top of the real estate market?
Access comprehensive property data and ownership information with intuitive research tools.
POSTED IN: Brooklyn Real Estate, Manhattan Real Estate

Eliza Theiss is a senior writer reporting real estate trends in the US. Her work has been cited by CBS News, Curbed, The Los Angeles Times, and Forbes among others. With an academic background in journalism, Eliza has been covering real estate since 2012. Before joining PropertyShark, Eliza was an associate editor at Multi-Housing News and Commercial Property Executive. She has also contributed extensively to CommercialEdge. Reach her at [email protected]
Recent Reports

World Cup or Your Mortgage/Rent? Ticket Prices Rival Host City Housing Costs
World Cup ticket prices rival monthly housing expenses in the 11 U.S. host cities, with even the cheapest seats covering weeks or even months of rent or mortgage payments.

Locked-In Owners, Mobile Renters: Homeowners Stay Put as Renters Move 3.7x More Across Largest U.S. Cities
Renters became the primary drivers of long-distance mobility across the largest U.S. cities, moving 3.7 times more than owners in 2024, as high mortgage rates and housing costs kept many homeowners in place.

$4.6M Hudson Yards Maintains Top Spot, Luxury Sales in Malba Set $2.5M Price Record for Queens
Despite prices declining, Hudson Yards remained the most expensive NYC neighborhood, but TriBeCa’s growth closed the gap to under $400,000, while Malba set a new historic price record for Queens at $2.5 million, securing the highest ranking ever for the borough at #5.