

Metro New York Foreclosure Report
NYC & New Jersey Foreclosure Cases Rise in Q2 Even as Suburban New York Cools
RELEASED ON July 9, 2025 | 7 minute read
Even as foreclosure filings reach a two-year high, regional trends diverge across metro New York.
Key Takeaways:
- Foreclosures inch up 6% Y-o-Y in metro New York to total 1,718 first-time filings
- Cases jump nearly one-quarter across New Jersey markets, reaching two-year high
- New York markets decline 5% Y-o-Y, fueled by Hudson Valley & Long Island contractions
- NYC foreclosures rise 11% despite significant drop in Queens filings
- Brooklyn overtakes Queens as NYC’s most active foreclosure market
- Bronx activity hits new high, surpasses previous quarter’s five-year peak
- Two-family homes drive foreclosure increase in NYC with 25% more filings
- NYC commercial filings up 85%, driven by small multifamily and mixed-use foreclosures in Brooklyn
- Nassau County is most active foreclosure market with 173 new filings
- Somerset County logs sharpest jump in cases at 54% Y-o-Y, Suffolk County claims most drastic drop at -43% Y-o-Y
After more than a decade of tracking the New York City foreclosure market, we have expanded our coverage to include foreclosures and distressed properties across the 24-county New York metro area. This report specifically covers NYC, Long Island, the Lower and Mid-Hudson valleys, as well as Central and North Jersey.
Metro foreclosures
New Jersey Heats Up 23% as Mixed Trends Cool New York Markets by 5%
Metro New York’s foreclosure sector marked the strongest quarter in nearly two years after logging 1,718 first-time filings between April and June. Here, a 6% metro-wide increase in cases made this the most active period for first-time foreclosures since Q3 2023, although trends were mixed across the region.
The increase in foreclosures was fueled by NYC’s 11% year-over-year (Y-o-Y) rise and the 23% Y-o-Y surge in cases observed across North and Central New Jersey counties. To that end, 10 of the 12 Jersey markets saw foreclosures rise by as much as 54% Y-o-Y, led by Somerset County.
Meanwhile, foreclosures slowed across the Lower and Mid-Hudson Valley (-11% Y-o-Y) with Long Island filings also down (-18% Y-o-Y). Notably, Long Island’s decline was the result of a 43% Y-o-Y drop in Suffolk County filings, marking the metro’s sharpest drop in first-time foreclosures.
New Jersey’s surge in foreclosure activity also paired up with the sharp slowdowns of some New York counties to significantly narrow the caseload gap between the metro’s two regions: Its New Jersey counties totaled 804 first-time filings in Q2, approaching the 914 cases recorded across its New York counties. By comparison, in Q1, the metro’s New Jersey markets claimed 300 fewer foreclosures than its New York markets.
NYC Foreclosures
Leading With 1 Case, Brooklyn Takes Over as NYC’s Most Active Market
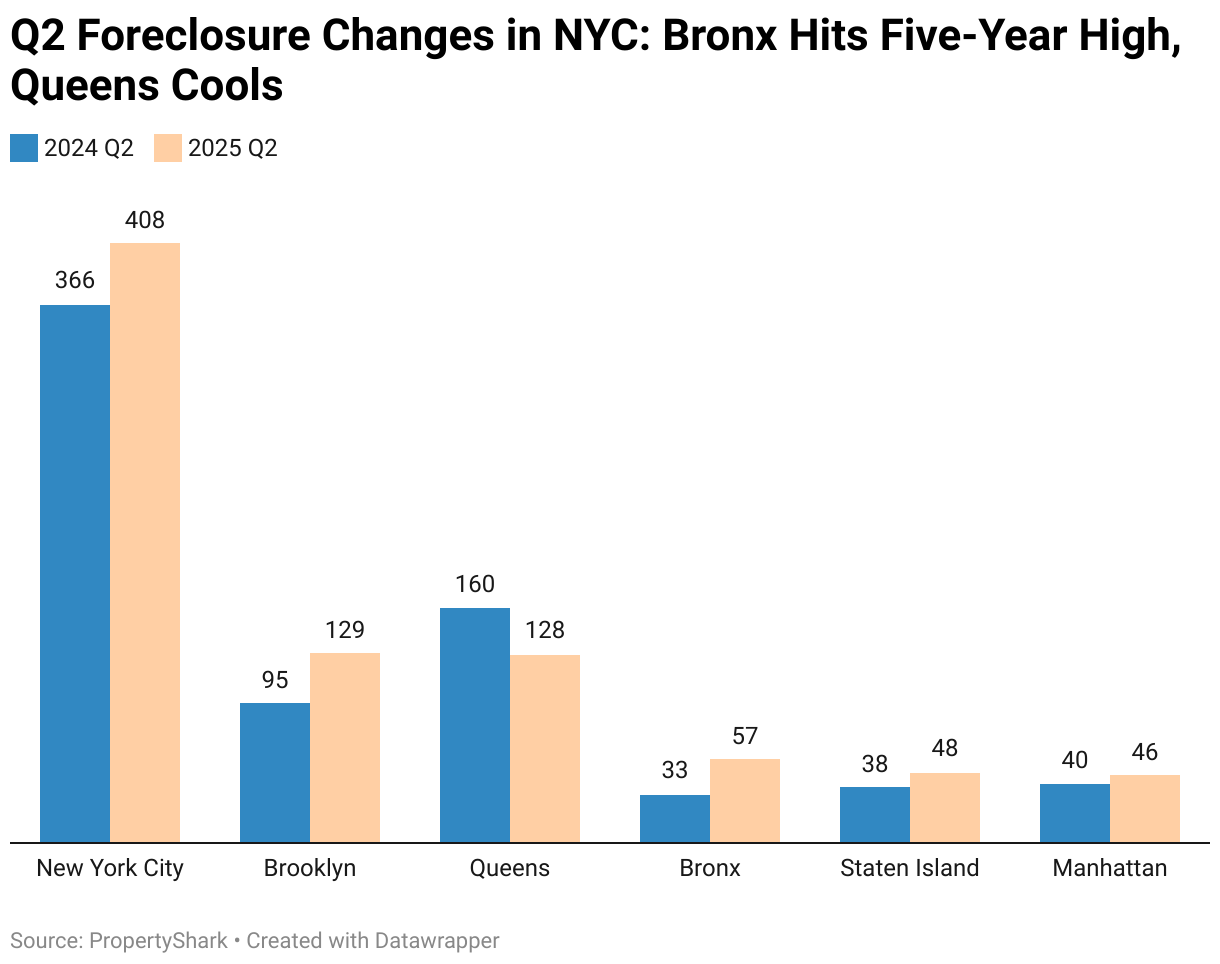
While foreclosures in Long Island and the Lower and Mid-Hudson valleys trended down overall, NYC filings rose. Specifically, NYC saw 191 first-time foreclosures in Q2, 11% more than during the same period last year. This came despite the slowdown of Queens, its most active market.
Specifically, Q2 saw 128 first-time filings in Queens, which was 20% fewer than during the same period last year. Nearby, Brooklyn filings rose by more than one-third to surpass Queens by just one foreclosure. This marked the first time since Q4 2023 that Brooklyn overtook Queens to become NYC’s most active foreclosure market.
The two boroughs’ reversal in positions was also reflected in their respective foreclosure hotspots: Brooklyn now has the city’s top foreclosure hotspot, with zip code 11236 (covering Canarsie and East Flatbush) recording 17 new cases. By comparison, Queens’ foreclosure hotspot, zip code 11412 in Saint Albans, saw 11 cases.
Meanwhile, the most active area in the Bronx — zip code 10473 covering Castle Hill, Clason Point, Soundview, and Unionport — had 15 new filings, outpacing Queens’ hotspot. Overall, Bronx foreclosures jumped 73% year-over-year. Moreover, with 57 first-time filings in Q2, the Bronx surpassed its five-year foreclosure peak that it reached in the previous quarter.
Manhattan foreclosures also inched up, but at a modest 15% Y-o-Y to total 46 new cases as it remained the city’s slowest market. Of these, eight cases were concentrated in zip 10022, which covers parts of Sutton Place, Central Midtown and Turtle Bay.
Even Staten Island’s foreclosure activity surpassed Manhattan’s by closing Q2 with 48 first-time filings — one-quarter more than in Q2 2024. As is often the case, Mid-Island’s 10314 was the borough’s foreclosure hotspot with nine new filings.
NYC asset types
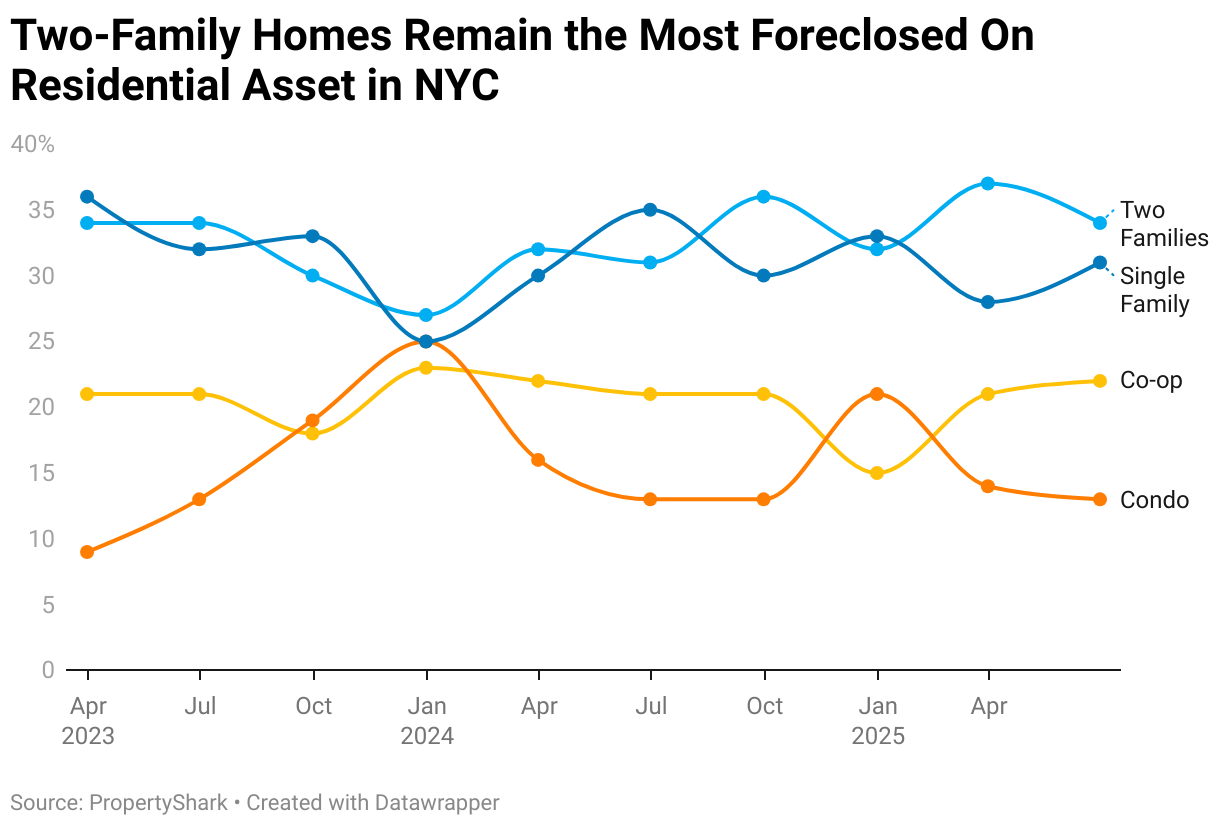
2-Family Homes Continue to Drive NYC Foreclosures
Similar to the start of the year, two-family homes again drove the city’s foreclosure activity by accounting for one-third of new cases. What’s more, two-family foreclosures also saw the sharpest increase in filings after rising 25% compared to year-ago figures. Although co-op and condo foreclosures also rose (albeit at more modest rates), single family filings declined by a negligible 2% Y-o-Y.
NYC commercial
Brooklyn Remains City’s Commercial Foreclosure Hotspot With 83% of Cases
New York City’s commercial foreclosure sector ended its year-long cool-off with incidences jumping 85% Y-o-Y to 24 new filings in Q2 — the highest since early 2024. As usual, Brooklyn accounted for the majority of new cases. Notably, though, there were no office or retail assets among the borough’s 20 new filings, only small multifamily or mixed-use properties.
Of these, the highest lien — just $15,000 shy of $7 million — was attached to an 8,000-square-foot, six-family home in Park Slope that sold for $1.08 million in early May.
Top 5 Most Expensive Commercial Foreclosures Sold in Q2 2025
| Rank | Borough | Address | Lien Ammount | Sale Date | Sale Amount | Auction Date | REO |
|---|---|---|---|---|---|---|---|
| 1 | Brooklyn | 121 8th Ave. | $6,985,285 | 5/6/2025 | $10,000 | 4/3/2025 | Yes |
| 2 | Brooklyn | 1408 Bushwick Ave. | $3,511,947 | 6/5/2025 | $4,800,000 | 4/3/2025 | Yes |
| 3 | Brooklyn | 53 Madison St. | $1,942,288 | 5/28/2025 | $500 | 4/10/2025 | No |
| 4 | Brooklyn | 1152 Lenox Rd. | $1,083,014 | 5/19/2025 | $1,802,938 | 4/17/2025 | No |
| 5 | Brooklyn | 1279 Herkimer St. | $998,691 | 6/9/2025 | $1,830,000 | 5/15/2025 | Yes |
Looking ahead to the most expensive foreclosures headed for auction in Q3, a two-building office asset is set to hit the block in mid-July with a $36 million lien. It comprises two pre-war office buildings at 6 and 8 W. 28th St. in NoMad. The four-story buildings comprise just more than 18,000 square feet of commercial space that’s mainly office but also includes some retail.
Top 5 Most Expensive Commercial Foreclosures Scheduled for Auction in Q3 2025
| Rank | Borough | Address | Lien Ammount | Occurrence | Auction Date |
|---|---|---|---|---|---|
| 1 | Manhattan | 6 W 28th St. | $36,434,326 | first-time | 7/16/2025 |
| 8 W 28th St. | |||||
| 2 | Manhattan | 305 E 51st St #RET1 | $29,913,652 | first-time | 7/23/2025 |
| 305 E 51st St #GAR | |||||
| 3 | Manhattan | 11 E Broadway #1A | $23,303,940 | first-time | 7/16/2025 |
| 11 E Broadway #2A | |||||
| 11 E Broadway #3A | |||||
| 4 | Manhattan | 123 Lafayette St. | $21,759,121 | first-time | 7/30/2025 |
| 5 | Manhattan | 34 W 21st St. | $8,820,122 | first-time | 8/6/2025 |
New York markets
Foreclosures in the Hudson Valley & Long Island Cool
While foreclosure activity picked up significantly in the metro’s New Jersey markets, its New York markets presented a more complex picture. Accordingly, while foreclosures declined 5% Y-o-Y across the 12 New York counties, the three regions varied: NYC cases rose 11% Y-o-Y, Long Island foreclosures dropped 18% and Hudson Valley markets also trended down.
Long Island’s drastic cooldown was also the result of diverging local trends with Nassau County warming up even as Suffolk County cases were nearly halved. In fact, Suffolk County’s 43% drop was the metro’s sharpest in Q2, resulting in 143 first-time filings for the market’s slowest quarter in two years.
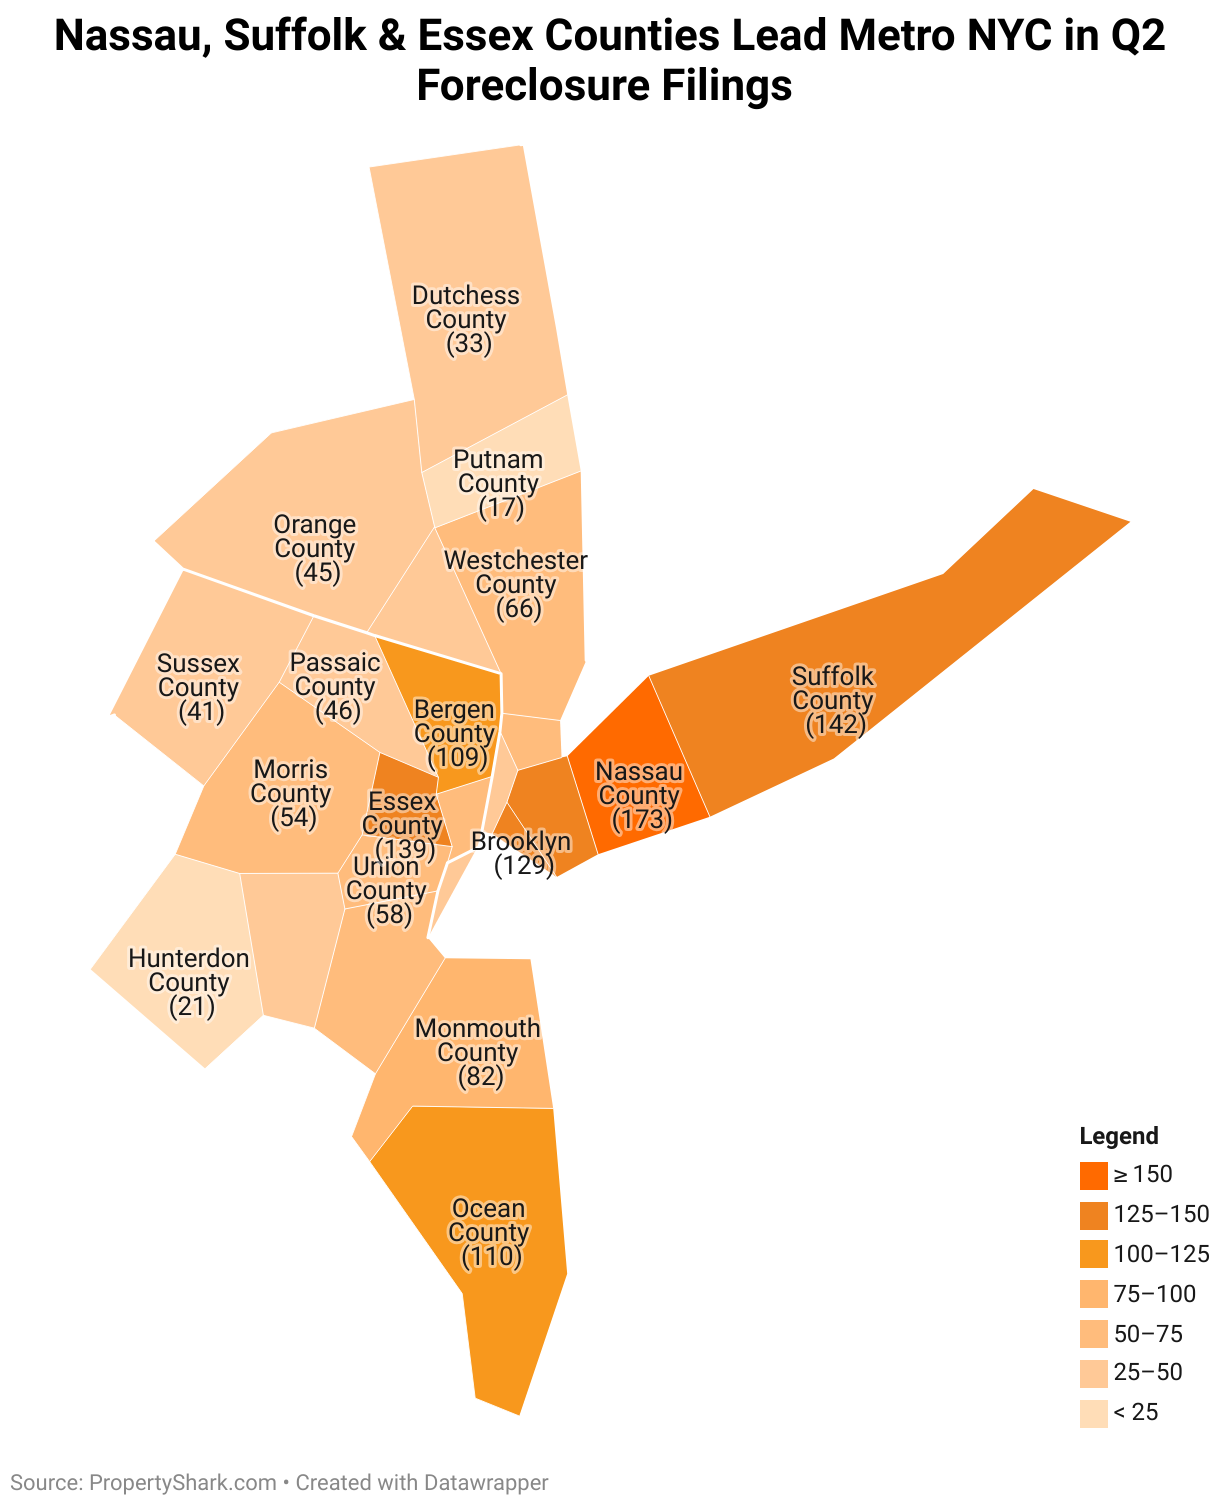
Consequently, Nassau County’s caseload increase was insufficient to cancel out Long Island’s overall slowdown. Even so, the 173 cases logged here made Nassau County the most active foreclosure market in metro New York and marked its most active quarter since late 2023.
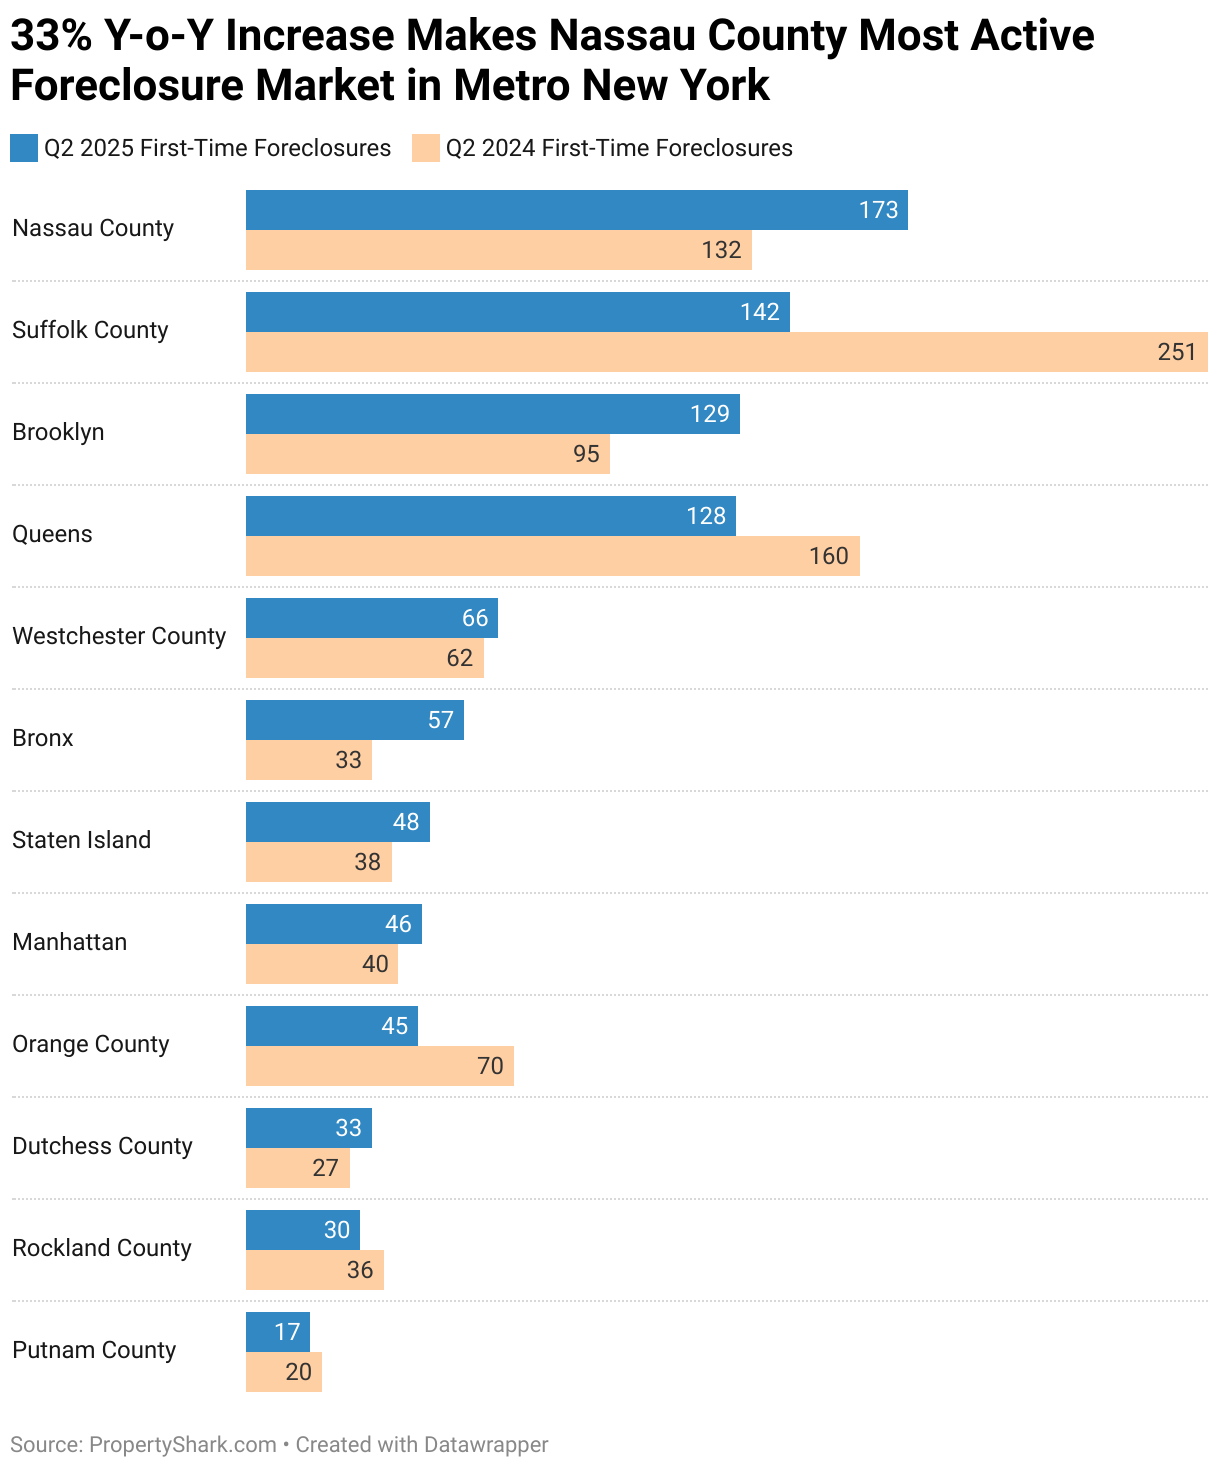
At the same time, the metro’s Hudson Valley markets contracted 11% Y-o-Y to total 191 first-time filings in Q2 — 100 fewer than during the same period last year. Much of this was due to the sudden cooldown of Orange County, where first-time foreclosures dropped by more than one-third to 45 new cases in Q2.
Otherwise, Dutchess County extended its strong start to the year with a similarly active second quarter. It was joined by Westchester County’s modest 6% uptick as the only other Hudson Valley market in the metro with foreclosures on the rise. As usual, Westchester County was also the Hudson Valley’s most active foreclosure market. Its 66 cases represented a two-year peak.
New Jersey markets
New Jersey Foreclosure Activity Hits 2-Year High With 800+ Cases
After nine quarters of near-consecutive declines, the metro’s New Jersey markets suddenly heated up again to reach figures not seen since early 2023. As a matter of fact, the 804 cases logged across the metro’s 12 New Jersey counties represented not only a 23% Y-o-Y increase, but also a 34% quarter-over-quarter jump, as well.
Across the state line in New Jersey, all but two markets saw new foreclosures rise. Even so, Passaic County’s 2% decline represented just one less foreclosure than the county claimed during the same period last year, while Union County’s 8% decline translated to five fewer cases. Meanwhile, in the New Jersey markets where cases rose, they overwhelmingly logged double-digit price gains.
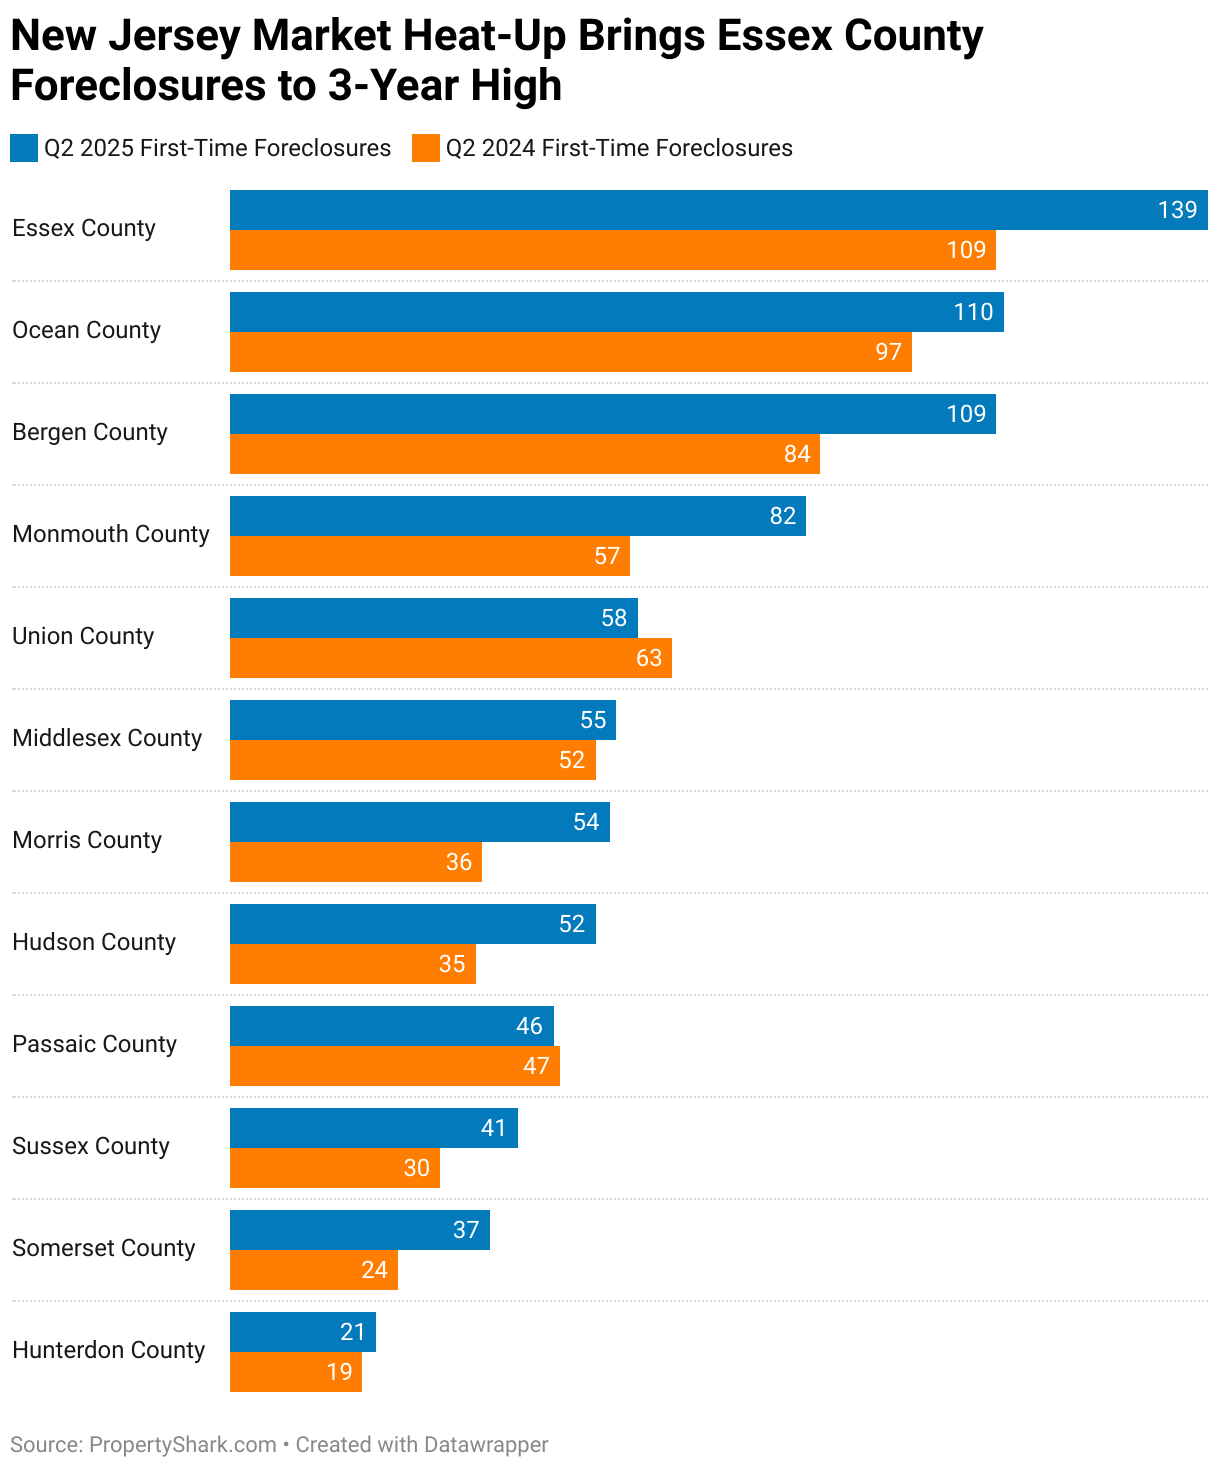
Here, three markets logged half as many cases year-over-year, led by Somerset County’s 54% Y-o-Y surge — the sharpest across metro New York. Close behind was Morris County’s 50% Y-o-Y jump (North Jersey’s sharpest), followed by Hudson County’s 49% Y-o-Y hike.
Finally, foreclosure activity picked up significantly in Essex County, too, which became the metro’s most active New Jersey market with 139 first-time filings. Conversely, Hunterdon County remained the slowest, but foreclosures nevertheless increased 11% Y-o-Y. Notably, these figures marked three-year highs for both counties.
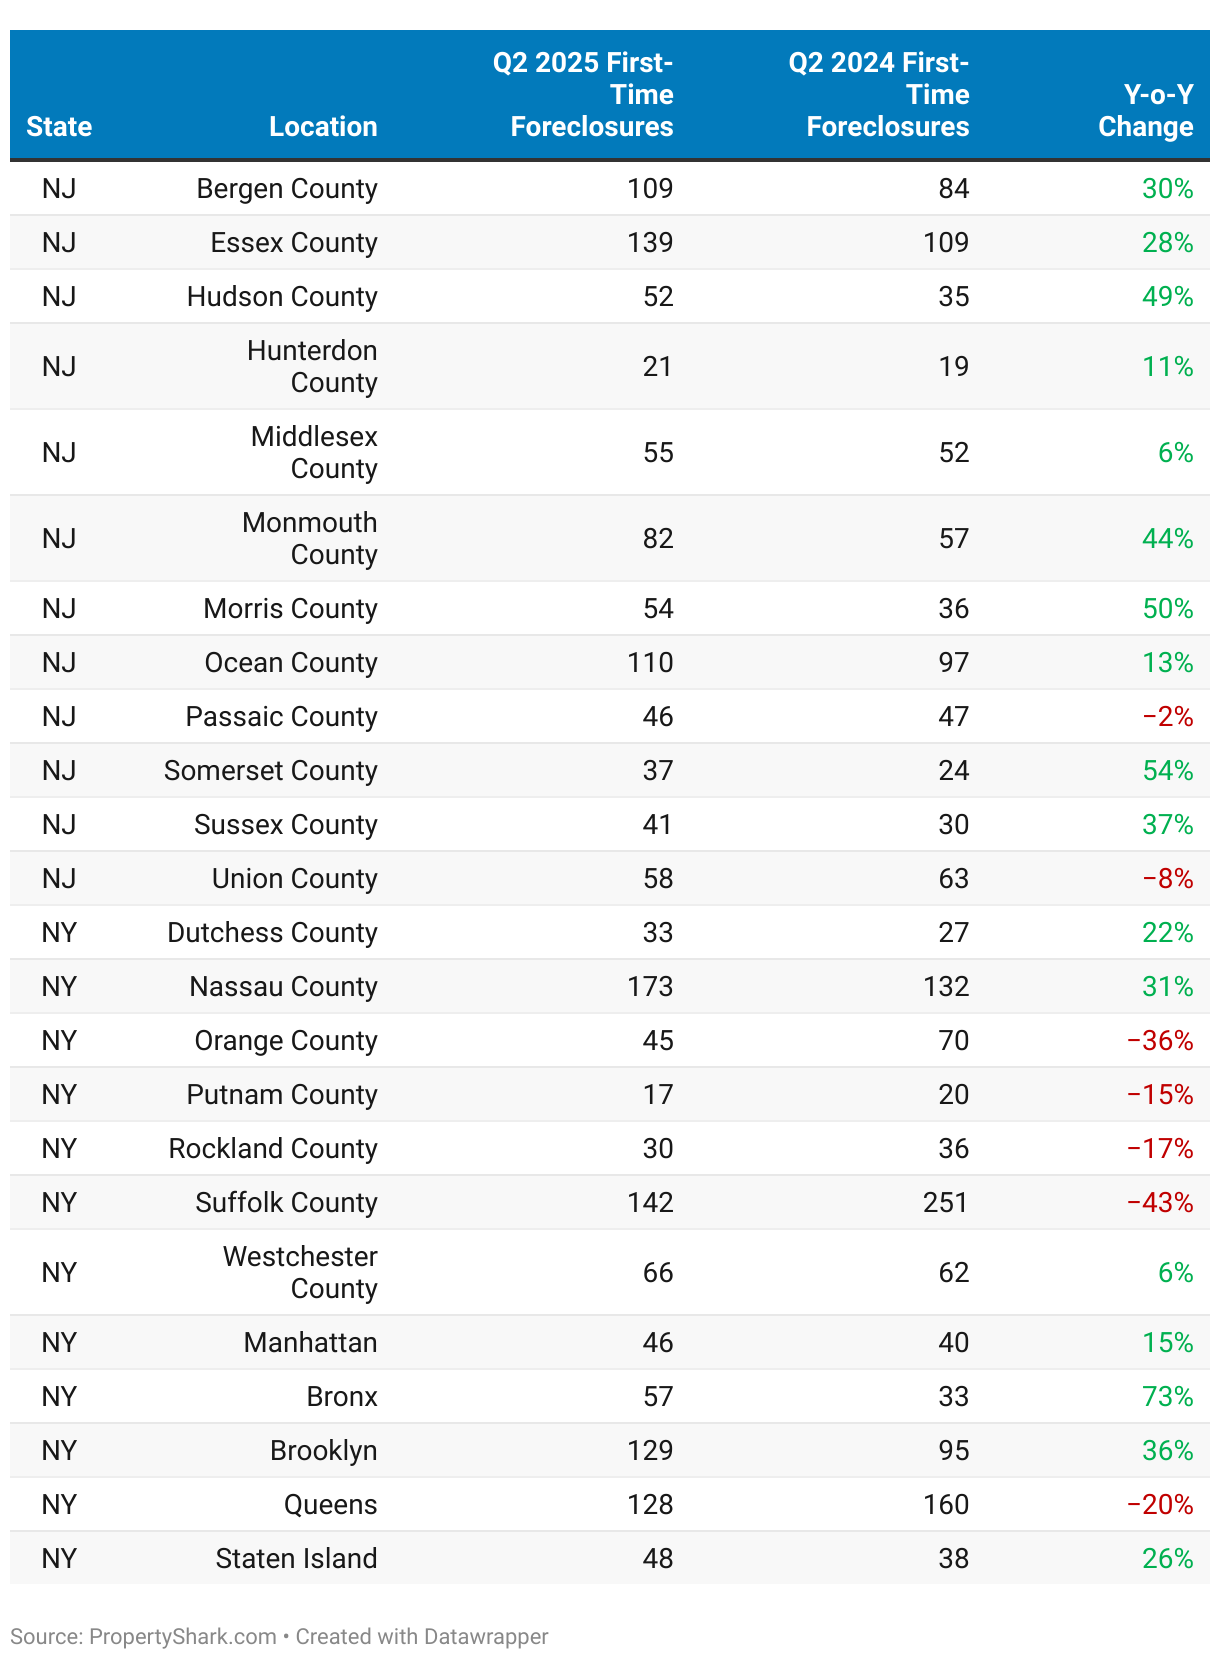
All counties
See how first-time foreclosures evolved in Q2 2025 across metro New York:
Methodology
Having tracked foreclosure listings for more than a decade, PropertyShark is the only service in New York that guarantees 100% coverage of the local foreclosure market. Because auctions are frequently postponed and/or rescheduled, the statistics referenced in this report include only first-time foreclosures in order to avoid over-reporting the number of distressed properties in the city.
This report focuses on residential properties (single and two-family homes; condos; and co-op units) that were scheduled for auction for the first time in Q2 2025 in metro New York.
Metro New York was defined as a 24-county area comprising:
- 5 NYC counties: New York (Manhattan), Kings (Brooklyn), Queen (Queens), Bronx (The Bronx) and Richmond (Staten Island).
- 2 Long Island counties: Nassau and Suffolk.
- 3 Lower Hudson Valley counties: Putnam, Rockland and Westchester.
- 2 Mid-Hudson Valley counties: Dutchess and Orange.
- 7 North Jersey counties: Bergen, Essex, Hudson, Morris, Passaic, Sussex and Union.
- 5 Central Jersey counties: Hunterdon, Middlesex, Monmouth, Ocean and Somerset.
This report also includes data on NYC commercial properties that went into foreclosure in Q1 2025.
Fair Use & Redistribution
We encourage and freely grant permission to reuse and repost information, analysis, charts, tables, and images included on this page. When doing so, we only ask that you link back to this page or PropertyShark.com as the official source.
About PropertyShark
PropertyShark is an online real estate database and property research tool that provides building details, ownership information, comparable sales, and foreclosure data. Founded in 2003, PropertyShark serves real estate professionals and consumers in New York and other major U.S. markets.
Access Every New York Foreclosure — First.
Get full access to NYC foreclosures, pre-foreclosures, REOs & auctions. Updated daily with lien & owner data. 100% coverage.
POSTED IN: Hamptons Real Estate, Market Studies

Eliza Theiss is a senior writer reporting real estate trends in the US. Her work has been cited by CBS News, Curbed, The Los Angeles Times, and Forbes among others. With an academic background in journalism, Eliza has been covering real estate since 2012. Before joining PropertyShark, Eliza was an associate editor at Multi-Housing News and Commercial Property Executive. She has also contributed extensively to CommercialEdge. Reach her at [email protected]
Recent Reports

Prices Rise in 32 of NYC’s Leading Neighborhoods as City and Manhattan Hit Record Highs
Q2 2026 saw NYC and Manhattan reach historic highs, with Brooklyn and Queens marking close to new records as well. Meanwhile, Hudson Yards remained at the top, Central Midtown posted its highest price ever and Carroll Gardens marked its third consecutive quarter over $2 million

2026 Q2 Foreclosure Report: Bronx Caseload Hits 7-Year High, Brooklyn & Manhattan Slow to 4-Year Low
Manhattan yet again slowed to become the city’s least active foreclosure market, Brooklyn’s caseload dropped so low it barely edged out Staten Island, while the Bronx heated up enough to surpass all boroughs except Queens.

NYC Resale Gains & Losses: Every Borough Made Money in 2025, Except Manhattan
In 2025, NYC home-sellers mostly made money. But, in Manhattan, resales came with losses — and it was apartments and recent buyers that absorbed them.