

Market Studies | RELEASED ON June 23, 2026
NYC Resale Gains & Losses: Every Borough Made Money in 2025, Except Manhattan
Eliza Theiss | 13 minute read
In 2025, NYC home-sellers mostly made money. But, in Manhattan, resales came with losses — and it was apartments and recent buyers that absorbed them.
Key Takeaways:
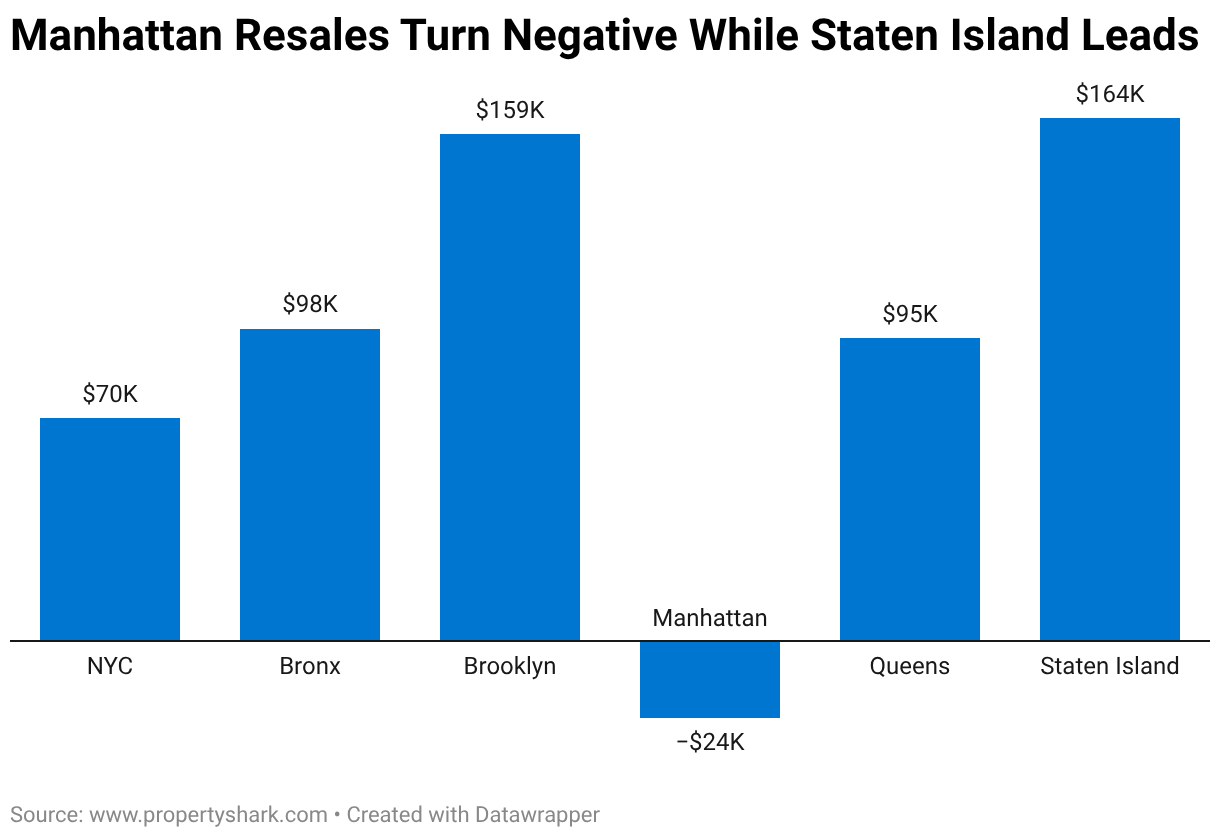
- NYC homeowners who sold in 2025 made a median resale gain of +$70,000
- Buying in the post-financial crash years yielded the highest gains as sellers netted +$206,000 across the city, versus pandemic-era buyers who sold with only +$9,000 left after fees and taxes
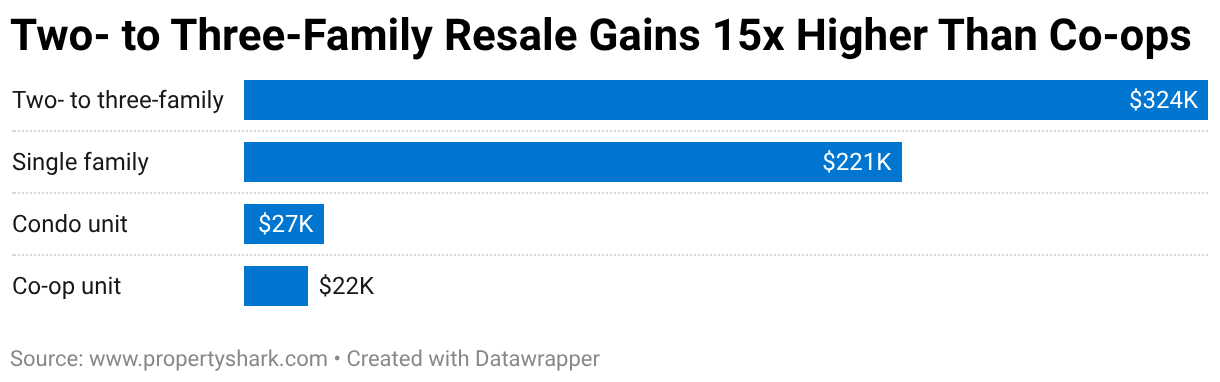
- Two- to three-family homes were the city’s most profitable resale category, generating a median resale gain of +$324,000, whereas co-ops lagged at just +$22,000
- Manhattan was the only borough with a negative median resale outcome (-$24,000), weighed down by the underperformance of condos and co-ops
- The outer boroughs drove citywide gains: Staten Island posted the highest median resale gain at +$164,000, followed closely by Brooklyn at+ $160,000, while the Bronx and Queens made close to +$100,000
- Borough Park and Fresh Meadows were the most profitable neighborhoods, clearing +$409,000 and +$370,000, respectively
- The Financial District and Central Park South took the largest losses at -$113,000 and -$92,000, respectively
- In Manhattan, 23 neighborhoods posted a negative median resale outcome, while only one Brooklyn and one in Queens were similarly in the red
NYC real estate was profitable for owners who sold in 2025 — unless it was a Manhattan apartment, especially one purchased after 2012. Analyzing 14,877 NYC transactions from 2025 shows a city with two resale markets: Manhattan versus the outer boroughs. And, consequently, apartments versus houses, with purchase timing cutting across both.
To determine resale gains and losses, we subtracted the original purchase price from the 2025 sale price and then deducted closing sales costs as well as the buying costs that the original owner paid at acquisition. These include the NYC and New York state transfer taxes, the co-op flip tax, title insurance, the mortgage recording tax, the mansion tax and the broker’s commission. Property taxes, common charges, maintenance costs and renovation or improvements expenses were not deducted.
That said, after paying all applicable transfer taxes and fees, the typical seller in any of the four outer boroughs walked away with at least some cash — from a median resale gain of +$95,000 in Queens and $$98,000 in the Bronx, up to $159,000 in Brooklyn and +$164,000 on Staten Island. However, that was not the case in Manhattan, where the typical seller lost -$24,000.
Notably, the largest resale gains were recorded in the two boroughs that had recorded the highest median sale price growth over the past two decades, with Brooklyn and Staten Island averaging 4% annual increases, versus 3% in the other three boroughs,
Purchase period
The Buyer’s Timing Trap: Post-Crash Peaks, Pandemic Near-Losses
Across NYC, buyers who closed between 2009 and 2012 produced the strongest real estate resale returns, clearing a median +$206,000 in 2025. Likewise, in every borough, the same years generated the peak returns, with Brooklyn leading at a +$389,000 median resale gain and Manhattan trailing at +$111,000.
Clearly, buying NYC real estate in the years immediately after the financial crisis returned more on resale than buying at any other point. Those buyers got the post-crash bottom in pricing and held through the long stretch of historically low Federal Reserve rates that followed. However, the returns compressed sharply for those who purchased after 2012, with the median resale gain halved for 2013-2019 buyers.
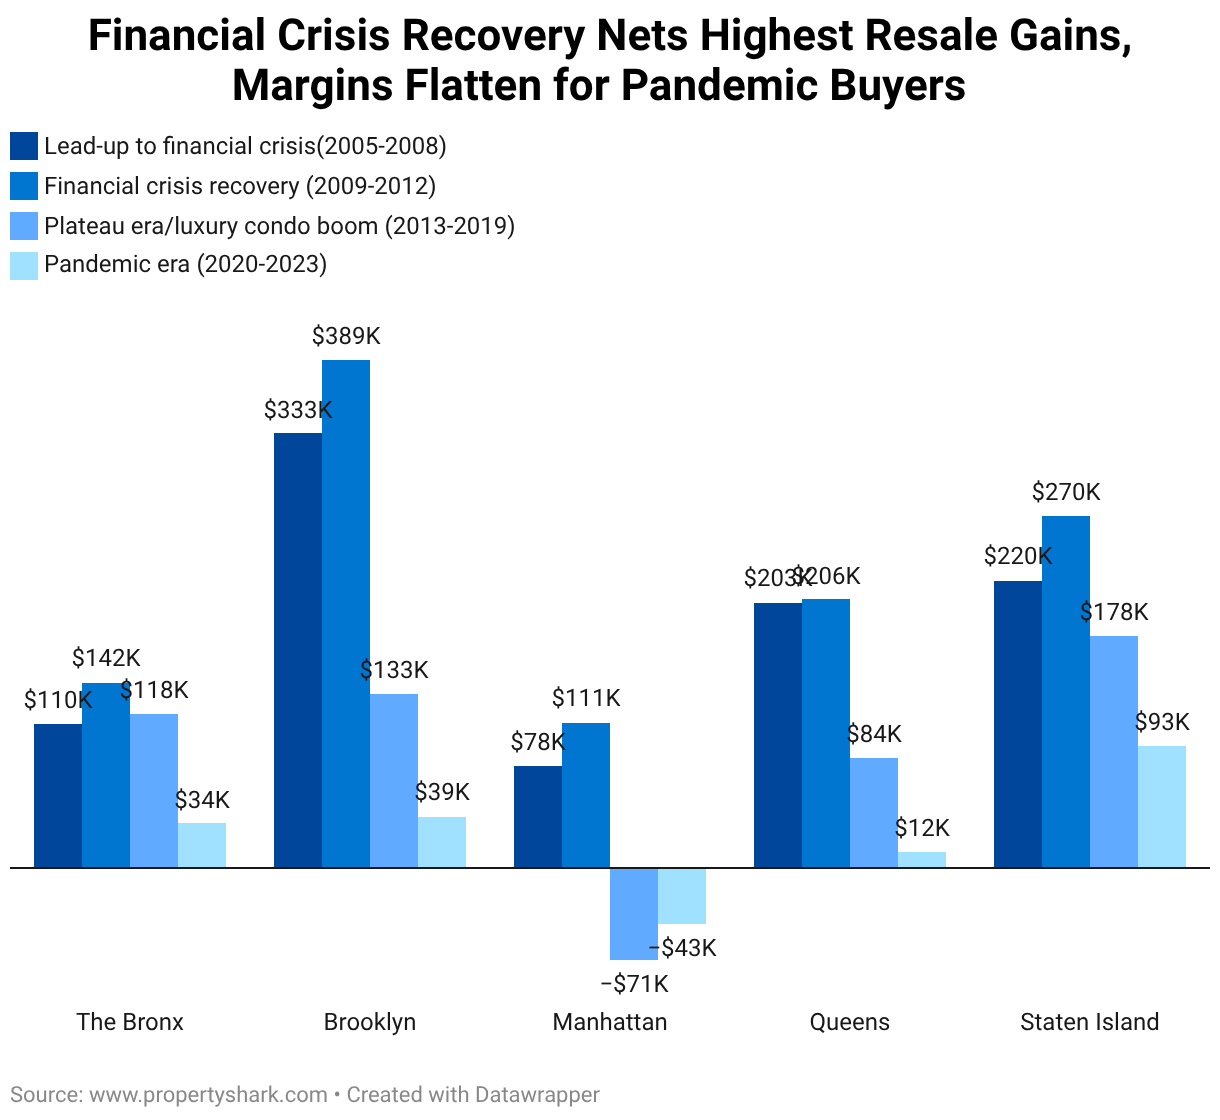
In the same way, outer borough returns also stayed positive but still contracted significantly. Staten Island was the most resilient, holding above +$90,000 even for pandemic buyers, while Manhattan flipped negative post 2012. Citywide, pandemic buyers only netted a median +$9,000, having bought during COVID price peaks just before the Fed’s 2022 hiking cycle ended the easy-money backdrop.
Property type also compounded the timing trap. Citywide co-op and condo resales both turned negative for pandemic-era buyers, losing a median -$11,000 and -$14,000, respectively. Houses, however, stayed positive in every cohort, but their magnitudes shrank: For two- to three-family homes, the median resale gain was halved for pandemic buyers.
Manhattan
The Manhattan Apartment Shock & the Luxury Boom Losses
Manhattan didn’t just lose, it did so in a very specific, structural way, tied entirely to the underperformance of condos and co-ops, the most common asset type in the borough. Co-ops closed at a median loss of -$11,000, while condos closed -$58,000 below even.
Single and two- to three-family homes in the borough still sold with significant returns for the typical owner. In fact, single family resales in the borough cleared a median +$739,000, while two- to three-family homes cleared +$356,000. But Manhattan houses are rare, accounting for fewer than 100 deals in 2025.
Meanwhile, across Manhattan’s co-op and condo resales, the typical seller lost money last year: 59% of the 2,436 condos resold did so at a loss, along with 54% of the 3,217 co-op units traded during the same period.

A few factors likely contributed to the losses, including the fact that the Manhattan condo market leans on investor and pied-à-terre demand more heavily than the outer boroughs do. Manhattan is also still contending with a thinned international buyer pool since 2020. Plus, Manhattan co-ops owners have to contend with the board review and post-closing liquidity requirements that cap buyer pools.
These outcomes had no parallel in the outer boroughs. Instead, co-op resales in the Bronx, Brooklyn and Queens cleared median resale gains ranging from +$25,000 to +$70,000. Similarly, condo resales across the outer boroughs also performed, netting owners +$58,000 in Queens up to +$108,000 in Brooklyn.
The same pattern of resale losses and gains held across various price points, with Manhattan the only borough with negative resale results. Not only that, but the borough recorded resale losses in every price range, reinforcing that Manhattan losses aren’t a luxury problem or an entry-level problem, but rather a cut across price ranges.

Purchase timing also drew a sharp line through Manhattan’s apartment performance. The typical Manhattan apartment seller who bought in the lead-up to the financial crisis netted a median of +$78,000, while recovery-era buyers walked away with +$111,000. But the resale math turned negative from 2013 onwards.
From 2013 through 2019, new ultra-luxury and supertall towers came online across Billionaires’ Row and into Lower Manhattan, which led to oversupply in the top of the market just before the international buyer pullback hit from 2020 onward. This meant that sellers who bought during Manhattan’s peak luxury condo boom years took the deepest hit at a median loss of -$71,000, surpassing even the -$43,000 median loss that pandemic-era buyers contended with.

Additionally, while Manhattan’s median resale price rose 55% since 2005, the median sale price for new developments surged 156%, further widening the gap what the typical buyer paid for a new build and what the market was willing to offer upon resale. This placed asking prices at levels that rental yields and comparable resales didn’t support.
In fact, between 2016 and 2019, the median sale price for new residential developments was up to 16% higher than in 2025: $2.89 million versus $2.41 million. By comparison, the median resale price during the same years was at most 2% higher than the $1.1 million median resale price logged in 2025.
Zooming into the neighborhood layer further reinforced the borough’s negative resale trend, rather than narrowing it to a few isolated weak spots. Of the 25 NYC neighborhoods that posted median resale losses, 23 are in Manhattan. The other two are DUMBO — Brooklyn’s most condo-dominated submarket — and the co-op heavy Glen Oaks in Queens, which finished essentially flat.
The Manhattan neighborhoods where the typical buyer resold at a loss clustered across the borough’s apartment-dense corridors from the Financial District up through the East and West sides. Notably, the Manhattan neighborhoods that recorded gains — TriBeCa, West Village, SoHo, Harlem and a handful of others — sit outside of that high-rise spine.
Brooklyn
Resale Gains Across the Board, Except in Condo-Driven DUMBO
Unlike Manhattan, every slice of Brooklyn paid out in 2025, regardless of property type, price range and purchase period, with DUMBO the only exception. In particular, Brooklyn’s two- to three-family inventory netted sellers a median +$439,000, the strongest return in the city for this asset type. Single family homes were next, closing with a +$309,000 gain for the typical Brooklyn seller.

Additionally, Brooklyn apartments held up better than apartments anywhere else in NYC, as co-ops cleared a median +$70,000 and condos +$108,000. At the top of the market ($3 million and over) Brooklyn returned a median of +$1.37 million, for the strongest luxury-tier performance in the city.
Brooklyn’s timing arc was also sharp. Recovery-era buyers cleared a median +$389,000 upon resale — the strongest return for any borough in any purchase period over the past 20 years. But for pandemic-era buyers, that figure had compressed to just +$39,000. That said, Brooklyn’s bottom never crossed below zero, with just one notable exception.

Of all Brooklyn neighborhoods considered for this study, only DUMBO, the borough’s most condo-heavy submarket, closed at a resale loss: -$28,000. But DUMBO’s profile reads less like the rest of the borough and more like a Manhattan high-rise submarket dropped across the East River, which followed Manhattan trends rather than those of its own borough.
For comparison, Brooklyn supplied six of the 10 highest neighborhood-level resale gains across NYC. Namely, Borough Park topped the borough (and the city) at a median resale gain of +$409,000. Ocean Hill, Bedford-Stuyvesant and Bensonhurst all netted $300,000 or more for the typical seller, with Crown Heights and Greenwood Heights close behind.
These are predominantly rowhouse and brownstone neighborhoods rich in the high-performing two- to three-family stock. This asset type’s performance was bolstered by limited inventory and even more limited expansion of that inventory over the past 20 years.
Additionally, two- to three-family homes maintained deep demand from owner-occupied use paired with small multifamily rental income as well as from multigenerational households.
Overall, 28 Brooklyn neighborhoods generated at least a +$100,000 resale gain for the typical seller in 2025. Even Coney Island, the borough’s bottom performer outside DUMBO, netted +$26,000 for the typical 2025 seller.
Queens
Typical Seller Nets $250K in 10 Neighborhoods, Fresh Meadows Generates $370K
Queens delivered resale gains across the whole borough in 2025, from Fresh Meadows in the east through Glendale at the center to Ozone Park in the south. But its most recent buyers came closer to losing money than anywhere else, other than Manhattan. Specifically, the typical Queens seller cleared +$95,000, but pandemic era buyers cleared a much lower median +$12,000 when they sold in 2025.

Queens’ overall positive returns for 2025 sellers were strongly driven by two- to three-family homes which logged a resale median of +$312,000, with single family homes at +$241,000. Here too, apartments cleared less ground with condos at +$58,000 and co-ops at +$41,000. Notably, condos and co-ops bought during the pandemic actually generated negative resales, with the typical seller losing -$9,000 and -$8,000, respectively.
Regardless of purchase period, Queens had the highest share of co-ops and condos resold at a loss outside Manhattan. But the borough’s 31% of co-op resales with negative outcomes and the 33% of condos with negative resale performance only accounted for 500 and 175 deals, respectively.
Significantly, the only Queens neighborhood with an overall negative resale outcome was Glen Oaks, an area dominated by co-ops. Even so, Glean Oaks sellers lost a median -$695, finishing essentially flat.

At the neighborhood level, Fresh Meadows led the borough at a median resale gain of +$370,000 with Ditmars-Steinway and Glendale also clearing +$300,000. But the borough’s Manhattan-adjacent submarkets — including LIC, Hunters Point and the surrounding waterfront — posted significantly lower medians.
That’s because their inventory leans heavily on new condo development from the post-2012 peak boom years, bringing their profile closer to Manhattan’s high-rise market than to the low-rise neighborhoods that boosted the borough’s resales.
Overall, Queens supplied four of the 10 top-performing neighborhoods for resellers, with10 clearing at least +$250,000 for the typical local seller and an additional 15 neighborhoods netting at least +$100,000. Outside Glen Oaks, Murray Hill was borough’s bottom performer with the typical seller closing with a +$15,000 gain.
Staten Island
Top Borough Performance, Even for Pandemic Buyers
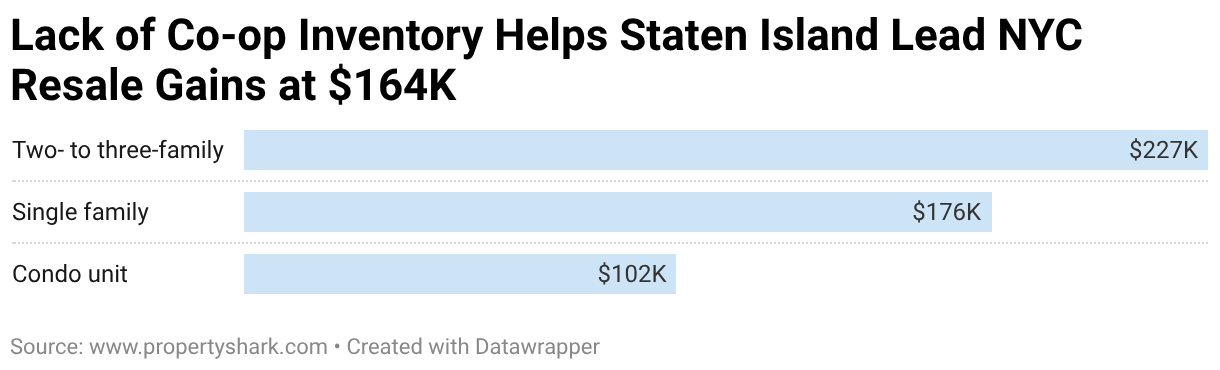
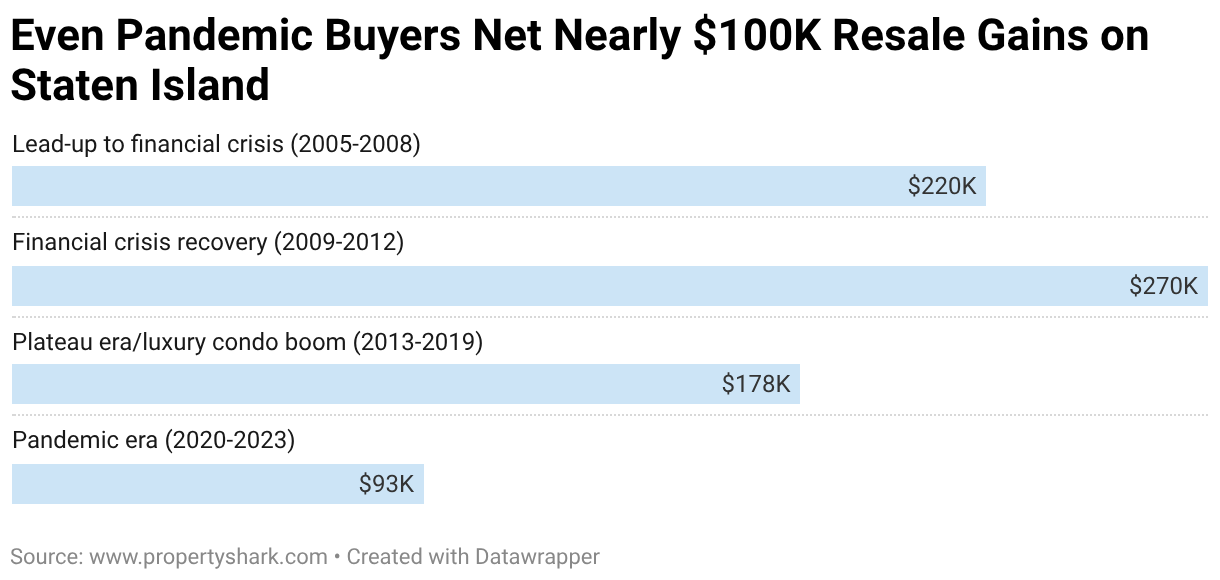
Staten Island posted the strongest resale outcomes in the city, with the typical reseller clearing +$164,000. Staten Island’s inventory mix and geographic insulation explain much of its strong performance, since the borough trades almost entirely in houses and was the most insulated from Manhattan apartment dynamics.
Specifically, two- to three-family home resales cleared a median +$227,000 and single family homes netted +$176,000. Staten Island condos also cleared +$102,000, second only to Brooklyn condos citywide. Notably, the borough essentially has no co-op market, a property type that pulled down other boroughs.
Another notable factor is that Staten Island produced less new housing than any other NYC borough over the past two decades, leaving its stock outside of the speculative condo cycle that ran through Manhattan and the Brooklyn and Queens waterfronts through the 2010s.
Unlike the rest of NYC, in Staten Island even pandemic era buyers walked away with cash in their pockets, clearing a median +$93,000. By comparison, the next highest resale gain for pandemic era buyers was recorded in Brooklyn, at a much lower +$39,000. In fact, even sellers who unloaded condos bought during the pandemic fared well, netting a median +$51,000. By comparison, condos bought during the same period lost -$14,000 citywide.
But, here too, buyers from the post-crash recovery years fared best, selling with a $270,000 median gain.
Resale gains were also consistent at the neighborhood level: Of the 15 Staten Island neighborhoods in this study, all but one netted at least +$100,000 for 2025 resellers. Even Bay Terrace, the borough’s weakest performer, generated a median resale gain of +$52,000.
The borough’s top-performing neighborhoods were spread across its interior, led by Richmond Town and West Brighton, followed closely by Westerleigh and Rossville. In fact, Richmond Town’s +$266,000 median resale gain placed it among the top 20 best-performing neighborhoods for NYC resellers.
The Bronx
Steady Resale Gains Fueled by Two- to Three-Family Homes
The Bronx’s 2025 real estate resale market was the smallest in terms of dollars but was also the most consistent. Specifically, only 9% of resales had negative resale outcomes for single and two- to three-family homes, as well as condos.
Only co-ops logged losses across a larger share of transactions, with 29% selling at a loss. Even so, Bronx co-ops still generated a median +$25,000 in resale gains in 2025, pulled down by the losses (-$1,400) generated by pandemic buyers.
Overall, Bronx owners who sold in 2025 netted a median +$98,000, marginally outperforming Queens (+95,000). That was largely fueled by two- to three-family homes, which traded at a +$276,000 median resale gain and accounted for a third of the borough’s transactions. Notably, single family home sales cleared a median +$179,000, marginally outperforming Staten Island’s single family resale gains ($176,000).
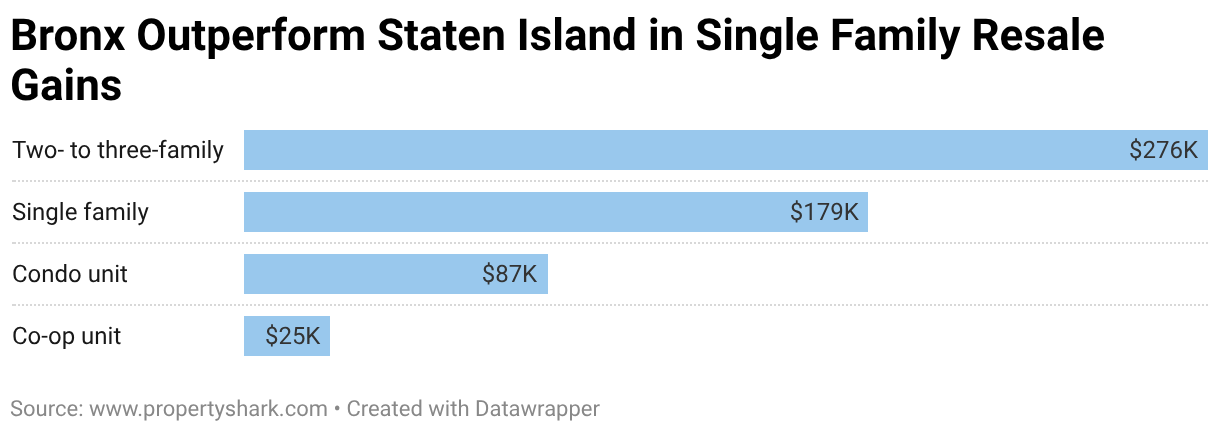
The Bronx’s resale performance was also aided by the fact that it largely sat out of the post -2012 new development boom that pushed pricing volatility elsewhere. Notably, even Bronx condos sold at a median resale gain of $87,000.
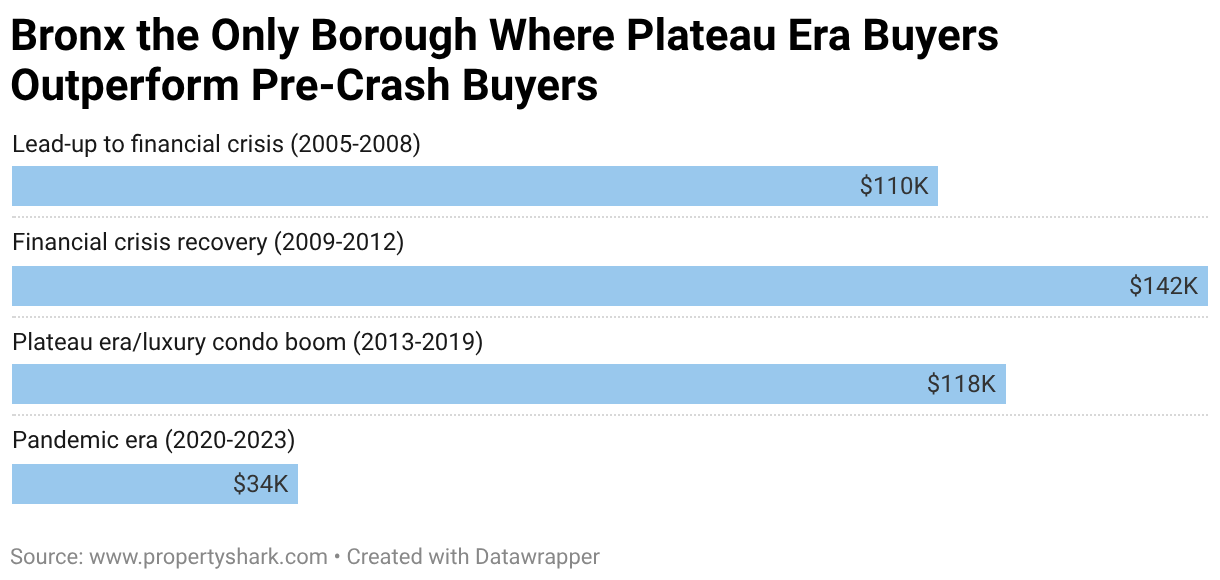
The muted presence of the post-2012 boom that impacted other parts of NYC is a main driver in the fact that the Bronx was the only borough where 2013 to 2019 buyers had higher resale returns than 2005 to 2008 buyers. Specifically plateau era buyers netted +$118,000 on resales, while the earlier cohort netted slightly lower gains at a median +$110,000.
Even pandemic-era buyers in the Bronx came out ahead at a median of +$34,000, although here too, the largest returns came to buyers who entered the market in the post-crash recovery years, netting +$142,000.
The power of two- to three-family homes was also evidenced by the borough’s price bands. Specifically, in the $1 million to $3 million range, the Bronx returned a median resale gain of +$454,000 for the strongest result in that price tier of any NYC borough.
At Bronx price levels, that range represents the borough’s larger houses that sit in established residential pockets in eastern and north-central Bronx, quite distinct from the denser south Bronx and the co-op-heavy northwest. Specifically, Williamsbridge cleared the highest median resale gain at +$289,000, one of three Bronx neighborhoods where the median resale gain surpassed +$200,000. In fact, it was one of the 10 highest resale gains in the city.
Overall, of the 13 Bronx neighborhoods in this study, eight logged a median resale gain of $100,000 or more and even in its bottom performer, Fieldston, saw the typical seller walk away with $4,000.
For NYC Resellers, It’s the Outer Boroughs vs Manhattan Apartments
Resale results for 2025 sellers paint a picture that has been forming since the mid-2010s: For long-time NYC homeowners — those who bought before 2013 — equity in 2025 was real and substantial across every borough. But for newer buyers, particularly anyone who bought a Manhattan apartment, the math has not worked out for more than a decade.
And the conditions driving those negative resale outcomes in the borough — namely, the luxury condo supply built between 2013 and 2019, the international buyer pool that thinned starting in 2020 and the Fed’s rate environment that ended in 2022 — haven’t fully reversed. With additional burdens such as the new pied-a-terre tax, the resale math for NYC owners is looking increasingly uncertain.
Explore neighborhood resale gains and losses with the interactive table below:
NYC Neighborhood Resale Gains and Losses
| Rank | Neighborhood | Borough | Median Resale Gain/Loss | Number of Sales 2025 |
|---|---|---|---|---|
| 1 | Borough Park | Brooklyn | $409,217 | 90 |
| 2 | Fresh Meadows | Queens | $369,969 | 47 |
| 3 | Ocean Hill | Brooklyn | $366,087 | 27 |
| 4 | Ditmars-Steinway | Queens | $337,470 | 28 |
| 5 | Glendale | Queens | $322,175 | 30 |
| 6 | Bedford-Stuyvesant | Brooklyn | $321,521 | 198 |
| 7 | Bensonhurst | Brooklyn | $299,199 | 48 |
| 8 | Williamsbridge | The Bronx | $289,019 | 31 |
| 9 | Greenwood Heights | Brooklyn | $287,900 | 25 |
| 10 | Crown Heights | Brooklyn | $287,753 | 91 |
| 11 | Ozone Park | Queens | $287,641 | 73 |
| 12 | Bath Beach | Brooklyn | $283,217 | 25 |
| 13 | Bushwick | Brooklyn | $281,391 | 96 |
| 14 | South Ozone Park | Queens | $275,234 | 64 |
| 15 | Fort Greene | Brooklyn | $272,538 | 52 |
| 16 | Greenpoint | Brooklyn | $266,737 | 51 |
| 17 | Richmond Town | Staten Island | $265,717 | 25 |
| 18 | Dyker Heights | Brooklyn | $257,361 | 33 |
| 19 | Rochdale | Queens | $254,369 | 28 |
| 20 | Prospect – Lefferts Gardens | Brooklyn | $254,253 | 26 |
| 21 | Hollis | Queens | $252,675 | 32 |
| 22 | Queens Village | Queens | $251,593 | 63 |
| 23 | Saint Albans | Queens | $250,828 | 82 |
| 24 | Rosedale | Queens | $249,767 | 39 |
| 25 | Middle Village | Queens | $244,714 | 47 |
| 26 | East New York | Brooklyn | $243,498 | 117 |
| 27 | Marine Park | Brooklyn | $243,440 | 46 |
| 28 | West Brighton | Staten Island | $241,908 | 30 |
| 29 | Laurelton | Queens | $235,233 | 35 |
| 30 | Jamaica | Queens | $233,579 | 136 |
| 31 | Clason Point | The Bronx | $232,027 | 25 |
| 32 | Morris Park | The Bronx | $219,438 | 25 |
| 33 | Springfield Gardens | Queens | $213,549 | 42 |
| 34 | College Point | Queens | $211,325 | 42 |
| 35 | Park Slope | Brooklyn | $210,456 | 244 |
| 36 | Williamsburg | Brooklyn | $208,005 | 219 |
| 37 | Windsor Terrace | Brooklyn | $207,021 | 52 |
| 38 | Carroll Gardens | Brooklyn | $203,748 | 37 |
| 39 | East Elmhurst | Queens | $197,478 | 68 |
| 40 | Westerleigh | Staten Island | $193,230 | 33 |
| 41 | TriBeCa | Manhattan | $192,323 | 189 |
| 42 | Rossville | Staten Island | $187,582 | 49 |
| 43 | Canarsie | Brooklyn | $185,089 | 63 |
| 44 | Spencer Estates – Country Club | The Bronx | $182,977 | 33 |
| 45 | Bulls Head | Staten Island | $175,412 | 25 |
| 46 | Wakefield | The Bronx | $171,417 | 54 |
| 47 | Tottenville | Staten Island | $167,613 | 42 |
| 48 | Castleton Corners | Staten Island | $163,534 | 25 |
| 49 | Prospect Heights | Brooklyn | $163,085 | 93 |
| 50 | East Flatbush | Brooklyn | $162,994 | 76 |
| 51 | Bayside | Queens | $162,555 | 113 |
| 52 | Woodhaven | Queens | $161,758 | 62 |
| 53 | Flatbush | Brooklyn | $161,556 | 36 |
| 54 | Throggs Neck | The Bronx | $159,286 | 66 |
| 55 | Prince’s Bay | Staten Island | $158,160 | 35 |
| 56 | Brooklyn Heights | Brooklyn | $153,605 | 134 |
| 57 | Cobble Hill | Brooklyn | $146,348 | 43 |
| 58 | Arden Heights | Staten Island | $146,153 | 56 |
| 59 | Midwood | Brooklyn | $144,880 | 125 |
| 60 | Auburndale | Queens | $143,765 | 39 |
| 61 | Clinton Hill | Brooklyn | $143,399 | 117 |
| 62 | Richmond Hill | Queens | $141,872 | 45 |
| 63 | Mariner’s Harbor | Staten Island | $140,555 | 30 |
| 64 | Pelham Bay | The Bronx | $137,645 | 36 |
| 65 | Maspeth | Queens | $136,797 | 58 |
| 66 | Far Rockaway | Queens | $135,525 | 56 |
| 67 | Sunset Park | Brooklyn | $133,745 | 44 |
| 68 | New Springville | Staten Island | $126,183 | 41 |
| 69 | West Village | Manhattan | $119,374 | 178 |
| 70 | Heartland Village | Staten Island | $113,226 | 38 |
| 71 | East Flushing | Queens | $113,007 | 28 |
| 72 | Flatlands | Brooklyn | $112,593 | 38 |
| 73 | Bellerose | Queens | $107,561 | 70 |
| 74 | Great Kills | Staten Island | $106,741 | 67 |
| 75 | Douglaston | Queens | $104,884 | 50 |
| 76 | Sunnyside | Staten Island | $102,210 | 55 |
| 77 | Parkchester | The Bronx | $100,117 | 106 |
| 78 | Boerum Hill | Brooklyn | $97,878 | 63 |
| 79 | Kensington | Brooklyn | $86,897 | 73 |
| 80 | South Astoria | Queens | $77,840 | 33 |
| 81 | Sheepshead Bay | Brooklyn | $76,189 | 120 |
| 82 | Hunters Point | Queens | $75,632 | 88 |
| 83 | Whitestone | Queens | $75,115 | 116 |
| 84 | Ditmas Park | Brooklyn | $74,699 | 30 |
| 85 | Little Neck | Queens | $72,655 | 46 |
| 86 | Brighton Beach | Brooklyn | $70,896 | 44 |
| 88 | Gravesend | Brooklyn | $68,217 | 87 |
| 89 | Woodside | Queens | $66,800 | 83 |
| 90 | Elmhurst | Queens | $66,270 | 64 |
| 91 | Corona | Queens | $66,021 | 57 |
| 92 | Bay Ridge | Brooklyn | $65,850 | 127 |
| 93 | Harlem | Manhattan | $65,539 | 172 |
| 94 | Jackson Heights | Queens | $64,620 | 169 |
| 95 | Jamaica Estates | Queens | $57,145 | 38 |
| 96 | Gowanus | Brooklyn | $55,066 | 38 |
| 97 | Briarwood | Queens | $54,688 | 69 |
| 98 | Fordham | The Bronx | $54,116 | 26 |
| 99 | Kew Gardens Hills | Queens | $53,714 | 111 |
| 100 | Bay Terrace | Staten Island | $52,120 | 113 |
| 101 | Rego Park | Queens | $49,637 | 130 |
| 102 | Downtown Flushing | Queens | $49,049 | 176 |
| 103 | Lindenwood | Queens | $49,020 | 78 |
| 104 | Lower East Side | Manhattan | $47,822 | 84 |
| 105 | LIC | Queens | $47,502 | 36 |
| 106 | Downtown Brooklyn | Brooklyn | $45,094 | 86 |
| 107 | Oakland Gardens | Queens | $43,128 | 92 |
| 108 | Kew Gardens | Queens | $41,285 | 80 |
| 109 | Forest Hills | Queens | $40,265 | 300 |
| 110 | Hudson Square | Manhattan | $34,794 | 45 |
| 111 | SoHo | Manhattan | $33,419 | 63 |
| 112 | Spuyten Duyvil | The Bronx | $31,460 | 57 |
| 113 | Riverdale | The Bronx | $26,330 | 62 |
| 114 | Coney Island | Brooklyn | $26,160 | 25 |
| 115 | North Riverdale | The Bronx | $22,140 | 59 |
| 116 | Murray Hill | Queens | $15,274 | 275 |
| 117 | Inwood | Manhattan | $14,630 | 34 |
| 118 | Manhattan Valley | Manhattan | $11,393 | 82 |
| 119 | Washington Heights | Manhattan | $5,994 | 117 |
| 120 | Fieldston | The Bronx | $4,456 | 28 |
| 121 | Glen Oaks | Queens | -$695 | 98 |
| 122 | Chelsea | Manhattan | -$5,252 | 345 |
| 123 | Greenwich Village | Manhattan | -$10,858 | 286 |
| 124 | Upper West Side | Manhattan | -$11,056 | 547 |
| 125 | Yorkville | Manhattan | -$11,100 | 337 |
| 126 | Tudor City | Manhattan | -$14,460 | 52 |
| 127 | Lincoln Square | Manhattan | -$19,282 | 352 |
| 128 | Battery Park City | Manhattan | -$21,159 | 32 |
| 129 | Kips Bay | Manhattan | -$22,143 | 100 |
| 130 | East Village | Manhattan | -$23,950 | 111 |
| 131 | DUMBO | Brooklyn | -$28,088 | 35 |
| 132 | Carnegie Hill | Manhattan | -$33,993 | 281 |
| 133 | Central Midtown | Manhattan | -$34,330 | 127 |
| 134 | Morningside Heights | Manhattan | -$37,611 | 63 |
| 135 | Lenox Hill | Manhattan | -$38,215 | 627 |
| 136 | Flatiron District | Manhattan | -$42,434 | 121 |
| 137 | NoMad | Manhattan | -$42,822 | 95 |
| 138 | Clinton – Hell’s Kitchen | Manhattan | -$46,239 | 186 |
| 139 | Sutton Place | Manhattan | -$49,881 | 142 |
| 140 | Gramercy Park | Manhattan | -$53,910 | 175 |
| 141 | Turtle Bay | Manhattan | -$57,986 | 188 |
| 142 | East Harlem | Manhattan | -$65,460 | 66 |
| 143 | Theatre District – Times Square | Manhattan | -$80,606 | 51 |
| 144 | Central Park South | Manhattan | -$92,196 | 43 |
| 145 | Financial District | Manhattan | -$113,308 | 188 |
Methodology
To analyze gains and losses on NYC home resales, we examined all residential transactions recorded between January 1, 2025, and December 31, 2025, for properties originally purchased between January 1, 2005, and December 31, 2023. 2024 transactions were not considered to exclude flips.
Property types included condos, co-ops, single family homes, two-family homes and three-family homes. Only arm’s-length transactions were considered. Package deals were excluded.
For each transaction, we identified the original purchase price and calculated resale gain or loss by subtracting the acquisition price, sale costs and buying costs from the sale price.
Sale costs included:
- The broker commission as 6% of the sale price.
- The NYC transfer tax, which ranged from 1% to 1.425% of the sale price, depending on the sale amount.
- The New York state transfer tax, which ranged from 0.4% to 0.65% of the sale price, depending on the sale amount.
- The co-op flip tax as 2% of the sale price for co-op transactions.
Buying costs included:
- Title insurance as 0.5% of the purchase price for condos and houses.
- The mortgage recording tax, which ranged from 1.8% to 1.92% of the mortgage amount, depending on loan size.
- The mansion tax as 1% of the purchase price for transactions of $1 million and above that closed through June 2019. Transactions closed in July 2019 and later were subject to a tiered rate of 1% to 3.9%, based on the purchase amount.
Resale gains and losses were aggregated at the city, borough and neighborhood levels, as well as by property type, holding period, purchase period and price band.
For neighborhoods, results were calculated only for those that recorded at least 25 resales in 2025.
Purchase periods were defined as:
- Lead-up to financial crisis: 2005 to 2008
- Financial crisis recovery: 2009 to 2012
- Plateau era/luxury condo boom: 2013 to 2019
- Pandemic (COVID and post-COVID) era: 2020-2023
City and borough-level resale and new development median sale prices were calculated based on all arm’s length transactions recorded between January 1, 2005 and December 31, 2025. Property types included condos, co-ops, single family homes, two-family homes and three-family homes. Flips were excluded, as well as package deals.
No prices were adjusted to inflation in order to keep the focus on resale math, rather than the evolution of buying power over the past 20 years.
Fair Use & Redistribution
We encourage and freely grant permission to reuse and repost the information, analysis, charts, tables and images included on this page. When doing so, we only ask that you link back to this page or PropertyShark.com as the official source.
About PropertyShark
PropertyShark is an online real estate database and property research tool that provides building details, ownership information, comparable sales, and foreclosure data. Founded in 2003, PropertyShark serves real estate professionals and consumers in New York and other major U.S. markets.
Want to stay on top of the real estate market?
Access comprehensive property data and ownership information with intuitive research tools.
POSTED IN: Market Studies, New York Real Estate

Eliza Theiss is a senior writer reporting real estate trends in the US. Her work has been cited by CBS News, Curbed, The Los Angeles Times, and Forbes among others. With an academic background in journalism, Eliza has been covering real estate since 2012. Before joining PropertyShark, Eliza was an associate editor at Multi-Housing News and Commercial Property Executive. She has also contributed extensively to CommercialEdge. Reach her at [email protected]
Recent Reports

World Cup or Your Mortgage/Rent? Ticket Prices Rival Host City Housing Costs
World Cup ticket prices rival monthly housing expenses in the 11 U.S. host cities, with even the cheapest seats covering weeks or even months of rent or mortgage payments.

Locked-In Owners, Mobile Renters: Homeowners Stay Put as Renters Move 3.7x More Across Largest U.S. Cities
Renters became the primary drivers of long-distance mobility across the largest U.S. cities, moving 3.7 times more than owners in 2024, as high mortgage rates and housing costs kept many homeowners in place.

$4.6M Hudson Yards Maintains Top Spot, Luxury Sales in Malba Set $2.5M Price Record for Queens
Despite prices declining, Hudson Yards remained the most expensive NYC neighborhood, but TriBeCa’s growth closed the gap to under $400,000, while Malba set a new historic price record for Queens at $2.5 million, securing the highest ranking ever for the borough at #5.