

New York Real Estate | 2 minute read
Q3 Multifamily Property Report
BY Roxana Baiceanu | Dec 18, 2008
In our Q3 Investment Property Report, we see that in New York City, the number of closed transactions and the median sale price hit two year lows, yet some boroughs did better than others. Manhattan experienced a substantial quarterly increase in the dollar volume, passing $1.1 billion, even with the number of closed deals dropping. The Bronx had its largest multifamily sale ($67.7 million) in at least 5 years, despite two-year lows in both the number of sales and in the price indicators, while Staten Island had more sales
than in the previous two quarters despite a major drop in median prices. Queens and Brooklyn both had a significant decrease in the number of sales, while median prices in Brooklyn declined by 2% and median prices in Queens fell 12% compared to Q3 2007.

Multi-Unit Property Sales in Queens and Brooklyn
Transactions surge in Los Angeles as distressed properties flood the market: Los Angeles was the only city among the three in the report that had an increase in the number of sales compared to both Q3 2007 and Q2 2008. However, the increase in transactions was driven by the large number of distressed properties (trustee sales, notices of default or REO’s) in the market, predominantly in the 2-4 family building classes. Fifty four percent of all properties that sold in the third quarter of 2008 were in distress this year.
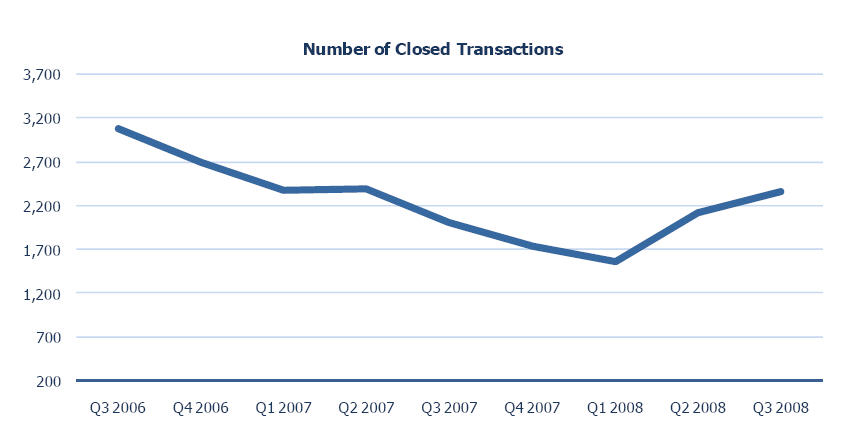
Los Angeles Multifamily Property Transactions
However, the median price per unit for Multifamily properties has been in free fall since Q4 2006.
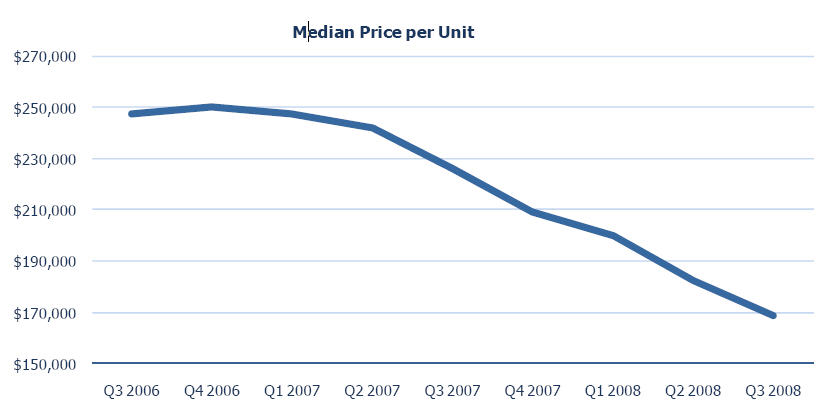
Los Angeled Multifamily Property Price Per Unit
Latest Posts
Want to stay on top of the real estate market?
Access comprehensive property data and ownership information with intuitive research tools.
POSTED IN: New York Real Estate, Real Estate Broad

Roxana is an associate editor with Multi-Housing News and Commercial Property Executive. In the past, she also created content for PropertyShark and Point2Homes’ blog pages. She also has 5 years of experience as a marketing copywriter.
Recent Reports

NYC Homeownership by the Numbers: How Household Type, Gender & Age Shape Who Owns in Every Neighborhood
In a city where homeownership is dominated by married-couple families, Manhattan stands as the only borough led by nonfamily owners. At the same time, residents younger than 35 make up less than one tenth of the ownership pool and female-led family households outnumber male-led families across 91% of NYC neighborhoods.

Prices Rise in 32 of NYC’s Leading Neighborhoods as City and Manhattan Hit Record Highs
Q2 2026 saw NYC and Manhattan reach historic highs, with Brooklyn and Queens marking close to new records as well. Meanwhile, Hudson Yards remained at the top, Central Midtown posted its highest price ever and Carroll Gardens marked its third consecutive quarter over $2 million

2026 Q2 Foreclosure Report: Bronx Caseload Hits 7-Year High, Brooklyn & Manhattan Slow to 4-Year Low
Manhattan yet again slowed to become the city’s least active foreclosure market, Brooklyn’s caseload dropped so low it barely edged out Staten Island, while the Bronx heated up enough to surpass all boroughs except Queens.