

RELEASED ON March 8, 2024
NYC Plaza District Closes Year With Largest Average Sale Price per Square Foot & $1.5B in Office Sales
Ioana Ginsac | 8 minute read
Even in a slow sales year, these office submarkets attracted top-dollar investment.
Key Takeaways
- New York City’s Plaza District submarket was top spot for sale price per square foot
- Average sale price among 10 most expensive office submarkets ranged between $311 and more than $1,000 per square foot
- California, Florida, Illinois, and Arizona claimed half of 100 priciest U.S. office submarkets last year
- Nine states recorded sale prices above national per-square-foot average
- State-wide office sales totals exceeded $1 billion in California, New York, Florida, and Massachusetts
- Chicago, New Jersey, and Minnesota submarkets ranked highest for the amount of office space traded in 2023
Though there’s wide consensus that office sales in the U.S. were slower in 2023, there were nevertheless significant investments in the sector. In fact, recent national office reports showed that more than $33 billion in assets changed hands last year for an average sale price of nearly $200 per square foot.
While rising interest rates — along with strong flight-to-quality trends — have undoubtedly translated to challenges for a considerable portion of the U.S. office sector, the highest-quality assets in the best-placed locations have continued to command top-dollar price tags. With that in mind, we turned to CommercialEdge office sales data to identify and rank the 100 most expensive U.S. office submarkets in 2023.
NYC Plaza District Office Space Trades at $1,045 Per Square Foot in 2023
Nine notable office deals closed in the Plaza District in 2023, one of which also happened to be the largest office transaction of the year — Prada’s portfolio acquisition of 720 and 724 Fifth Ave. for $822 million. Along with premium office space, this deal also secured Prada some of the most expensive retail space in Manhattan. Averaging around $5,000 per square foot, this deal alone held significant weight in placing the New York City submarket at the top of our list.
The second-priciest office deal here was Sedesco’s acquisition of the Vogar Building — a 13-story, class B office building on Billionaires’ Row for which it paid nearly $970 per square foot. That said, the New York-based developer has since filed demolition permits for the site to make room for a 63-story skyscraper that will include hotel, residential, and commercial space. With this purchase, Sedesco added nearly 60 feet of frontage on West 57th Street to an assemblage of lots that it has been piecing together since 2012.
Average Sale Prices in Top 10 Start at $311 per Square Foot
With its average office sale price of $1,045 per square foot, the Plaza District in Manhattan stood out by a mile. Specifically, it was 32% ahead of second place (Santa Monica, Calif., with $710 per square foot) and 70% ahead of the submarket in 10th place (Kearny Mesa, Calif., with $311 per square foot).
Even so, California submarkets dominated in terms of number of entries. More precisely, six of the 10 priciest U.S. office markets hailed from the Golden State — Santa Monica, San Francisco, Sunnyvale East, Santa Clarita, John Wayne Airport, and Kearny Mesa.
Santa Monica rose to runner-up last year and, similar to the Plaza District, likely owed a lot of this performance to one deal, in particular: First Citizens Bank and Trust shelled out nearly $1,300 per square foot for the Pier Point Pacific office building at 1540 Second St., marking what was reportedly one of the priciest office deals in Los Angeles County in recent years.
Next, San Francisco claimed third place for office deals that closed last year in the SOMA submarket, which averaged a sale price of $570 per square foot. Otherwise, the city’s South Financial District was its next-highest ranking entry, narrowly missing the top 10 to land in 12th with an average office sale price of $309 per square foot.
Meanwhile, two Washington, D.C. submarkets ranked among the country’s 10 most expensive: The capital’s central business district claimed fifth place with sales here averaging $478 per square foot in 2023, whereas office space changed hands in D.C.’s East End (#9) for an average of $330 per square foot.
At the same time, Phoenix made a splash in the top 10 by finishing seventh-best for last year’s office sales in the submarket of Peoria. The three major transactions to close here last year saw office space exchanged at an average price of $408 per square foot. Notably, two of the assets traded were medical office properties (Banner Health Center Peoria and Del Webb Medical Plaza C) that were acquired in separate transactions by the same buyer (Nashville, Tenn.-based Montecito Medical Real Estate).
4 States Account for Nearly Half of 100 Priciest U.S. Office Submarkets in 2023
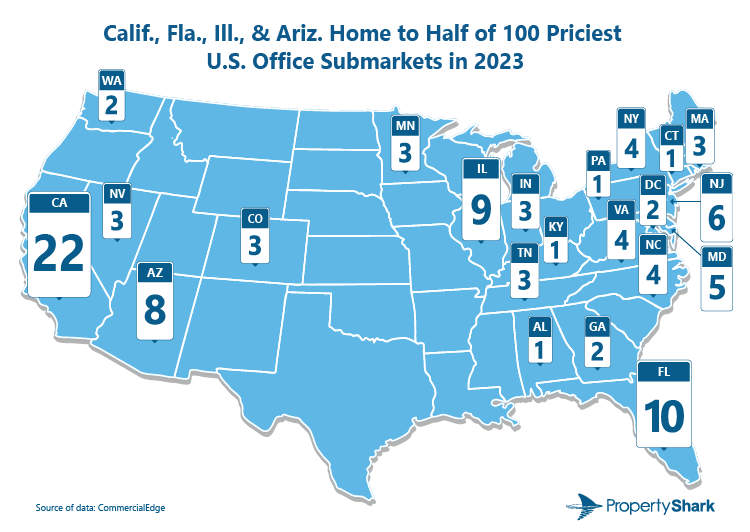
Looking at the geographical distribution of the 100 most expensive office submarkets in the U.S. last year, we found that nearly half (49) of the entries were concentrated in four states: California, Florida, Illinois, and Arizona.
Of course, California accounted for the largest group with 22 submarkets in the ranking hailing from eight Golden State markets — Sacramento (six submarkets); Los Angeles metro (five submarkets); San Francisco – Peninsula and Orange County (three entries each); San Diego (two submarkets); the Bay Area – South Bay Market, as well as the Inland Empire and Central Valley (one submarket each).
On the opposite coast, office sales closed last year included 10 Florida submarkets among the priciest 100. Six of these are located in the Tampa – St. Petersburg – Clearwater market, while Fort Lauderdale contributed two entries to the ranking, and West Palm Beach – Boca Raton and Orlando each had one submarket in the ranking.
In the Midwest, nine Illinois office submarkets — all hailing from Chicago — averaged top 100 sale prices. And, not to be outdone, eight Arizona entries performed well enough to make the cut with seven Phoenix submarkets and one from Tucson.
D.C. Office Space Price per Square Foot Is Double the National Average in 2023
If we look beyond the ranking submarkets and consider sales prices for office space at the state level, we find nine entries that recorded values above the national average: Washington, D.C.; New York; California; Washington; Massachusetts; Nevada; Florida; North Carolina; and Texas.
The District of Columbia claimed the top spot in this respect with office space here trading for nearly $400 per square foot, which was roughly double the national average of just less than $200. Not far behind, sale prices for office properties larger than 25,000 square feet across the state of New York averaged $352 per square foot last year to place the Empire State second behind D.C.
Then, California came in third with office space across Golden State markets changing hands for an average of $280 per square foot. Further north, office sales activity in Washington state markets last year resulted in assets trading for an average of $256 per square foot (#4). Across the country, Massachusetts rounded out the top five with office sales here boiling down to an average of $243 per square foot.
California Takes Crown for Largest State-Wide Office Sales Volume in 2023
Widening the scope further still, we then looked at total yearly sales in states where at least 10 office assets larger than 25,000 square feet had changed hands last year. In this case, data showed that California boasted the largest state-wide office sales volume in 2023, which added up to a total of nearly $4.7 billion and placed the Golden State in a comfortable lead ahead of #2.
In second place was New York, where sales activity last year resulted in a total volume of around $3 billion. Because sales closed in the priciest submarket of the year accounted for nearly half of that state-wide total, New York continues to be a stand-out example of how much value can lie in the location of an asset.
Further down the East Coast, Florida closed the year with a total of $2.1 billion in office sales, which marked the third-highest state-wide dollar volume on our list. Here, northeast Orlando was the state’s highest-ranking submarket in terms of sale price per square foot, landing 11th with an average of slightly less than $311 per square foot. Conversely, Westshore was Florida’s most active submarket with seven deals closing here last year, while Boca Raton North ranked best in the state in terms of total sales volume and total office square footage traded.
Otherwise, Massachusetts was the only other state on our list where office sales surpassed the $1 billion mark last year. The priciest submarket in the state in 2023 was the Newton-Needham Corridor, where $177 million in office assets changed hands for an average sale price of $229 per square foot.
Last, but certainly not least, data showed the fifth-largest sales volume was recorded in Illinois, where transactions closed in 2023 added up to just less than $1 billion.
Chicago, New Jersey & Minneapolis Submarkets Top List for Most Square Footage Traded
When looking at sales activity, we found that Chicagoland’s Golden Corridor stood out for the highest number of sales closed and the largest submarket-level square footage total to change hands in 2023. Despite ranking 98th on the list of 100 priciest submarkets in the U.S., the corridor submarket around Jane Addams Memorial Tollway saw 16 office assets trade last year, incorporating a total of nearly 2.4 million square feet of office space.
Next, Cranford-Union, N.J., placed second in terms of amount of space traded. Sales here last year incorporated roughly 2.2 million square feet of office space — the only other submarket where sales surpassed the 2-million-square-foot mark.
Meanwhile, office sales closed in the Minneapolis central business district last year incorporated roughly 1.6 million square feet, which placed the submarket third in terms of space traded. Notably, the Spear Street Capital acquisition of the RBC Gateway tower office space accounted for nearly half of that total (784,000 square feet). This sale also marked the city’s largest 2023 office sale by total price ($225 million) and by price per square foot ($287).
Certainly, state-of-the-art office properties in high-demand markets remain well-positioned to weather any oncoming uncertainties and some emerging markets continue to experience a lift from robust interest in segments such as life sciences and medical office space. However, lower-quality assets located outside such spheres are likely looking at additional challenges ahead.
Methodology
For this ranking of the priciest submarkets in the U.S., we turned to CommercialEdge data on office sales closed between January 1 and December 31, 2023. In an effort to avoid low sample size outliers in the ranking, we only included submarkets where at least three office sales were closed in 2023. The comparatively lower transactional volume recorded in 2023 has left some traditionally expensive submarkets absent from the ranking, as they did not meet the sales activity benchmarks necessary for representative calculations of averages.
We considered sales of both individual properties, as well as portfolio transactions in which the price for each individual office property was known and validated. Our final data set included only portfolio deals for which all properties were located within the same submarket. We then counted and presented each such transaction as a single sale and calculated the average price per square foot by dividing the total sale price by the total square footage of the portfolio.
The study only included properties that are at least 25,000 square feet in size. Prices per square foot were calculated based on property size data as researched by CommercialEdge. In the case of mixed-use properties, this may also include other use types besides traditional office space.
Statewide average sale prices were calculated based on all transactions of office properties larger than 25,000 square feet that were closed in the state in 2023, including those located in submarkets that did not make the top 100 ranking. We applied the same reasoning for total statewide office sale volume.
Delimitations of markets and their respective submarkets were based on proprietary CommercialEdge demarcations determined by the platform’s real estate professionals.
Disclaimer
While we made every effort to ensure the accuracy and timeliness of the information presented herein, it is provided “as is” and neither PropertyShark nor CommercialEdge can guarantee that it is complete. This ranking is presented for general informational purposes only. It does not constitute and should not be relied upon as a basis for an investment decision. The information presented is subject to change without notice and may or may not apply depending on the circumstances. Always contact a qualified consultant if you need advice regarding buying, selling, or otherwise transacting in any investment.
Latest Studies
Want to stay on top of the real estate market?
Access comprehensive property data and ownership information with intuitive research tools.

POSTED IN: Commercial Real Estate, Real Estate Broad

Ioana is a content writer who has been covering all-things-CRE (and more) for several Yardi network publications since 2017. You will find her byline regularly in industry news and market reports, but also on articles covering sustainable development, green urbanism, and innovation, all of which she has been passionately learning about for more than a decade. Her work has been referenced by publications including AmericanInno, Bisnow, BusinessInsider, Commercial Property Executive, Curbed, Fast Company, Forbes, GlobeSt.
Latest Posts

2026 Q3 Foreclosure Report: NYC Foreclosure Activity Slows to 4-Year Low, Fueled by Queens & Brooklyn Contractions
NYC foreclosures contracted to levels not seen since late 2022, fueled by drops in Brooklyn and Queens. Meanwhile, elevated activity in the Bronx kept it near the forefront, surpassed only by Queens.
Atherton Breaks $10M Median as 11 States Set New Price Records
2026 brought record price peaks to 11 states, including the first ever eight-figure median sale price with Atherton’s dramatic surge back to #1. Meanwhile, California’s presence continued to shrink with the pullback of the Bay Area, although it remained home to more than half of the country’s top zips, while the New York metro supplied one quarter, its strongest presence yet.
How to Find Rent-Stabilized, Rent-Controlled or Rent-Regulated Apartments in NYC
In NYC, rent-regulated apartments are of high-interest for investors, brokers and other real estate professionals. In this guide, you will learn how to find rent-stabilized and rent-controlled apartments in NYC, through the new PropertyShark features.