
RELEASED ON December 13, 2017
TriBeCa and SoHo Remain Most Expensive Neighborhoods in New York City
Eliza Theiss | 5 minute read
Key Takeaways: TriBeCa reigns as the #1 most expensive neighborhood in NYC with $4.68M median sale price Boerum Hill pushes into top 10 with 54% price growth Brooklyn’s Fort Greene registers highest median price growth at 95% DUMBO remains Brooklyn’s priciest neighborhood at #6 in our top 50 The Upper East Side was the most active neighborhood in terms of sales with 2,537 transactions Looking at New York City price trends at a neighborhood level has become somewhat of a tradition here at PropertyShark, so as the year approaches its end, we crunched residential sales data throughout the city to see which are New York City’s top 50 most expensive neighborhoods in 2017. You can check out 2016’s top priciest neighborhoods here. TriBeCa remains #1 most expensive neighborhood as prices continue to grow Boasting a median sale price of $4,683,950, TriBeCa remains the #1 most expensive New York City neighborhood. The sleek neighborhood saw 417 sales complete in 2017, representing a somewhat cooler year compared to 2016’s 482 transactions. However, TriBeCa more than made up for this in the pricing department with a 12% expansion over last year’s median of $4,173,227. With a median sale price of $2,997,500, SoHo ranked as…
Key Takeaways:
- TriBeCa reigns as the #1 most expensive neighborhood in NYC with $4.68M median sale price
- Boerum Hill pushes into top 10 with 54% price growth
- Brooklyn’s Fort Greene registers highest median price growth at 95%
- DUMBO remains Brooklyn’s priciest neighborhood at #6 in our top 50
- The Upper East Side was the most active neighborhood in terms of sales with 2,537 transactions
Looking at New York City price trends at a neighborhood level has become somewhat of a tradition here at PropertyShark, so as the year approaches its end, we crunched residential sales data throughout the city to see which are New York City’s top 50 most expensive neighborhoods in 2017. You can check out 2016’s top priciest neighborhoods here.
TriBeCa remains #1 most expensive neighborhood as prices continue to grow
Boasting a median sale price of $4,683,950, TriBeCa remains the #1 most expensive New York City neighborhood. The sleek neighborhood saw 417 sales complete in 2017, representing a somewhat cooler year compared to 2016’s 482 transactions. However, TriBeCa more than made up for this in the pricing department with a 12% expansion over last year’s median of $4,173,227.
With a median sale price of $2,997,500, SoHo ranked as the 2nd most expensive neighborhood in New York, even as the median price contracted 13%. While sales activity also cooled from last year’s 180 to 150 in 2017, it should be noted that 44 of 2016’s sales took place at 10 Sullivan Street and 180 Avenue of Americas, two pricey new developments.
Stagnating prices in DUMBO and minimal price growth in Little Italy, allowed Hudson Square to become the 3rd most expensive neighborhood in New York. This is despite the neighborhood’s steady median price, which clocked in at $2,305,245 – just $5,245 higher than the Financial District’s. The latter landed on #4 in our top 50, following an impressive 19% year-over-year expansion of the median sale price.
Manhattan stays ahead with largest sales activity on the Upper East Side
Manhattan of course remains New York’s most expensive borough, boasting 7 of the city’s 10 most expensive neighborhoods, and 24 of the top 50 priciest citywide, mostly in the ranking’s upper half. Among the city’s most expensive neighborhoods, Manhattan’s iconic Upper East Side registered the highest sale activity, completing 2,537 transactions. The Upper West Side saw the 2nd highest volume with 2,097 sales.
Manhattan was also the location of the 3rd largest price increase in the Financial District, which saw its median price grow 53% year-over-year. On the other hand, Manhattan also saw the largest price contractions among the city’s most exclusive neighborhoods, with a 25% year-over-year contraction in the Theatre District – Times Square area, and a 24% slump in Greenwich Village.
New-to-market luxury developments skew numbers in Central Midtown and Flatiron District
Certain neighborhoods saw prices artificially inflated by high sales volumes at newly-launched luxury and ultra-luxury developments. Most noticeable in Brooklyn neighborhoods such as Fort Greene, Boerum Hill and Red Hook, the trend was observed in Manhattan as well, with the Flatiron District and Central Midtown the most notable examples.
Ranking as the 4th most expensive neighborhood in New York, the Flatiron District is just $5,245 behind the city’s 3rd priciest neighborhood, Hudson Square. Registering 460 sales in 2017, the Flatiron District saw its median price jump 19% year-over-year to $2.3 million thanks, in part, to two new luxury projects. 51 properties sold at a median value of $6.5 million at Madison Square Park Tower, while 38 additional properties traded hands at 55 W 17 Street at a $2.6 million median.
Climbing two positions from a year ago, Central Midtown ends 2017 as New York’s 10th most expensive neighborhood. Following a 22% increase, Central Midtown’s median sale price reached $1,580,000, but the higher pricing trend was skewed here as well, similarly to the Flatiron District, Boerum Hill and Hudson Square. Central Midtown’s higher median was increased significantly by 66 properties sold at 252 East 57 Street, where the median sale price is $5.4 million, and the maximum is $13.9 million.
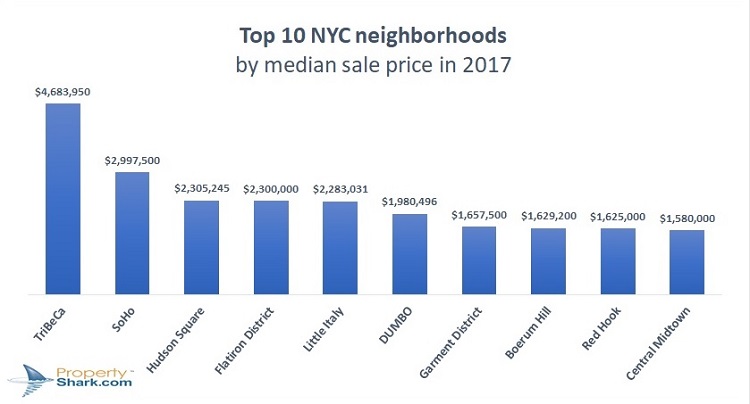
Check out the complete top 10 list below:
DUMBO is Brooklyn’s most expensive neighborhoods
Brooklyn continued a strong performance in 2017, providing 22 of the city’s most expensive neighborhoods – just 2 fewer than Manhattan. In fact, 3 of NYC’s 10 priciest neighborhoods are located in Brooklyn – DUMBO at #6, Boerum Hill at #8 and Red Hook at #9 . With a median price of $1,980,496, DUMBO is Brooklyn’s #1 most expensive neighborhood, although it slid one position compared to 2016, outpaced by the Flatiron District’s 19% median price growth.
Currently Brooklyn’s 2nd priciest neighborhood, Boerum Hill improved its positions thanks to a large volume of sales, mostly in newly launched luxury developments. Also ranking as New York’s #8 most expensive neighborhood, Boerum Hill closes 2017 with a $1,629,200 median sale price, registering a 52% year-over-year increase, the 4th highest in the city. This is in large part thanks to the neighborhood’s high sales activity this year, mostly in new-to-the-market luxury condominiums, such as The Boerum and 465 Pacific Street.
Overall, Boerum Hill closed 249 transactions in 2017, well over last year’s 83. Of these, 130 closed at The Boerum, where units sold at a median of $1.78 million. 34 additional properties traded at 465 Pacific Street with a median of $2 million. In total, The Boerum and 465 Pacific Street accounted for 164 deals with a median sale value of $1.83 million, heavily skewing historic Boerum Hill averages.
Fort Greene sees median nearly double at 95% growth rate, Red Hook follows suite
Brooklyn also delivered Fort Greene, the New York neighborhood with the highest median price growth rate. Ending 2017 with a median sale price of $1,075,000, Fort Greene saw its 2017 levels jump a whopping 95%, almost doubling year-over-year. Fort Greene also marks this year’s most significant change in position, jumping from #88 in 2016 to its current #27 spot – tied with Manhattan’s Chelsea.
However, it bears noting that sale price medians in Fort Greene have been significantly boosted by newly launched luxury and ultra-luxury developments, similarly to Boerum Hill. Of the neighborhood’s 97 total sales this year, 12 properties traded at 38 Vanderbilt Avenue with a median of $2.2 million. An additional 9 properties traded at 1 Hanson Place, with a jaw-dropping median of $15 million. Red Hook’s 34% median price appreciation was also boosted by new developments.
Ranking 16th the previous year, Brooklyn’s Red Hook climbed into the top 10 in 2017, landing at #9 with a median price of $1,625,000. Of the 21 transactions registered this year, more than a third took place at a new townhouse development at 74-84 Sullivan Street and 109-125 King Street where the median sits at $2.63 million.
Queens continues to show promise, two neighborhoods pass $1M median
When it comes to Queens, the increasingly expensive borough saw 8 of its neighborhoods rank among the city’s 50 most expensive, albeit mostly in the bottom half of that chart. Boasting a median sale price of $1,083,750, Malba is the #1 most expensive neighborhood in Queens, and the 25th priciest in New York. Although closing only 14 sales, Malba saw its median jump 11% year-over-year, bringing its rank up by 3 positions from last year’s #28.
Queens’ Hunters Point also passed the $1 million mark, reaching $1,061,382 after a 13% year-over-year median price growth. Tied at #37 Queensboro Hill and Neponsit also trended towards the $1 million mark. Both reached a $900,000 median sale price, following median price increase of 15% and 6% respectively.
You can see the full ranking in the table below:
| No. | Borough | Neighborhood | Median Sale Price | 2017 vs 2016 | Transactions |
|---|---|---|---|---|---|
| 1 | Manhattan | TriBeCa | $4,683,950 | 12% | 417 |
| 2 | Manhattan | SoHo | $2,997,500 | -13% | 150 |
| 3 | Manhattan | Hudson Square | $2,305,245 | 0% | 85 |
| 4 | Manhattan | Flatiron District | $2,300,000 | 19% | 460 |
| 5 | Manhattan | Little Italy | $2,283,031 | -6% | 26 |
| 6 | Brooklyn | DUMBO | $1,980,496 | 0% | 143 |
| 7 | Manhattan | Garment District | $1,657,500 | -4% | 26 |
| 8 | Brooklyn | Boerum Hill | $1,629,200 | 52% | 249 |
| 9 | Brooklyn | Red Hook | $1,625,000 | 34% | 21 |
| 10 | Manhattan | Central Midtown | $1,580,000 | 22% | 310 |
| 11 | Manhattan | Financial District | $1,501,500 | 53% | 566 |
| 12 | Manhattan | Central Park South | $1,450,000 | 05% | 70 |
| 13 | Brooklyn | Gowanus | $1,355,000 | 4% | 56 |
| 14 | Manhattan | Greenwich Village | $1,350,000 | -24% | 436 |
| 15 | Brooklyn | Manhattan Beach | $1,300,000 | 40% | 33 |
| 16 | Manhattan | West Village | $1,260,000 | -1% | 253 |
| 17 | Brooklyn | Brooklyn Heights | $1,240,000 | 19% | 248 |
| 18 | Manhattan | Theatre District - Times Square | $1,235,000 | -25% | 87 |
| 19 | Manhattan | Upper West Side | $1,226,500 | 16% | 2097 |
| 20 | Manhattan | Upper East Side | $1,153,373 | 2% | 2537 |
| 21 | Brooklyn | Park Slope | $1,120,038 | 15% | 498 |
| 22 | Manhattan | Clinton - Hell's Kitchen | $1,120,000 | 12% | 523 |
| 23 | Brooklyn | Vinegar Hill | $1,107,500 | 70% | 8 |
| 24 | Manhattan | Battery Park City | $1,095,000 | -11% | 165 |
| 24 | Brooklyn | Columbia Street Waterfront District | $1,095,000 | 30% | 32 |
| 25 | Queens | Malba | $1,083,750 | 11% | 14 |
| 26 | Brooklyn | Carroll Gardens | $1,079,345 | -12% | 65 |
| 27 | Manhattan | Chelsea | $1,075,000 | -1% | 567 |
| Brooklyn | Fort Greene | $1,075,000 | 95% | 97 | |
| 28 | Queens | Hunters Point | $1,061,382 | 13% | 178 |
| 29 | Brooklyn | Cobble Hill | $1,025,000 | 3% | 71 |
| 30 | Brooklyn | Prospect Park South | $995,000 | 48% | 25 |
| 31 | Manhattan | Gramercy Park | $980,833 | 3% | 306 |
| 32 | Brooklyn | Greenwood Heights | $979,500 | 18% | 62 |
| 33 | Manhattan | East Village | $975,000 | 3% | 249 |
| 34 | Manhattan | Sutton Place | $930,000 | -4% | 268 |
| 35 | Brooklyn | Fiske Terrace | $929,000 | 11% | 13 |
| 36 | Brooklyn | Williamsburg | $916,425 | 5% | 597 |
| 37 | Queens | Queensboro Hill | $900,000 | 15% | 36 |
| Queens | Neponsit | $900,000 | 6% | 15 | |
| 38 | Brooklyn | Mill Basin | $893,750 | -3% | 46 |
| 39 | Manhattan | Turtle Bay | $893,700 | -10% | 396 |
| 40 | Brooklyn | Prospect Heights | $892,000 | 8% | 375 |
| 41 | Brooklyn | Greenpoint | $890,969 | -3% | 141 |
| 42 | Brooklyn | Dyker Heights | $890,000 | 13% | 73 |
| 43 | Queens | Ditmars - Steinway | $865,000 | 11% | 25 |
| 44 | Manhattan | Civic Center | $841,944 | 20% | 16 |
| 45 | Queens | Belle Harbor | $840,260 | 12% | 34 |
| 46 | Manhattan | Lower East Side | $832,500 | 3% | 176 |
| 47 | Manhattan | Roosevelt Island | $825,000 | -4% | 45 |
| 48 | Brooklyn | Downtown Brooklyn | $820,000 | -1% | 153 |
| 49 | Queens | East Flushing | $810,000 | 13% | 99 |
| Queens | Fresh Meadows | $810,000 | 7% | 155 | |
| 50 | Brooklyn | Bedford-Stuyvesant | $799,000 | 11% | 255 |
Methodology:
The median sale prices were calculated based on residential property sales closed between January 1st, 2017 and December 6th, 2017. The residential properties included in the stats are single-family homes, condos and co-ops.
The boundaries to some of the neighborhoods in Manhattan have been changed from previous studies. Therefore, data on several small neighborhoods is now included in stats for larger areas. For example, NoLita is now included in Little Italy; NoHo is included in Greenwich Village; Carnegie Hill, Lenox Hill and Yorkville are included in the Upper East Side, and Forest Hills Gardens is now incorporated in Forest Hills.
Want to stay on top of the real estate market?
Access comprehensive property data and ownership information with intuitive research tools.
POSTED IN: Brooklyn Real Estate, Manhattan Real Estate

Eliza Theiss is a senior writer reporting real estate trends in the US. Her work has been cited by CBS News, Curbed, The Los Angeles Times, and Forbes among others. With an academic background in journalism, Eliza has been covering real estate since 2012. Before joining PropertyShark, Eliza was an associate editor at Multi-Housing News and Commercial Property Executive. She has also contributed extensively to CommercialEdge. Reach her at [email protected]
Recent Reports

World Cup or Your Mortgage/Rent? Ticket Prices Rival Host City Housing Costs
World Cup ticket prices rival monthly housing expenses in the 11 U.S. host cities, with even the cheapest seats covering weeks or even months of rent or mortgage payments.

Locked-In Owners, Mobile Renters: Homeowners Stay Put as Renters Move 3.7x More Across Largest U.S. Cities
Renters became the primary drivers of long-distance mobility across the largest U.S. cities, moving 3.7 times more than owners in 2024, as high mortgage rates and housing costs kept many homeowners in place.

$4.6M Hudson Yards Maintains Top Spot, Luxury Sales in Malba Set $2.5M Price Record for Queens
Despite prices declining, Hudson Yards remained the most expensive NYC neighborhood, but TriBeCa’s growth closed the gap to under $400,000, while Malba set a new historic price record for Queens at $2.5 million, securing the highest ranking ever for the borough at #5.