
RELEASED ON July 13, 2017
TriBeCa Still #1 Most Expensive NYC Neighborhood
Andra Rus | 5 minute read
Following a period of stabilization, the second quarter of 2017 brought a period of renewed price growth to some areas of New York City, particularly to its most expensive neighborhoods. Median sale prices trended upwards in most of the city’s 50 most expensive neighborhoods. Only 11 areas saw prices slide in Q2, a significant change from Q1, when 20 neighborhoods saw median sale prices trend downwards. Maintaining its #1 position from a year ago, TriBeCa’s median sale price continued to grow, expanding 24% compared to Q2 2016. As sales activity also increased year-over-year, the landmark New York neighborhood finished the second quarter with a $5,175,000 median sale price. The Financial District reshuffled the city’s top 10 most expensive neighborhoods, becoming New York City’s #6 most pricey neighborhood. Following a whopping 88% year-over-year increase, the Financial District’s median sale price surged to $1,900,000. Luxury developments such as 50 West Street contributed very significantly to the District’s dizzying climb – high-priced units here have inspired a veritable feeding frenzy in the city’s tight real estate market. The city’s most remarkable price expansion came from Brooklyn, in Fort Greene as median sale prices ballooned by a jaw-dropping 151%. Barely making the city’s top 100 priciest neighborhoods at #97 in 2016, the…
Following a period of stabilization, the second quarter of 2017 brought a period of renewed price growth to some areas of New York City, particularly to its most expensive neighborhoods. Median sale prices trended upwards in most of the city’s 50 most expensive neighborhoods. Only 11 areas saw prices slide in Q2, a significant change from Q1, when 20 neighborhoods saw median sale prices trend downwards.
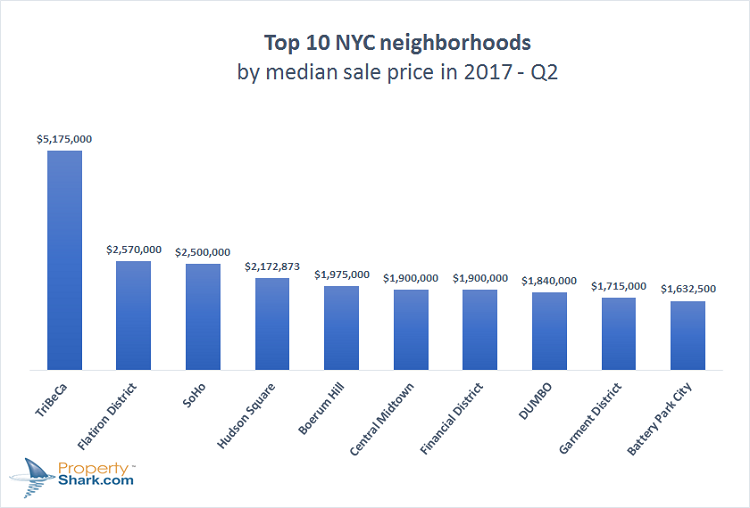
Maintaining its #1 position from a year ago, TriBeCa’s median sale price continued to grow, expanding 24% compared to Q2 2016. As sales activity also increased year-over-year, the landmark New York neighborhood finished the second quarter with a $5,175,000 median sale price.
The Financial District reshuffled the city’s top 10 most expensive neighborhoods, becoming New York City’s #6 most pricey neighborhood. Following a whopping 88% year-over-year increase, the Financial District’s median sale price surged to $1,900,000. Luxury developments such as 50 West Street contributed very significantly to the District’s dizzying climb – high-priced units here have inspired a veritable feeding frenzy in the city’s tight real estate market.
The city’s most remarkable price expansion came from Brooklyn, in Fort Greene as median sale prices ballooned by a jaw-dropping 151%. Barely making the city’s top 100 priciest neighborhoods at #97 in 2016, the historic South Brooklyn neighborhood saw median sale prices jump from just $451,612, to $1,135,000 over the past 12 months, landing at #18.
Brooklyn maintained 2 neighborhoods among the city’s top 10 most expensive, even if median sale prices have started trending towards more established levels. Sales activity cooled off at several luxury developments which artificially inflated median prices in Q1, but other areas continued to experience fast-paced and high-priced sales.
Boerum Hill was barely the city’s 46th priciest neighborhood in early 2016. Now, with a median sale price of $1,975,000, Boerum Hill ranks as the 5th most expensive neighborhood in New York City, as high-end condominiums such as The Boerum continue to see rapid sales in their luxury inventory. Overall, the priciest neighborhood in Brooklyn experienced a 51% growth in the median sale price in the past 12 months.
Overall, Manhattan still holds the highest number of the city’s priciest neighborhoods with 24, with Brooklyn coming in a close second with 23, and Queens being home to 7. Manhattan, however, still dominates NYC’s top 10 most expensive neighborhoods, regaining two spots from Brooklyn from the previous quarter.
Keep reading to find out which were New York City’s 10 most expensive neighborhoods in the second quarter of 2017. Be sure to scroll down to the end, and check out the full Top 50 Most Expensive Neighborhoods in New York City.
#10. Greenwich Village
Median sale price: $1,400,000
Number of transactions: 140
New York City’s 10th most expensive neighborhood, Greenwich Village’s white-hot real estate market has cooled down. The first quarter of 2017 saw median prices here slip to $1,459,612. The downwards trend continued into Q2 2017, as median prices slipped further, reaching $1,400,000 – a far cry from the year-ago figure of $2,038,260.
#9. Battery Park City
Median sale price: $1,632,500
Number of transactions: 46
Following a rocky first quarter that saw prices slashed by 48% in Battery Park City, the southern Manhattan neighborhood bounced back in the Q2, with the median sale price clocking in at $1,632,500. Compared to the second quarter of 2016, the 71% price gain brought Battery Park City up from #27 to New York City’s top 10 most expensive neighborhoods.
#8. Garment District
Median sale price: $1,715,000
Number of transactions: 9
With only 9 sales registered in the first quarter of this year, the Garment District has managed to lift up its median price to $1,715,000 – an almost $300,000 gain over Q1, when year-over-year price appreciation bottomed at negative 48%. The second quarter of 2017 however, pushed prices 8% over year-ago values.
#7. DUMBO
Median sale price: $1,840,000
Number of transactions: 37
One of only two Brooklyn neighborhoods in New York City’s top 10 most expensive neighborhoods, DUMBO gained 19% in median price levels in the second quarter compared to the same period in 2016. Quarter-over-quarter, however, DUMBO’s real estate market cooled off, stabilizing after a feverish first quarter for luxury sales.
Fueled by a wave of high-priced condo developments that hit the market in early 2017, DUMBO saw 55 transactions. Many of these were closed at luxury condo developments such as 51 Jay Street, where units range between $1 million and $6 million. In Q2, however, neighborhood sales activity trended towards more balanced territory, with 37 completed transactions.
#6. Central Midtown
Median sale price: $1,900,000
Number of transactions:111
Tying with the Financial District as NYC’s 6th priciest neighborhood, Central Midtown has made a comeback. After median prices slipped throughout 2016 and bottomed at $1,287,500 early this year, the second quarter saw sales activity double, pushing median prices up. In fact, Central Midtown’s new median is 41% higher than the year-ago figure.
#6. Financial District
Median sale price: $1,900,000
Number of transactions: 151
Also ranking as NYC’s 6th most expensive neighborhood, the Financial District’s median price jumped a whopping 88% over Q2 2016. This followed the neighborhood’s 78% year-over-year price appreciation registered in Q1 of 2017. Jumping from #21 in Q2 2016 to, #9 in Q1 of the current year, the Financial District’s new median home value has been pushed up by dynamic sales activity in new condo developments in the formerly commercial neighborhood.
#5. Boerum Hill
Median sale price: $1,975,000
Number of transactions: 61
Boerum Hill continued its rapid rise among the city’s priciest neighborhoods, climbing three spots quarter-over-quarter with an over $270,000 growth in the median price. Only the 46th most expensive New York neighborhood in early 2016, Boerum Hill saw a bevy of luxury condo developments go live, artificially inflating median price levels. Sleek luxury high-rises like The Boerum elevated the median sale price by 51% year-over-year, it clocked in at $1,975,000 for the second quarter of 2017, making this neighborhood Brooklyn’s most expensive.
#4. Hudson Square
Median sale price: $2,172,873
Number of transactions: 26
Hudson Square continued to slip downwards, with the median sale price dropping 3% year-over-year for the second consecutive quarter. Compared to early 2017, however, Hudson Square sale prices dropped even further – the second quarter’s $2,172,873 median sale price is significantly lower than the $2,529,000 median registered in Q1, despite sales activity remaining virtually unchanged.
#3. SoHo
Median sale price: $2,500,000
Number of transactions: 39
Although still one of the most expensive neighborhoods in New York City, SoHo’s real estate market has been going through a period of stabilization. The city’s priciest neighborhood in early 2016 – with a median sale price above the $4 million mark – iconic SoHo’s median price weakened 22% year-over-year in Q2 2017, following a 17% year-over-year depreciation in the first quarter. The second quarter’s small increase in sales over Q1, however, didn’t stop SoHo from seeing the median sale price slide by more than $880,000.
#2 Flatiron District
Median sale price: $2,570,000
Number of transactions: 135
Year-over-year, this neighborhood’s median price has expanded by 12%, making the dynamic Flatiron District the city’s 2nd most expensive neighborhood, despite somewhat weakened sales activity – 135 transactions in Q2 2017, compared to 152 in Q2 2016. Once the playground of photographers thanks to cheap housing, the Flatiron District now boasts a $2,570,000 median sale price – up by close to $500,000 quarter-to-quarter.
#1. TriBeCa
Median sale price: $5,175,000
Number of transactions: 136
Residential prices in trendy TriBeCa continued to rise in the second quarter, gaining close to $100,000 compared to Q1. Year-over-year, median homes prices appreciated by 24% in the landmark Manhattan neighborhood. Ranking as the #1 most expensive neighborhood in New York City, TriBeCa’s median sale price hit a whopping $5,175,000 in Q2, while quarter-to-quarter sales activity remained relatively unchanged.
| No | Borough | Neighborhood | Median Sale Price | Q1 vs Q2 2016 | Transactions |
|---|---|---|---|---|---|
| 1 | Manhattan | TriBeCa | $5,175,000 | 24% | 136 |
| 2 | Manhattan | Flatiron District | $2,570,000 | 12% | 135 |
| 3 | Manhattan | SoHo | $2,500,000 | -22% | 39 |
| 4 | Manhattan | Hudson Square | $2,172,873 | -3% | 26 |
| 5 | Brooklyn | Boerum Hill | $1,975,000 | 51% | 61 |
| 6 | Manhattan | Central Midtown | $1,900,000 | 41% | 111 |
| Manhattan | Financial District | $1,900,000 | 88% | 151 | |
| 7 | Brooklyn | DUMBO | $1,840,000 | 19% | 37 |
| 8 | Manhattan | Garment District | $1,715,000 | 8% | 9 |
| 9 | Manhattan | Battery Park City | $1,632,500 | 71% | 46 |
| 10 | Manhattan | Greenwich Village | $1,400,000 | -31% | 140 |
| 11 | Brooklyn | Manhattan Beach | $1,322,500 | 7% | 12 |
| 12 | Brooklyn | Prospect - Lefferts Gardens | $1,260,000 | 64% | 11 |
| 13 | Manhattan | Chelsea | $1,257,500 | 7% | 138 |
| 14 | Manhattan | West Village | $1,250,000 | -2% | 67 |
| Brooklyn | Park Slope | $1,250,000 | 27% | 125 | |
| 15 | Brooklyn | Gowanus | $1,238,000 | 26% | 16 |
| 16 | Manhattan | Theatre District - Times Square | $1,225,000 | 6% | 46 |
| 17 | Manhattan | Upper East Side | $1,200,000 | 9% | 641 |
| 18 | Manhattan | Upper West Side | $1,197,000 | 17% | 496 |
| 19 | Brooklyn | Fort Greene | $1,135,000 | 151% | 32 |
| 20 | Brooklyn | Brooklyn Heights | $1,120,000 | 35% | 64 |
| 21 | Brooklyn | Greenwood Heights | $1,075,000 | 38% | 14 |
| 22 | Manhattan | Sutton Place | $1,050,000 | 14% | 69 |
| 22 | Manhattan | East Village | $1,050,000 | 8% | 71 |
| 22 | Manhattan | Roosevelt Island | $1,050,000 | 69% | 13 |
| 23 | Brooklyn | Greenpoint | $1,022,500 | 35% | 32 |
| 24 | Manhattan | Clinton - Hell's Kitchen | $998,500 | 0% | 129 |
| 25 | Manhattan | Gramercy Park | $994,169 | -22% | 83 |
| 26 | Queens | Hunters Point | $977,645 | 6% | 46 |
| 27 | Brooklyn | Carroll Gardens | $951,397 | -17% | 14 |
| 28 | Queens | Queensboro Hill | $950,000 | 20% | 7 |
| 29 | Brooklyn | Mill Basin | $920,000 | 4% | 18 |
| 30 | Brooklyn | Dyker Heights | $916,250 | 13% | 26 |
| 31 | Brooklyn | Prospect Heights | $889,948 | -2% | 120 |
| 32 | Brooklyn | Downtown Brooklyn | $877,000 | -3% | 44 |
| 33 | Brooklyn | Williamsburg | $865,513 | 9% | 160 |
| 34 | Manhattan | Harlem | $865,000 | 37% | 123 |
| 35 | Brooklyn | Windsor Terrace | $850,000 | 48% | 21 |
| 36 | Queens | Belle Harbor | $845,260 | 14% | 10 |
| 37 | Manhattan | Lower East Side | $837,500 | 5% | 42 |
| 38 | Brooklyn | Clinton Hill | $827,310 | 20% | 68 |
| 39 | Manhattan | Chinatown | $825,000 | 8% | 12 |
| 40 | Queens | Fresh Meadows | $815,000 | 9% | 44 |
| 41 | Queens | East Flushing | $810,000 | 42% | 32 |
| 42 | Brooklyn | Cobble Hill | $800,000 | -25% | 21 |
| 43 | Brooklyn | Bushwick | $795,000 | 41% | 19 |
| 44 | Queens | Hollis Hills | $788,000 | 9% | 15 |
| 45 | Manhattan | Murray Hill | $785,000 | 10% | 187 |
| 46 | Brooklyn | Borough Park | $782,072 | 16% | 63 |
| 47 | Manhattan | Turtle Bay | $765,000 | -8% | 93 |
| 48 | Brooklyn | Bedford-Stuyvesant | $762,669 | -3% | 57 |
| 49 | Brooklyn | Madison | $755,000 | 45% | 23 |
| 50 | Queens | Ditmars - Steinway | $720,000 | 13% | 7 |
Check out The most expensive neighborhoods in NYC in Q1 2017 and the 2016 Top most expensive NYC neighborhoods: Q1 and Q3.
Methodology:
The median sale prices were calculated based on residential property sales closed between April 1, 2017 and June 30, 2017. The residential properties included in the stats are single-family homes, condos and coops.
The boundaries to some of the neighborhoods in Manhattan have been changed from previous studies. Therefore, data on several small neighborhoods is now included in stats for larger areas. For example, NoLita is now included in Little Italy; NoHo in Greenwich Village; Carnegie Hill, Lenox Hill, Yorkville are included in the Upper East Side.
Want to stay on top of the real estate market?
Access comprehensive property data and ownership information with intuitive research tools.
POSTED IN: Market Studies, New York Real Estate

With 10+ years of experience at PropertyShark, Andra covers the latest product updates and market reports for our blog. Her work has been featured in The Real Deal, Curbed, TimeOut, The Daily Mail, Business Insider, Crain’s New York.
Recent Reports

2026 Q2 Foreclosure Report: Bronx Caseload Hits 7-Year High, Brooklyn & Manhattan Slow to 4-Year Low
Manhattan yet again slowed to become the city’s least active foreclosure market, Brooklyn’s caseload dropped so low it barely edged out Staten Island, while the Bronx heated up enough to surpass all boroughs except Queens.

NYC Resale Gains & Losses: Every Borough Made Money in 2025, Except Manhattan
In 2025, NYC home-sellers mostly made money. But, in Manhattan, resales came with losses — and it was apartments and recent buyers that absorbed them.

World Cup or Your Mortgage/Rent? Ticket Prices Rival Host City Housing Costs
World Cup ticket prices rival monthly housing expenses in the 11 U.S. host cities, with even the cheapest seats covering weeks or even months of rent or mortgage payments.