
Uncategorized | 5 minute read
Brooklyn Home to Four of NYC’s Top 10 Priciest Neighborhoods
BY Andra Rus | Apr 11, 2017
With the verticality of New York City’s real estate prices, headline-making residential sales are a common occurrence for the city that never sleeps. Even with current market conditions – call them stabilizing, cooling or correcting – many of the Big Apple’s neighborhoods are posting dizzyingly high prices.
As the first quarter of 2017 came to end, we were curious to find out just how hot – or not – New York City’s real estate market was at the beginning of the new year.
Although 20 of the city’s 50 most expensive neighborhoods noted year-over-year median sale prices trending downwards, several neighborhoods saw prices explode. Largely due to a sales surge in new developments, Brooklyn boasts 4 of New York City’s 10 most expensive neighborhoods, marking one of its strongest first quarters in years.
Brooklyn Heights saw the greatest price appreciation in the city at 127% year-over-year, followed by Boerum Hill with 104% and DUMBO with 76%. While Brooklyn is certainly an attractive market for homeowners and investors, price trend indicators in the borough’s hottest neighborhoods, were skewed by a wave of closed sales, especially in new developments such as Pierhouse.
Boerum Hill, for example, registered 93 of its 139 first quarter sales in The Boerum, while out of DUMBO’s 55 sales, 31 transactions closed at 51 Jay Street. Closed sale prices at this DUMBO luxury condo development start at the $1 million mark and go as high as $5,995,000 for a penthouse.
Manhattan dominates with 6 neighborhoods in our Top 10 and 23 spots in our Top 50. Thanks to a 55% year-over-year price appreciation that pushed its median sale price above the $5 million mark, TriBeCa marked its second consecutive quarter as the most expensive neighborhood in NYC.
Although Manhattan remains firmly entrenched as the leader in pricey New York City real estate, the borough did experience significant price drops in a number of neighborhoods – most notably the Garment District and Battery Park City, both of which saw median home prices chopped by 48%.
Keep reading to discover which were New York City’s 10 most expensive neighborhoods in the first quarter of 2017. Be sure to scroll down to the end to see the full Top 50.
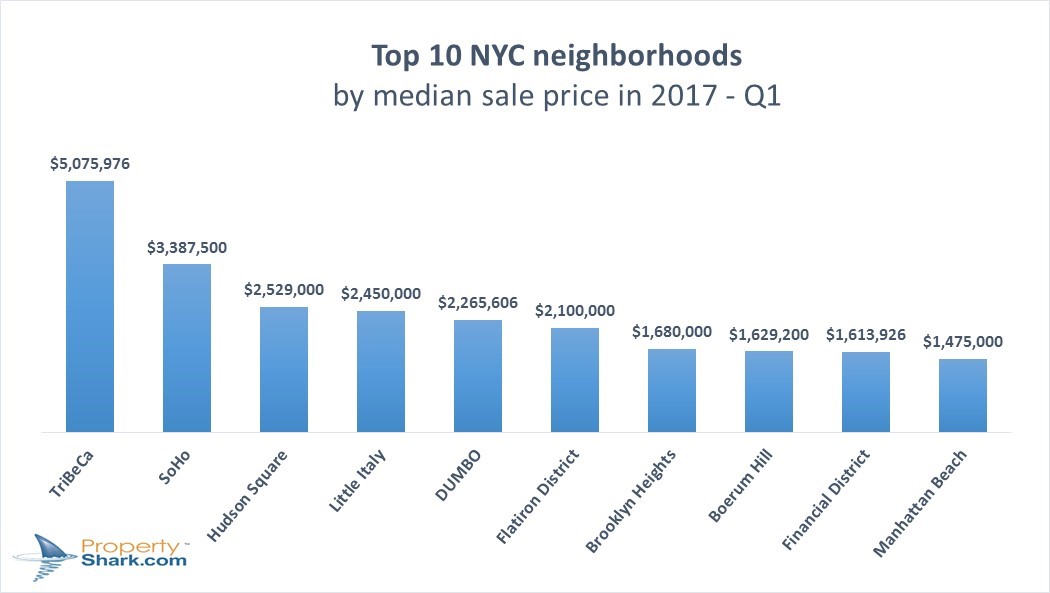
#10. Manhattan Beach
Median sale price: $1,475,000
Number of transactions: 9
The childhood home of Darren Aronofsky reentered the most expensive New York City neighborhoods hall of fame with a whopping 56% price expansion compared to 2016. Although Manhattan Beach only saw 9 sales close in the first quarter, the high-ticket transactions pushed this Brooklyn neighborhood’s median sale price to $1,475,000.
#9. Financial District
Median sale price: $1,613,926
Number of transactions: 185
Growing in popularity as a residential destination for a few years now, FiDi is pricing out many potential buyers with its new median home price of $1,613,926. Climbing up from its previous position at #35, the Financial District saw its median sale price jump by a spectacular 76% in the early months of the new year. A significant factor in this price jump was the wave of closings at 50 West, which registered 53 of the neighborhoods 185 sales.
#8. Boerum Hill
Median sale price: $1,629,200
Number of transactions: 139
Ranking only 46th among New York’s priciest neighborhoods last year, Boerum Hill made its way into our Top 10 thanks to a spectacular 104% price appreciation. This is in large part due to a significant number of transactions closing in Q1 in pricey new developments such as The Boerum, the swanky new skyscraper signed by starchitect Helmut Jahn.
#7. Brooklyn Heights
Median sale price: $1,680,000
Number of transactions: 76
Only the 56th most expensive NYC neighborhood in 2016, Brooklyn Heights is yet another new entry in our Top 10. Boasting the largest price expansion in the city, its 127% year-over-year price boom is also a result of new luxurious developments experiencing strong first quarter sales, like the swanky – yet controversial Pierhouse at 90 Furman Street. The median home price in Brooklyn Heights now clocks in at $1,680,000 after 76 transactions closed in Q1 of this year.
#6. Flatiron District
Median sale price: $2,100,000
Number of transactions: 113
One of the busiest New York City neighborhoods, the Flatiron District saw residential price growth slow down from its EOY 10% to 2% in the first quarter of 2017. The pace of transactions registered here remained steady though, with 113 sales registered in Q1 2017 compared to the year ago figure of 115.
#5. DUMBO
Median sale price: $2,265,606
Number of transactions: 55
The priciest Brooklyn neighborhood, DUMBO, kicked off the new year in style, posting a $2,265,606 median sale price – an 87% price jump compared to the year-ago figure. Residential real estate has stayed hot in tech-centric DUMBO over the past 3 quarters, allowing the trendy neighborhood to consistently outprice pricey Manhattan perennials such as Greenwhich Village, Chelsea and the Theatre District – Times Square area.
#4. Little Italy
Median sale price: $2,450,000
Number of transactions: 13
With only 13 transactions closed in Q1 and a 6% median price depreciation, Little Italy slid off its year-ago podium ranking. However, boasting some of the best bars, restaurants and shopping in the city, Little Italy real estate is still some of the priciest in all 5 boroughs, with the median home price clocking in at $2.45 million.
#3. Hudson Square
Median sale price: $2,529,000
Number of transactions: 23
Switching places with Little Italy, Hudson Square now ranks as the 3rd most expensive neighborhood in New York City, despite a 3% percent year-over-year price contraction. Median home prices have stayed consistently pricey in the Lower Manhattan neighborhood following the 2013 rezoning that has allowed for a bevy of new developments to spring up. Boasting a buzzing media industry and the Charlton-King-Vandam Historic District with its gorgeous Greek Revival and Federal style homes, it’s no surprise that the median home price here passes the $2.5 million threshold.
#2. SoHo
Median sale price: $3,387,500
Number of transactions: 36
One of the most iconic NYC neighborhoods, SoHo boasts some of the priciest real estate in the U.S. – in fact, 10013, which covers parts of TriBeCa, SoHo and Hudson Square, is the 3rd most expensive zip code in the country. While the median home price did contract by 17% in Q1 compared to 2016 figures, trendy SoHo still easily hit a median sale price of $3,387,500.
#1. TriBeCa
Median sale price: $5,075,976
Number of transactions: 143
With an impressive price expansion of 55%, TriBeCa continues to reign supreme as the #1 most expensive New York City neighborhood. After jumping the $4 million mark in 2016, TriBeCa kicked off 2017 with a bang, registering 143 sales that pushed the median home price to a dizzying $5,075,976. With its otherworldly prices and trendy lifestyle, it’s no surprise that it’s home to many of the biggest names in the entertainment and sports industries.
Check below the full list of the 50 most expensive neighborhoods in New York City:
| No. | Borough | Neighborhood | Median sale price | Q1 2017 vs Q1 2016 |
|---|---|---|---|---|
| 1 | Manhattan | TriBeCa | $5,075,976 | 55% |
| 2 | Manhattan | SoHo | $3,387,500 | -17% |
| 3 | Manhattan | Hudson Square | $2,529,000 | -3% |
| 4 | Manhattan | Little Italy | $2,450,000 | -6% |
| 5 | Brooklyn | DUMBO | $2,265,606 | 87% |
| 6 | Manhattan | Flatiron District | $2,100,000 | 2% |
| 7 | Brooklyn | Brooklyn Heights | $1,680,000 | 127% |
| 8 | Brooklyn | Boerum Hill | $1,629,200 | 104% |
| 9 | Manhattan | Financial District | $1,613,926 | 76% |
| 10 | Brooklyn | Manhattan Beach | $1,475,000 | 56% |
| 11 | Manhattan | Greenwich Village | $1,459,612 | -32% |
| 12 | Brooklyn | Gowanus | $1,428,550 | 44% |
| 13 | Brooklyn | Prospect - Lefferts Gardens | $1,363,665 | 3% |
| 14 | Manhattan | Theatre District - Times Square | $1,340,000 | -44% |
| 15 | Brooklyn | Cobble Hill | $1,312,500 | 32% |
| 16 | Manhattan | Central Midtown | $1,287,500 | -22% |
| 17 | Manhattan | West Village | $1,231,000 | -16% |
| 18 | Manhattan | Chelsea | $1,174,500 | 46% |
| 19 | Manhattan | Garment District | $1,147,080 | -48% |
| 20 | Manhattan | Clinton - Hell's Kitchen | $1,140,000 | 14% |
| 21 | Manhattan | Upper East Side | $1,100,000 | -6% |
| 22 | Manhattan | Upper West Side | $1,088,500 | 3% |
| 23 | Manhattan | Turtle Bay | $1,060,000 | -9% |
| 24 | Manhattan | Battery Park City | $1,058,495 | -48% |
| 25 | Brooklyn | Carroll Gardens | $1,000,000 | -13% |
| 26 | Brooklyn | Park Slope | $987,000 | 6% |
| 27 | Manhattan | Bowery | $975,000 | -27% |
| 28 | Queens | Hunters Point | $973,956 | 10% |
| 29 | Brooklyn | Williamsburg | $970,000 | 20% |
| 30 | Manhattan | Sutton Place | $955,038 | -15% |
| 31 | Brooklyn | Greenwood Heights | $950,000 | 16% |
| 32 | Queens | Broadway - Flushing | $940,000 | 21% |
| 33 | Brooklyn | Fiske Terrace | $925,750 | - |
| 34 | Queens | Queensboro Hill | $922,500 | 30% |
| 35 | Manhattan | East Village | $886,712 | 12% |
| 36 | Manhattan | Gramercy Park | $875,000 | 9% |
| 37 | Brooklyn | Prospect Heights | $855,500 | 14% |
| 38 | Queens | Kissena Park | $853,000 | -4% |
| 39 | Queens | Ditmars - Steinway | $832,500 | 13% |
| 40 | Brooklyn | Columbia Street Waterfront District | $830,000 | -39% |
| 41 | Brooklyn | Dyker Heights | $815,000 | 8% |
| 42 | Queens | Auburndale | $802,500 | 15% |
| 43 | Brooklyn | Bedford-Stuyvesant | $800,000 | 7% |
| Manhattan | Lower East Side Manhattan | $800,000 | -5% | |
| 44 | Manhattan | Roosevelt Island | $794,208 | -19% |
| 45 | Queens | Fresh Meadows | $785,000 | 7% |
| 46 | Queens | Belle Harbor | $770,000 | 3% |
| 47 | Brooklyn | Madison | $765,000 | 34% |
| 48 | Brooklyn | Mill Basin | $757,500 | -27% |
| 49 | Brooklyn | Greenpoint | $747,224 | -12% |
| 50 | Brooklyn | Borough Park | $738,231 | 17% |
Check out the 2016 Top most expensive NYC neighborhoods: Q1 and Q3.
Methodology:
The median sale prices were calculated based on residential property sales closed between January 1, 2017 and March 31, 2017. The residential properties included in the stats are single-family homes, condos and coops.
The boundaries to some of the neighborhoods in Manhattan have been changed from previous studies. Therefore, data on several small neighborhoods is now included in stats for larger areas. For example, NoLita is now included in Little Italy; NoHo in Greenwich Village; Carnegie Hill, Lenox Hill, Yorkville are included in the Upper East Side.
Latest Posts
Want to stay on top of the real estate market?
Access comprehensive property data and ownership information with intuitive research tools.
POSTED IN: Uncategorized

With 10+ years of experience at PropertyShark, Andra covers the latest product updates and market reports for our blog. Her work has been featured in The Real Deal, Curbed, TimeOut, The Daily Mail, Business Insider, Crain’s New York.
Recent Reports

2026 Q2 Foreclosure Report: Bronx Caseload Hits 7-Year High, Brooklyn & Manhattan Slow to 4-Year Low
Manhattan yet again slowed to become the city’s least active foreclosure market, Brooklyn’s caseload dropped so low it barely edged out Staten Island, while the Bronx heated up enough to surpass all boroughs except Queens.

NYC Resale Gains & Losses: Every Borough Made Money in 2025, Except Manhattan
In 2025, NYC home-sellers mostly made money. But, in Manhattan, resales came with losses — and it was apartments and recent buyers that absorbed them.

World Cup or Your Mortgage/Rent? Ticket Prices Rival Host City Housing Costs
World Cup ticket prices rival monthly housing expenses in the 11 U.S. host cities, with even the cheapest seats covering weeks or even months of rent or mortgage payments.