

RELEASED ON July 19, 2018
TriBeCa, SoHo Still Most Expensive Neighborhoods in New York City, but DUMBO Gains Ground With 37% Price Increase
Eliza Theiss | 4 minute read
Key Takeaways: TriBeCa entrenched as #1 most expensive neighborhood in NYC, despite 26% Y-o-Y price drop With a $2.95 million median sale price, SoHo remains firmly in second place Brooklyn’s Homecrest sees sharpest median sale price increase at 80% At #3, DUMBO is Brooklyn’s priciest neighborhood The Upper East Side is NYC’s most active neighborhood sales market with 600 transactions, followed closely by the Upper West Side with 579 residences sold Two Queens neighborhoods hit the $1 million mark The second quarter of 2018 saw fairly balanced market conditions in New York City’s top 50 most expensive neighborhoods – 24 of them experienced price growth, while the same number saw median sale prices trend downwards. Furthermore, compared to year-ago figures, almost no neighborhoods among the city’s most expensive saw massive hikes, or steep drops in pricing. Manhattan continued to dominate, with 24 neighborhoods in our top 50, followed by Brooklyn with 21, while Queens continued its rise, ranking 11 neighborhoods among New York’s 50 priciest. Be sure to scroll down to the end, and check out the full ranking of NYC’s top 50 most expensive neighborhoods. After 2017 Dominance, TriBeCa and SoHo Remain Top Most Expensive NYC Neighborhoods Although our…
Key Takeaways:
- TriBeCa entrenched as #1 most expensive neighborhood in NYC, despite 26% Y-o-Y price drop
- With a $2.95 million median sale price, SoHo remains firmly in second place
- Brooklyn’s Homecrest sees sharpest median sale price increase at 80%
- At #3, DUMBO is Brooklyn’s priciest neighborhood
- The Upper East Side is NYC’s most active neighborhood sales market with 600 transactions, followed closely by the Upper West Side with 579 residences sold
- Two Queens neighborhoods hit the $1 million mark
The second quarter of 2018 saw fairly balanced market conditions in New York City’s top 50 most expensive neighborhoods – 24 of them experienced price growth, while the same number saw median sale prices trend downwards. Furthermore, compared to year-ago figures, almost no neighborhoods among the city’s most expensive saw massive hikes, or steep drops in pricing.
Manhattan continued to dominate, with 24 neighborhoods in our top 50, followed by Brooklyn with 21, while Queens continued its rise, ranking 11 neighborhoods among New York’s 50 priciest.
Be sure to scroll down to the end, and check out the full ranking of NYC’s top 50 most expensive neighborhoods.
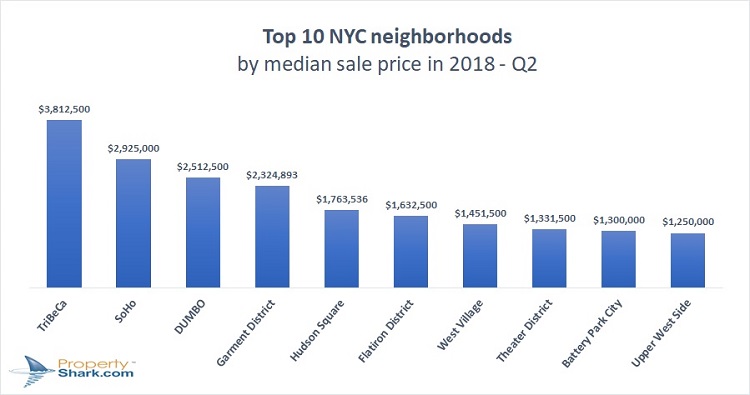
After 2017 Dominance, TriBeCa and SoHo Remain Top Most Expensive NYC Neighborhoods
Although our analysis of New York City’s top 50 most expensive neighborhoods reflects the city’s dynamic market conditions, where neighborhoods change positions from quarter to quarter, TriBeCa remains the undisputed leader with a $3.8 million median sale price. This is despite a 26% price drop, marking the second consecutive quarter in which the median price dropped by double digits here.
TriBeCa’s downwards trending prices come as a result of the sudden price boom of 2017’s first and second quarters, which was fueled by the high number of sales in new-to-market luxury and ultra-luxury developments. Among them was 56 Leonard Street, where the median sale price stood at a whopping $7.1 million in Q2 2017.
SoHo retained its second place in our ranking, thanks to a 17% year-over-year appreciation with 27 transactions. This brought the median sale price in the trendy neighborhood to just over $2.9 million.
As Pricey New Developments Sell Out, Medians Drop in Top Manhattan Markets
Unsurprisingly, Manhattan remains the priciest borough, home to 9 out of NYC’s 10 most expensive neighborhoods in Q2 2018. However, similarly to TriBeCa, many top Manhattan markets, including the Financial District, Central Midtown and the Flatiron District, saw median prices drop by double digits compared to Q2 2017, when new-to-market luxury developments experienced hot sales activities. For example, a year ago the Flatiron District outpaced even SoHo, landing the second spot thanks to dynamic sales activity in developments like 212 Fifth Avenue where the median stood at $10 million, and 172 Madison Avenue, which boasted a $7.5 million median sale price. In the year since however, the Flatiron District slid to #6 with a 36% price contraction that yielded a $1.6 million median.
The Financial District registered the sharpest drop in the median sale price, contracting by 48% compared to 2017 Q2. While it ranked as the sixth priciest NYC neighborhood with a $1.9 million median a year ago, the Financial District now sits at #26, even sliding below the $1 million mark.
The Garment District stood at the other end of the spectrum with a median sale price of $2,325,000, marking a 36% appreciation compared to a year ago. That $600,000-plus price growth pushed it up four spots to #4, influenced by ten sales at 16 W 40th Street, where the median sale price clocked in at $2.8 million.
DUMBO Keeps Brooklyn in Top 10, Homecrest Surges with New Developments
Although Manhattan retained its edge, Brooklyn remains a resilient competitor, with 21 neighborhoods in our top 50. While DUMBO may be the only Brooklyn neighborhood among New York’s 10 most expensive, in Q2 2018 it took the #3 spot with a $2,512,500 median sale price. This was the result of diminished sales activity and high-priced transactions – of DUMBO’s 16 registered sales, only two were below $1.5 million.
Ranked as the 45th most expensive New York neighborhood, Homecrest experienced the highest year-over-year price appreciation. Not even ranked in our top 50 a year ago, this Brooklyn neighborhood saw its median sale price jump to $725,000, an 80% increase over Q2 2017. This impressive growth was fueled by sales at 1679 E 19th Street and 1769 E 13th Street, which made up half of all transactions in Homecrest.
Queens Reaches $1 Million Mark in Two Neighborhoods
Queens continues to show promise, ranking 11 neighborhoods among the city’s 50 most expensive. Although Queens’ priciest neighborhoods tend to rank in the bottom half, Belle Harbor marked a 40% increase over 2017 Q2, climbing to #16 with a median sale price of $1,180,000. However, only five sales were registered here, so it remains to be seen if Belle Harbor can hold keep its foothold among NYC’s 20 most expensive neighborhoods.
Hunters Point also reached the $1,000,000 mark in the second quarter of this year, climbing one position compared to last year, with a median sale price appreciation of 2%.
In fact, all but one Queens neighborhood in our ranking saw median sale prices appreciate. While most saw single-digit price-growth, Auburndale medians expanded by 21% year-over-year, reaching $856,500 with 20 sales, while Old Astoria’s median sale price grew by nearly a quarter, reaching $741,133.
You can check out the full ranking of New York City’s top 50 most expensive neighborhoods in Q2 2018 in the table below:
| # | Borough | Neighborhood | Median Sale Price Q2 2018 | Y-o-Y Change | Transactions |
|---|---|---|---|---|---|
| 1 | Manhattan | TriBeCa | $3,812,500 | -26% | 62 |
| 2 | Manhattan | SoHo | $2,925,000 | 17% | 27 |
| 3 | Brooklyn | DUMBO | $2,512,500 | 37% | 16 |
| 4 | Manhattan | Garment District | $2,324,893 | 36% | 18 |
| 5 | Manhattan | Hudson Square | $1,763,536 | -19% | 9 |
| 6 | Manhattan | Flatiron District | $1,632,500 | -36% | 100 |
| 7 | Manhattan | West Village | $1,451,500 | 16% | 72 |
| 8 | Manhattan | Theatre District - Times Square | $1,331,500 | 9% | 40 |
| 9 | Manhattan | Battery Park City | $1,300,000 | -20% | 45 |
| 10 | Manhattan | Upper West Side | $1,250,000 | 4% | 579 |
| 11 | Manhattan | Greenwich Village | $1,237,500 | -12% | 124 |
| 12 | Brooklyn | Gowanus | $1,226,996 | -1% | 12 |
| 13 | Brooklyn | Manhattan Beach | $1,221,900 | -8% | 9 |
| 14 | Brooklyn | Carroll Gardens | $1,200,950 | 26% | 16 |
| 15 | Manhattan | Upper East Side | $1,200,000 | 0 | 600 |
| 16 | Queens | Belle Harbor | $1,180,000 | 40% | 5 |
| 17 | Brooklyn | Brooklyn Heights | $1,150,000 | 3% | 61 |
| 18 | Brooklyn | Boerum Hill | $1,142,500 | -42% | 22 |
| 19 | Brooklyn | Prospect Heights | $1,100,000 | 24% | 59 |
| 20 | Manhattan | Chelsea | $1,097,500 | -13% | 122 |
| 21 | Manhattan | Central Midtown | $1,060,000 | -44% | 58 |
| 22 | Brooklyn | Park Slope | $1,057,500 | -15% | 110 |
| 23 | Manhattan | Little Italy | $1,055,000 | - | 19 |
| 24 | Brooklyn | Fort Greene | $1,040,000 | -8% | 23 |
| 25 | Queens | Hunters Point | $1,000,000 | 2% | 49 |
| 26 | Manhattan | Financial District | $985,000 | -48% | 81 |
| 26 | Brooklyn | Mill Basin | $985,000 | 7% | 13 |
| 27 | Brooklyn | Borough Park | $970,000 | 24% | 33 |
| 28 | Manhattan | Lower East Side | $963,265 | 15% | 50 |
| 29 | Brooklyn | Williamsburg | $952,500 | 10% | 118 |
| 30 | Brooklyn | Downtown Brooklyn | $950,000 | 8% | 82 |
| 31 | Manhattan | Clinton - Hell's Kitchen | $940,000 | -6% | 129 |
| 32 | Brooklyn | Greenpoint | $925,000 | -10% | 17 |
| 33 | Manhattan | Gramercy Park | $890,000 | -10% | 55 |
| 34 | Brooklyn | Dyker Heights | $880,000 | -4% | 13 |
| 34 | Queens | East Flushing | $880,000 | 9% | 17 |
| 34 | Queens | Queensboro Hill | $880,000 | -7% | 15 |
| 35 | Manhattan | Sutton Place | $875,000 | -17% | 58 |
| 36 | Brooklyn | Cobble Hill | $867,500 | 8% | 18 |
| 37 | Queens | Auburndale | $856,500 | 21% | 20 |
| 38 | Brooklyn | Crown Heights | $850,000 | 21% | 51 |
| 38 | Brooklyn | Bedford-Stuyvesant | $850,000 | 11% | 54 |
| 38 | Queens | Hollis Hills | $850,000 | 8% | 19 |
| 39 | Manhattan | East Village | $849,000 | -19% | 57 |
| 40 | Queens | Fresh Meadows | $825,000 | 1% | 43 |
| 41 | Manhattan | Turtle Bay | $790,000 | 3% | 76 |
| 41 | Manhattan | Chinatown | $790,000 | -4% | 10 |
| 42 | Manhattan | Murray Hill | $745,000 | -5% | 159 |
| 43 | Queens | Old Astoria | $741,133 | 24% | 55 |
| 44 | Brooklyn | Clinton Hill | $736,570 | -11% | 34 |
| 45 | Brooklyn | Homecrest | $725,000 | 80% | 25 |
| 46 | Queens | College Point | $723,000 | 5% | 29 |
| 47 | Brooklyn | Madison | $710,000 | -6% | 12 |
| 48 | Manhattan | East Harlem | $709,750 | 8% | 20 |
| 49 | Queens | Middle Village | $706,500 | 9% | 30 |
| 50 | Queens | Maspeth | $705,000 | 8% | 24 |
Methodology:
The median sale prices were calculated based on residential property sales closed between April 1, 2018 and June 30, 2018. The residential properties included in the stats are single-family homes, condos and co-ops.
Want to stay on top of the real estate market?
Access comprehensive property data and ownership information with intuitive research tools.
POSTED IN: Market Studies, New York Real Estate

Eliza Theiss is a senior writer reporting real estate trends in the US. Her work has been cited by CBS News, Curbed, The Los Angeles Times, and Forbes among others. With an academic background in journalism, Eliza has been covering real estate since 2012. Before joining PropertyShark, Eliza was an associate editor at Multi-Housing News and Commercial Property Executive. She has also contributed extensively to CommercialEdge. Reach her at [email protected]
Recent Reports

2026 Q2 Foreclosure Report: Bronx Caseload Hits 7-Year High, Brooklyn & Manhattan Slow to 4-Year Low
Manhattan yet again slowed to become the city’s least active foreclosure market, Brooklyn’s caseload dropped so low it barely edged out Staten Island, while the Bronx heated up enough to surpass all boroughs except Queens.

NYC Resale Gains & Losses: Every Borough Made Money in 2025, Except Manhattan
In 2025, NYC home-sellers mostly made money. But, in Manhattan, resales came with losses — and it was apartments and recent buyers that absorbed them.

World Cup or Your Mortgage/Rent? Ticket Prices Rival Host City Housing Costs
World Cup ticket prices rival monthly housing expenses in the 11 U.S. host cities, with even the cheapest seats covering weeks or even months of rent or mortgage payments.