

New York Real Estate | 4 minute read
Property Owners Map: How to See Ownership Details and Parcel Lines
By Laura Pop-Badiu | Mar 31, 2026
If you’re trying to find property owners by map, evaluate nearby parcels or understand how properties connect, a map-based approach makes the process faster, clearer and more intuitive.
Why a Map-Based Property Search Matters
When researching real estate, ownership and boundaries go hand in hand. Whether you’re evaluating a single parcel or scanning an entire neighborhood, seeing who owns a property and where its property lines begin and end provides valuable context.
Traditional searches often start with an address. But in some cases, you might need to conduct due diligence without having one, or you might need to look into multiple properties at once. While address-only searches can be a great starting point or even lead to the expected results by themselves, in some instances, they can require additional steps, especially when exploring unfamiliar areas.
A great solution to this is a property owner map, which combines parcel boundaries with ownership data in a single, visual interface. PropertyShark’s Property Lists tool integrates interactive mapping with detailed property records, allowing users to explore neighborhoods on a map view while also accessing ownership information instantly.
If you’re trying to find property owners by map, find out who owns land, evaluate nearby parcels or understand how properties connect, a map-based approach makes the process faster, clearer and more intuitive.
How to Identify Who Owns a Property with Maps
One of the most common research goals is finding out who owns a property, in order to reach the right decision-maker. Here are a few steps that will help you identify who owns a property by map with the PropertyShark Property Lists tool:
- Open the interactive map interface
- Navigate to your area of interest
- Click directly on a parcel
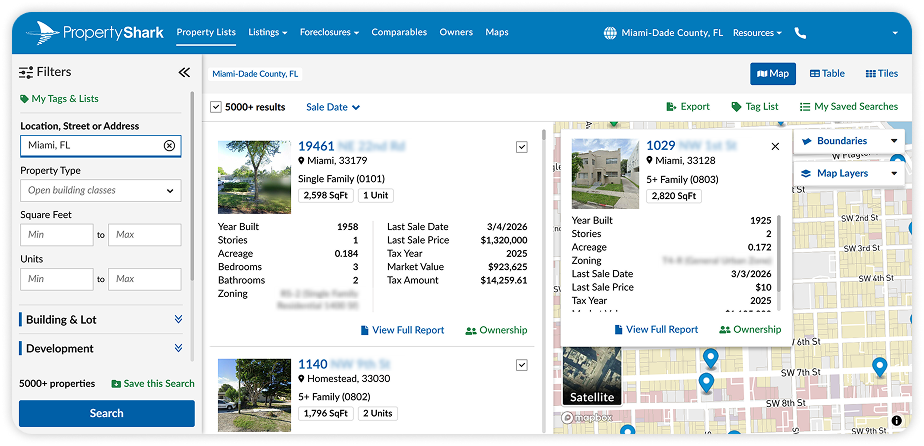
When using this method, you don’t need to know the exact address in advance. Instead, you can visually explore streets, blocks or entire neighborhoods and select properties directly from the map. Once you click on a parcel, ownership information becomes available, including the owner’s name and property details. Using a land owner map removes guesswork and allows users to move seamlessly from visual exploration to verified ownership data.
This approach is especially helpful when researching individual versus corporate ownership. For this specific purpose, PropertyShark Platinum users can also access real owners in NYC. Moreover, you can use this strategy to compare properties that are owner-occupied versus properties with absentee owners.
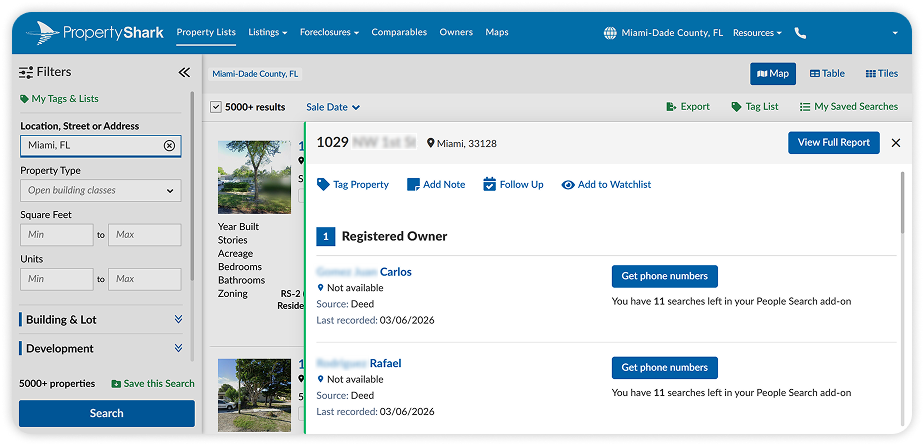
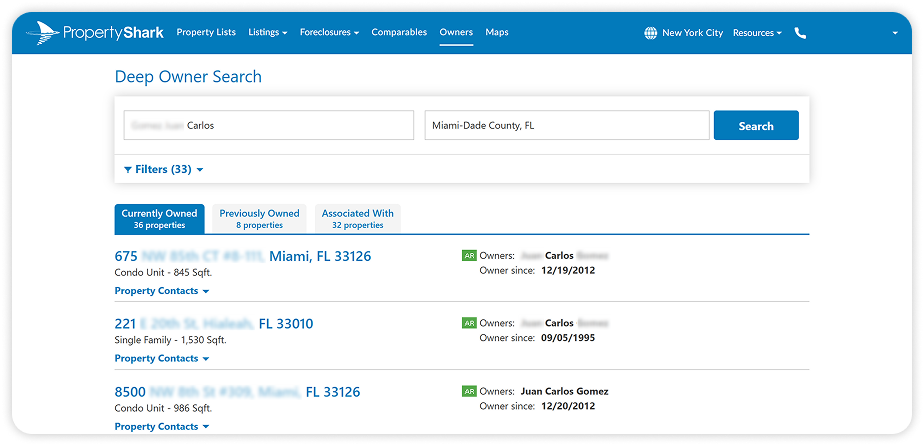
How to Find Owner Contact Information for Outreach or Research
Beyond identifying ownership, you may also need contact details for research, due diligence or outreach. PropertyShark’s Property Lists tool connects selected parcels to ownership records that may include:
- Mailing addresses
- Related ownership records
- Properties associated with the same owner
By selecting properties directly on the map, users can build targeted lists and access relevant ownership data in one workflow. This is particularly useful for investors researching off-market opportunities, professionals analyzing multiple properties at once, and brokers building targeted property lists within specific geographic areas.
Instead of searching property by property, users can start with a map, select parcels and access ownership details, all in one place. The result is a streamlined way to connect maps with property lines and owners in a single research session.

See ownership details and parcel lines on one map.
How to Understand Parcel Lines and Property Boundaries
Ownership data becomes even more meaningful when paired with visible parcel lines. PropertyShark displays property lines and owners directly on interactive maps, allowing users to see:
- Lot size
- Parcel shape
- Adjacent properties
- Neighboring ownership
As a result of understanding parcel boundaries, users are able to identify neighboring landowners, evaluate potential land assemblage and lot consolidation opportunities, assess property context before deeper research and compare lot dimensions across a block or district.
When you can see the land itself, ownership data becomes clearer. A property owner map doesn’t just tell you who owns a property — it shows you how that property fits within its surroundings, ultimately supporting smarter and more informed business decisions.
How to Bring It All Together with Property Lists
Property Lists is designed as a discovery tool for thorough due diligence, not just a lookup tool. As a result, you can:
- Start with a map
- Click parcels to view ownership and boundaries
- Build, save and export customized property lists
This workflow supports those who think and strategize spatially, not just by address. Instead of beginning with an address, you can begin with geography, visually identifying patterns, clusters or opportunities before diving into more details.
Whether you’re reviewing a single parcel or exploring dozens at once, the combination of a land owner map with ownership records simplifies the research process.
Who Benefits Most from PropertyShark’s Property Lists
With PropertyShark, anyone looking to find property owners by map or analyze property lines and owners together benefits from a spatially driven research tool. Among the most common users are:
- Real Estate Investors: Use the map to identify owners and access contact details for targeted outreach.
- Researchers & Analysts: Analyze ownership patterns and study neighborhood-level trends.
- Buyers & Real Estate Professionals: Visualize property boundaries, assess neighboring parcels and understand context before moving forward.
See Ownership, Boundaries and Opportunity on One Map
Property research becomes more effective when ownership and parcel data work together. A map-based approach allows users to move seamlessly in the research equation:
“Where is this property?” — > “Who owns it?” — > “What surrounds it?”
PropertyShark’s Property Lists enables users to explore ownership details, visualize parcel lines and uncover opportunities, all within one interactive property owner map.
Sign up for a free PropertyShark account to give the Property Lists tool a try and subscribe to get full access to comprehensive real estate data.
Access comprehensive property data and ownership information with intuitive research tools.

Laura Pop-Badiu is a Senior Creative Writer at PropertyShark, with a degree in Journalism and a background in both hospitality and real estate. Laura is a certified bookworm with a genuine passion for the written word and a keen interest in the real estate market, having previously written for Yardi's RentCafe, CoworkingCafe and CoworkingMag. Her work has been featured in major publications like The New York Times, Forbes, NBC News, The Business Journals, Chicago Tribune, MSN and Yahoo! Finance, among others.
Recent Reports

Prices Rise in 32 of NYC’s Leading Neighborhoods as City and Manhattan Hit Record Highs
Q2 2026 saw NYC and Manhattan reach historic highs, with Brooklyn and Queens marking close to new records as well. Meanwhile, Hudson Yards remained at the top, Central Midtown posted its highest price ever and Carroll Gardens marked its third consecutive quarter over $2 million

2026 Q2 Foreclosure Report: Bronx Caseload Hits 7-Year High, Brooklyn & Manhattan Slow to 4-Year Low
Manhattan yet again slowed to become the city’s least active foreclosure market, Brooklyn’s caseload dropped so low it barely edged out Staten Island, while the Bronx heated up enough to surpass all boroughs except Queens.

NYC Resale Gains & Losses: Every Borough Made Money in 2025, Except Manhattan
In 2025, NYC home-sellers mostly made money. But, in Manhattan, resales came with losses — and it was apartments and recent buyers that absorbed them.