
Market Studies | < 1 minute read
New York City residential lis pendens in 2010
BY PropertyShark Staff | Feb 10, 2011
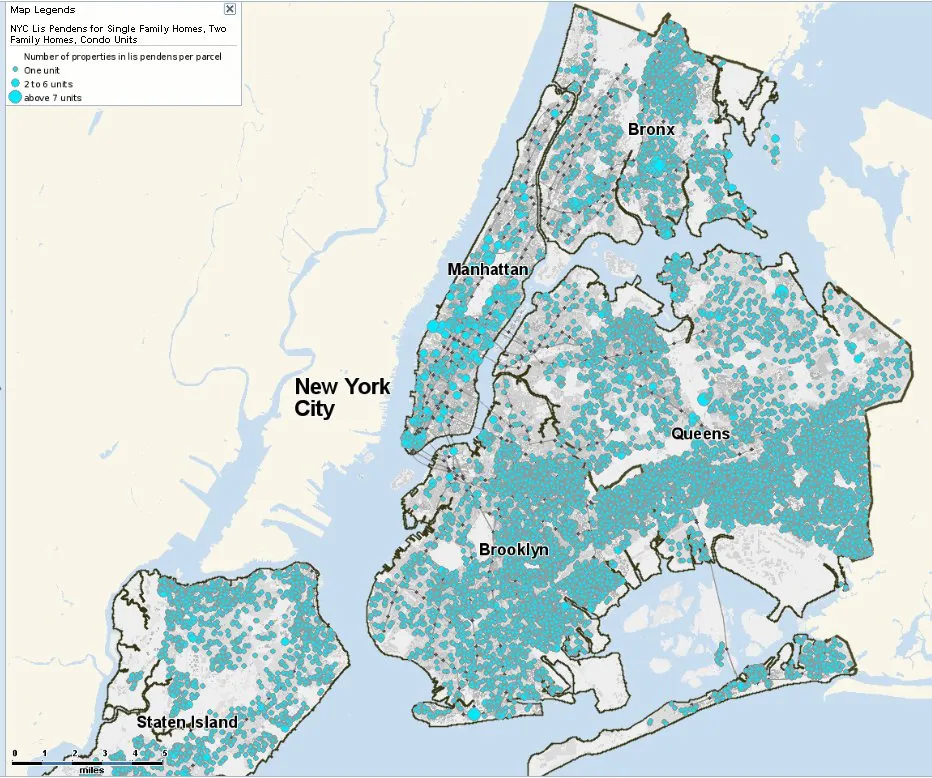
We’ve created a new interactive map showing where in New York City residential pre-foreclosures occurred in 2010. The map contains unique properties (single and two family homes and condo units ) that had at least one lis pendens filing in 2010. The size of the circle indicates how many lis pendens there were on a parcel. This is of interest mainly for condos, because there can be more than one unit in lis pendens within the same building.
On the map, you can click on a circle for a mini-report pop-up displaying details about the property in pre-foreclosure.
2010 New York City Lis Pendens
Browse current New York City pre-foreclosure listings.
Latest Posts
Want to stay on top of the real estate market?
Access comprehensive property data and ownership information with intuitive research tools.
POSTED IN: Market Studies, New York Foreclosures

Recent Reports
Locked-In Owners, Mobile Renters: Homeowners Stay Put as Renters Move 3.7x More Across Largest U.S. Cities
Renters became the primary drivers of long-distance mobility across the largest U.S. cities, moving 3.7 times more than owners in 2024, as high mortgage rates and housing costs kept many homeowners in place.

$4.6M Hudson Yards Maintains Top Spot, Luxury Sales in Malba Set $2.5M Price Record for Queens
Despite prices declining, Hudson Yards remained the most expensive NYC neighborhood, but TriBeCa’s growth closed the gap to under $400,000, while Malba set a new historic price record for Queens at $2.5 million, securing the highest ranking ever for the borough at #5.

2026 Q1 Foreclosure Report: Brooklyn Filings Fall Sharply, Bronx & Staten Island Hit New Peaks
Behind a deceptively mild citywide downtick, borough foreclosure markets pulled into significantly diverging paths as Brooklyn cases were nearly halved and the Bronx hit a new, record high. Meanwhile, Queens remained unchanged, Staten Island surged back up and Manhattan cooled slowly.