
San Diego Real Estate | 2 minute read
San Diego Zoning Map Shows What you Can Build and Where
BY Georgiana Mihaila | Mar 28, 2014
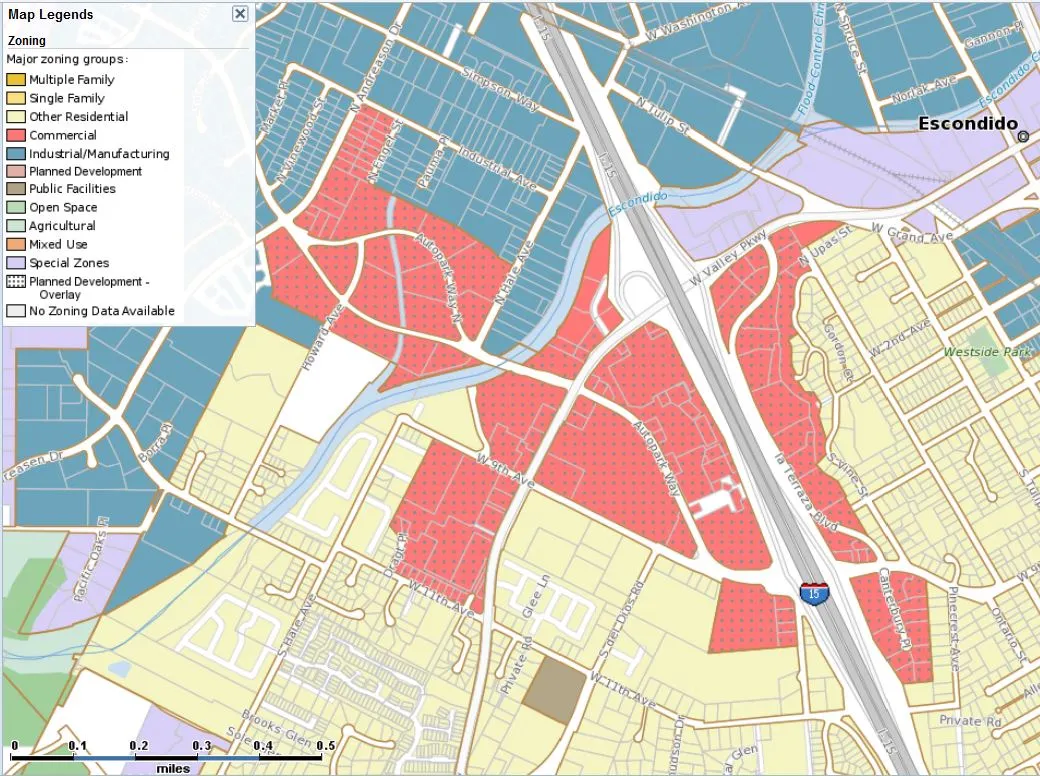
What better way of telling what you can build and where to build it around San Diego than with a highly-detailed Zoning Map of the entire San Diego County?
Freshly updated as part of a broader and more ambitious plan of boosting PropertyShark.com’s data & services offering for California (that included the addition of detailed property characteristics, recent sales data, superior ownership information, new tools and much more), the map will walk you through all of San Diego County’s zoning areas.
Designed with developers, investors and potential homebuyers in mind, the map is a useful tool for all those looking to buy property, expand an existing one, or start work on a new project – be it commercial or residential – within the boundaries of San Diego County.
Look up any property using our map, and see how the area in which it is located and the neighboring ones are zoned:

Once you have found the property you’re interested in, a mini property report will pop up, providing you with a summary for that particular property, as well as a short overview of how the area has been zoned:
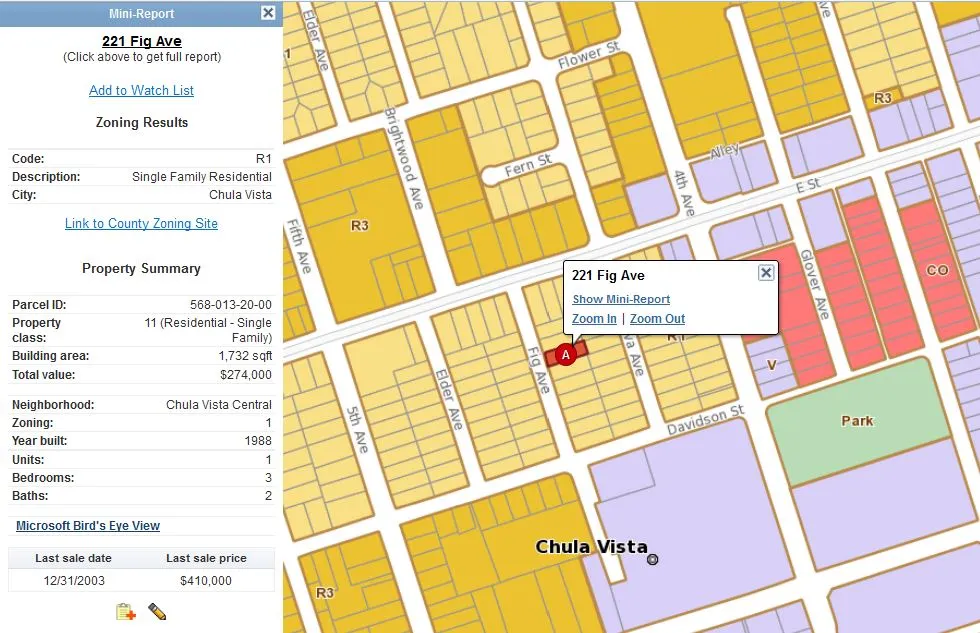
The mini report will also include a link to the full property report, where you can find extensive property information ranging from square footage, year built, number of bedrooms, to ownership data, recent sales and much more. Check out a sample report for San Diego to see exactly what type of data is available for San Diego properties.
The San Diego Zoning map comes with a nifty new feature, just in case you don’t want to move right next to a noisy construction site: the update introduces the Planned Development overlay, signaling out all major areas in which work is about to start (if it hasn’t already) on a new project. You can easily tell which areas are slated for development by looking for the dotted zones – when the development type was specified – or by looking for the pale pink areas:
Many more helpful maps are now available for San Diego County, why not give them a try? Use our maps to see:
- recent sales
- tax values per square foot
- how your lot is classified compared to your block and general neighborhood (Landuse Map)
- if your property is at risk for flooding or storm surge and if it requires flood insurance (FEMA Flood Zones)
- if your property in an landslide, liquefaction or earthquake fault zone (Geohazards map)
- if there’s any fire burn history in your area (Wildfires map)
- which elementary/high school/middle school zoning area you fall under, and more.
Latest Posts
Want to stay on top of the real estate market?
Access comprehensive property data and ownership information with intuitive research tools.
POSTED IN: San Diego Real Estate

After spending the first 6 years of her career training in the art of real estate alongside the Yardi team, Georgiana went on to become VP of Marketing for Montreal-based fintech company NestReady, then to run the marketing department behind one of the world’s leading self-dev media companies, Goalcast Inc. She’s now combining her passion for engaging content with a long-lasting addiction to real estate on FancyPantsHomes.com
Recent Reports

Locked-In Owners, Mobile Renters: Homeowners Stay Put as Renters Move 3.7x More Across Largest U.S. Cities
Renters became the primary drivers of long-distance mobility across the largest U.S. cities, moving 3.7 times more than owners in 2024, as high mortgage rates and housing costs kept many homeowners in place.
$4.6M Hudson Yards Maintains Top Spot, Luxury Sales in Malba Set $2.5M Price Record for Queens
Despite prices declining, Hudson Yards remained the most expensive NYC neighborhood, but TriBeCa’s growth closed the gap to under $400,000, while Malba set a new historic price record for Queens at $2.5 million, securing the highest ranking ever for the borough at #5.
2026 Q1 Foreclosure Report: Brooklyn Filings Fall Sharply, Bronx & Staten Island Hit New Peaks
Behind a deceptively mild citywide downtick, borough foreclosure markets pulled into significantly diverging paths as Brooklyn cases were nearly halved and the Bronx hit a new, record high. Meanwhile, Queens remained unchanged, Staten Island surged back up and Manhattan cooled slowly.