

New York Real Estate | 3 minute read
Spectacular Growth in NYC Luxury Real Estate Market Boosts Q1 2016
BY Adela Muresan | Apr 13, 2016
Quarterly Report on the Residential Market Finds Luxury Sales Pushing Up Median Prices
Residential Market Highlights:
- The luxury market recorded a spectacular Y-o-Y transaction growth in Manhattan: 59% more properties sold for over $3 million
- Median home prices in NYC (excluding Staten Island) rose by 12% Y-o-Y, reaching $595,000
- NYC: overall, the price per square foot was up by 13% since last year’s Q1
- The total number of transactions was up 7% from Q1 2015 (8,615 transactions in 2016)
Peak median prices make for the best Q1 in years
The numbers for Q1 2016 were impressive when it comes to median home prices. The market (covering Manhattan, Brooklyn, Queens and the Bronx) was at its highest point in four years, even exceeding last year’s peak Q3 and reaching $595,000. While the number of transactions was down from the previous quarter, this year’s Q1 recorded the best seasonal performance in the past four years, though not by a lot. The median price/sq. ft was also up 13% Y-o-Y and settled at $630.
Here’s the evolution of median sale prices and transaction volumes since Q1 2012:
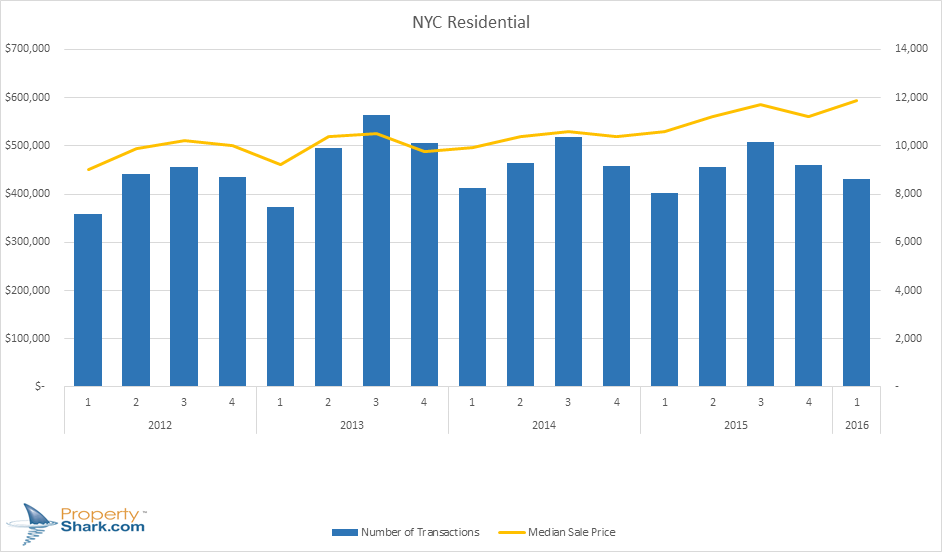
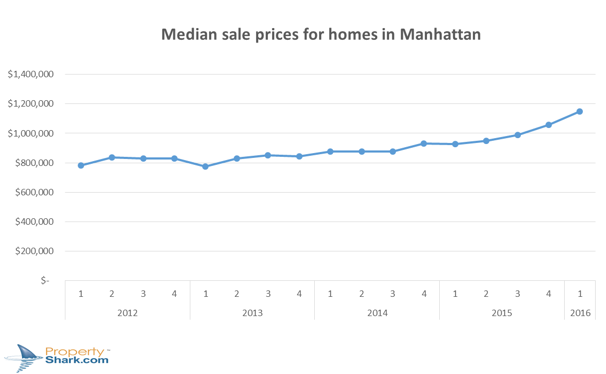
To take a look at Manhattan alone, the median home price here went up by an impressive 24%. Over 3,400 sales were closed, almost twice as much as in Brooklyn and 10% more than in the first quarter of last year. However, the rise in median price per square foot was at a modest 7%.
The Brooklyn residential market has also been performing well, with a Y-o-Y rise in median home prices of 11%. Even more so, at $560, the median price per square foot was 17% higher last quarter than one year ago. Growth in the number of transactions is still on the positive side, but lagging behind the soaring growth seen in Manhattan.
| Borough | Median Sale Price | ΔYoY | Median Sale Price/ sqft | ΔYoY | Number of Transactions | ΔYoY |
|---|---|---|---|---|---|---|
| Manhattan | $1,150,000 | 24% | $1,309 | 7% | 3,422 | 10% |
| Brooklyn | $594,000 | 11% | $560 | 17% | 1,873 | 5% |
| Queens | $352,183 | 2% | $398 | 19% | 2,805 | 5% |
| Bronx | $240,000 | -4% | $219 | 6% | 515 | 9% |
| NYC (excl. Staten Island) | $595,000 | 12% | $630 | 13% | 8,615 | 7% |
Luxury sales in ever higher demand
Q1 2016 continues last year’s positive trend in the Manhattan luxury market, as 59% more properties worth $3 million and upwards were traded than in Q1 2015. The change is just as remarkable when looking at quarterly shifts: a 15% increase in transactions from the last quarter of 2015. However, the median sale price increased only slightly (7%), despite the growing demand.
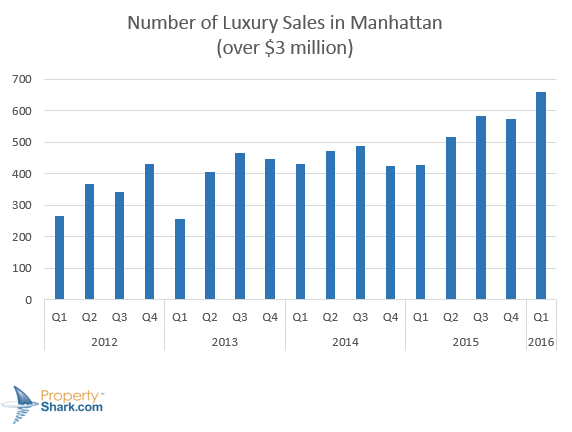
The year started out strongly market-wide, with growth spurts in transactions for all four boroughs covered in this report. Sales numbers were better than for any Q1 in the past four years, while median luxury home prices in Manhattan reached a new record high, drawing closer to the $5,000,000 threshold.
Methodology:
Figures used to compile this report were collected by PropertyShark from public sources recording closed sales between January 1, 2012 and March 31, 2016. Properties covered by this report include single-family homes, condos and coop units only. The numbers for Q1 2016 were adjusted upwards by 21%, based on historical trends observed using in-house data, in order to take into account sales left unrecorded at the time of the report.
Latest Posts
Want to stay on top of the real estate market?
Access comprehensive property data and ownership information with intuitive research tools.
POSTED IN: New York Real Estate

Recent Reports

Locked-In Owners, Mobile Renters: Homeowners Stay Put as Renters Move 3.7x More Across Largest U.S. Cities
Renters became the primary drivers of long-distance mobility across the largest U.S. cities, moving 3.7 times more than owners in 2024, as high mortgage rates and housing costs kept many homeowners in place.

$4.6M Hudson Yards Maintains Top Spot, Luxury Sales in Malba Set $2.5M Price Record for Queens
Despite prices declining, Hudson Yards remained the most expensive NYC neighborhood, but TriBeCa’s growth closed the gap to under $400,000, while Malba set a new historic price record for Queens at $2.5 million, securing the highest ranking ever for the borough at #5.
2026 Q1 Foreclosure Report: Brooklyn Filings Fall Sharply, Bronx & Staten Island Hit New Peaks
Behind a deceptively mild citywide downtick, borough foreclosure markets pulled into significantly diverging paths as Brooklyn cases were nearly halved and the Bronx hit a new, record high. Meanwhile, Queens remained unchanged, Staten Island surged back up and Manhattan cooled slowly.