

RELEASED ON October 4, 2018
NYC Foreclosures Continue to Decline in Q3
Robert Demeter | 4 minute read
Key takeaways: With only 716 unique cases, NYC foreclosures decreased 17% Y-o-Y; Queens had the most properties headed to the auction block in Q3: 303; First time foreclosures in Brooklyn stagnated Y-o-Y, the borough seeing only a -1% change; Year-over-year, the Bronx saw a 43% drop in foreclosure activity; With only 22 homes headed to auction, Manhattan reached a record low in foreclosure cases; Lis pendens across NYC were down 36% year-over-year; First time foreclosures in New York City have been decreasing each quarter since the start of the year. In Q3, 716 homes headed to the auction block for the first time, a 17% decrease year-over-year and a 19% drop quarter-over-quarter. Since Q1 2017, this is the first time the number of homes scheduled to foreclose dipped below 800 in the city. As for the boroughs, Manhattan, the Bronx and Staten Island saw huge contractions, while activity in Brooklyn and Queens stagnated. Queens Foreclosures Stagnate: Only a 5% Change Y-o-Y Queens is the only borough which had a mild increase in foreclosures year-over-year, although a 5% change can also be considered as a stagnation. The borough also had the highest number of foreclosures in the third quarter of 2018,…
Key takeaways:
- With only 716 unique cases, NYC foreclosures decreased 17% Y-o-Y;
- Queens had the most properties headed to the auction block in Q3: 303;
- First time foreclosures in Brooklyn stagnated Y-o-Y, the borough seeing only a -1% change;
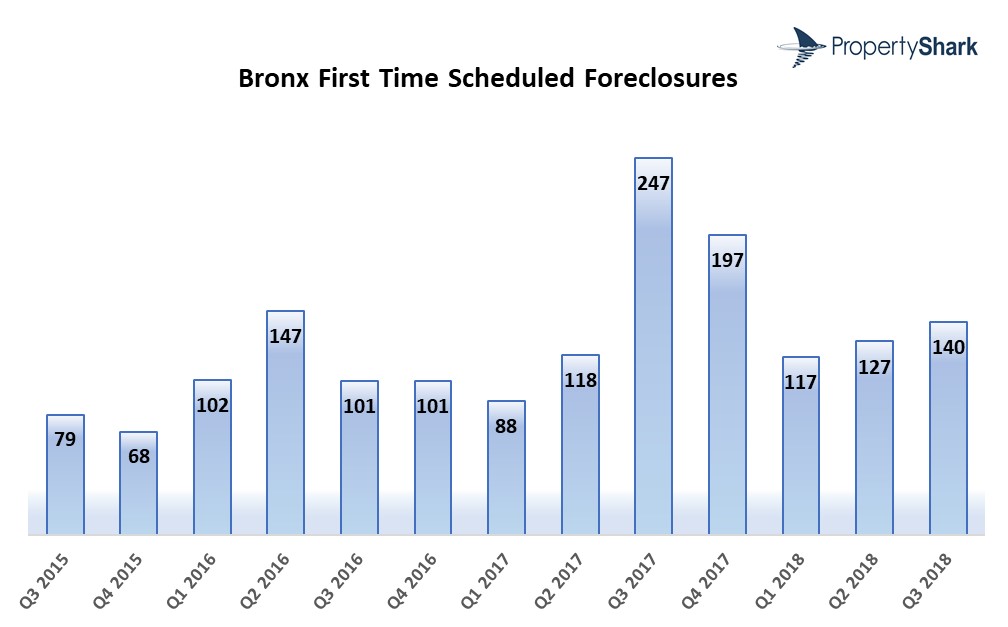
- Year-over-year, the Bronx saw a 43% drop in foreclosure activity;
- With only 22 homes headed to auction, Manhattan reached a record low in foreclosure cases;
- Lis pendens across NYC were down 36% year-over-year;
First time foreclosures in New York City have been decreasing each quarter since the start of the year. In Q3, 716 homes headed to the auction block for the first time, a 17% decrease year-over-year and a 19% drop quarter-over-quarter. Since Q1 2017, this is the first time the number of homes scheduled to foreclose dipped below 800 in the city.
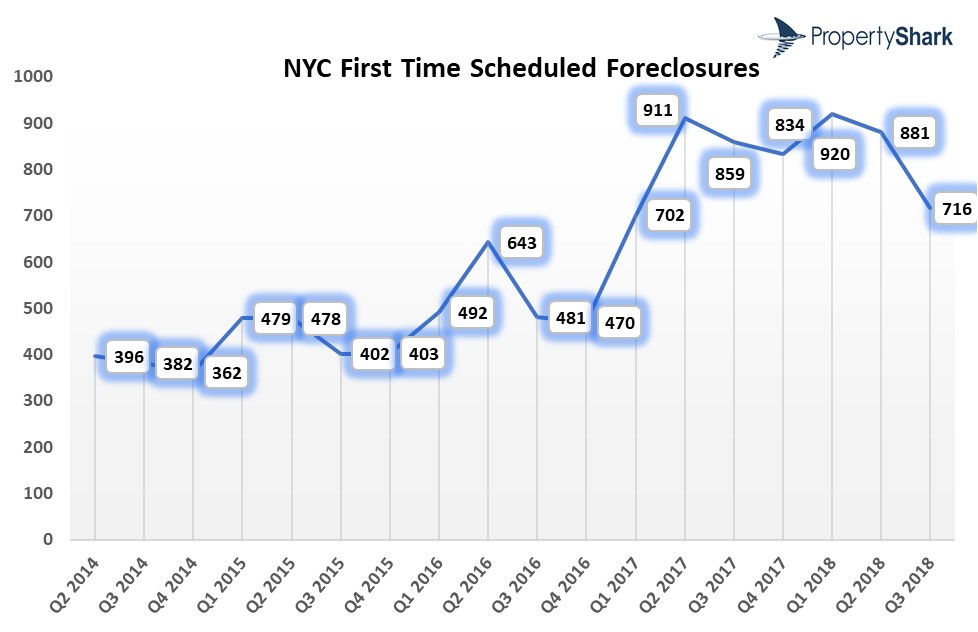
As for the boroughs, Manhattan, the Bronx and Staten Island saw huge contractions, while activity in Brooklyn and Queens stagnated.
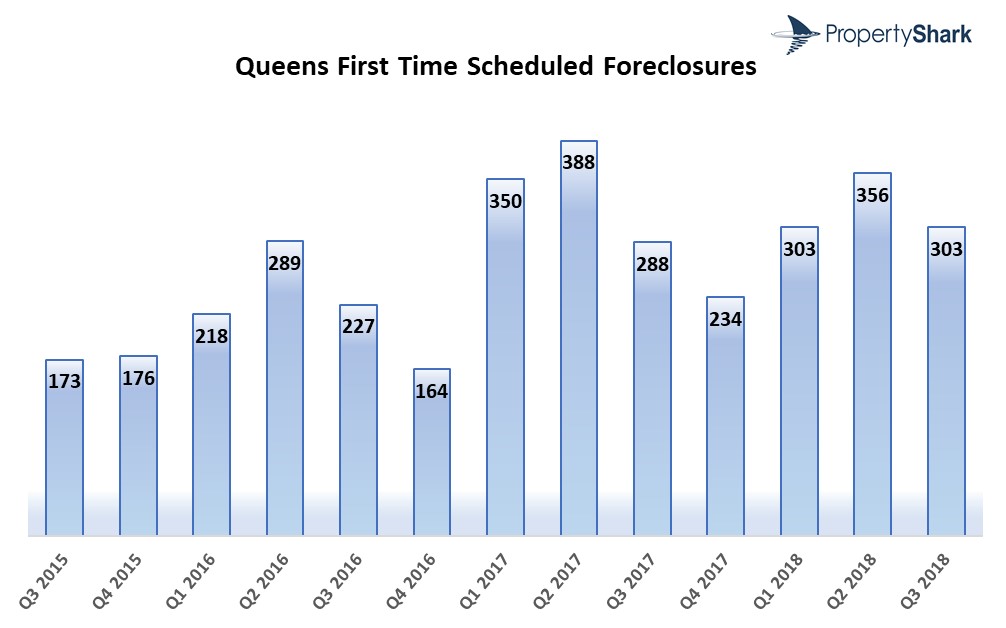
Queens Foreclosures Stagnate: Only a 5% Change Y-o-Y
Queens is the only borough which had a mild increase in foreclosures year-over-year, although a 5% change can also be considered as a stagnation. The borough also had the highest number of foreclosures in the third quarter of 2018, with 303 homes heading to the auction block—15 properties more than in Q3 2017. Quarter-over-quarter, Queens saw a 15% contraction.
The most foreclosed properties (27) were registered in zip 11434.
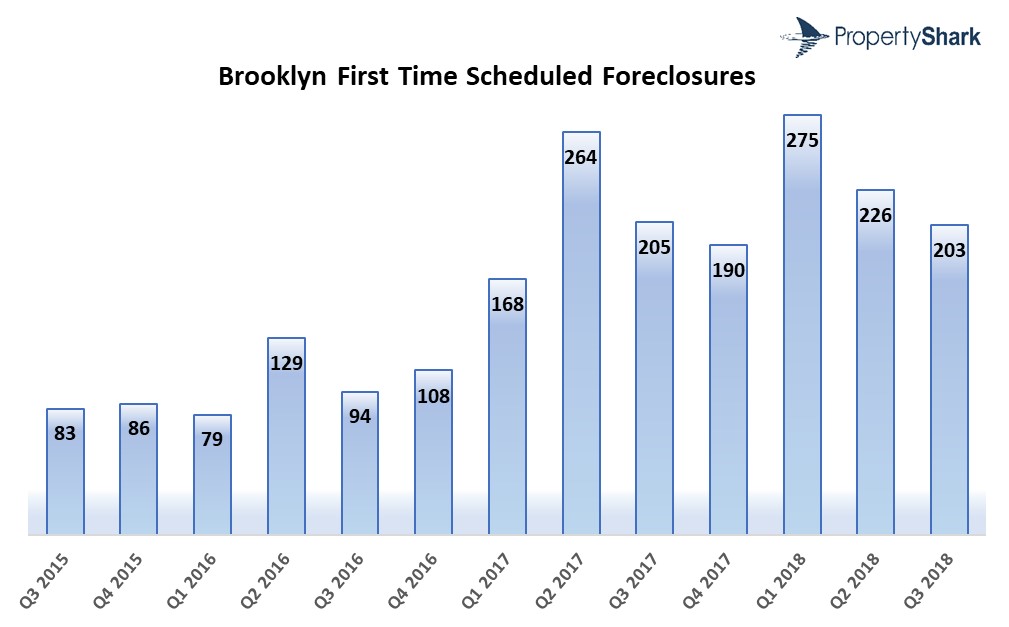
Brooklyn Closes Q3 with 203 First Time Foreclosures
With 203 unique cases in three months, Brooklyn closed the third quarter of 2018 with 203 foreclosures, a mere -1% change year-over-year. The borough only had 2 cases less than in Q3 2017. Quarter-over-quarter, however, Brooklyn saw a 10% decrease.
The 11234-zip code had the most foreclosed residential properties in Q3, with 27 cases spanning 5 neighborhoods, including Canarsie, Flatlands, Marine Park, Mill Basin and Bergen Beach.
Year-over-Year, The Bronx Sees a 43% Drop in Foreclosures
The Bronx had 140 unique cases in the third quarter of 2018, 107 cases less compared to Q3 2017. Even though the borough experienced a 43% decrease year-over-year, there was a 10% increase in activity quarter-over-quarter.
The highest number of new foreclosures in the Bronx was recorded in zip 10462, with 26 unique cases spread across Soundview, Castle Hill, Union Port and Parkchester neighborhoods.
The Bronx is the only borough in 2018 where the number of homes heading to auction has been increasing each quarter.
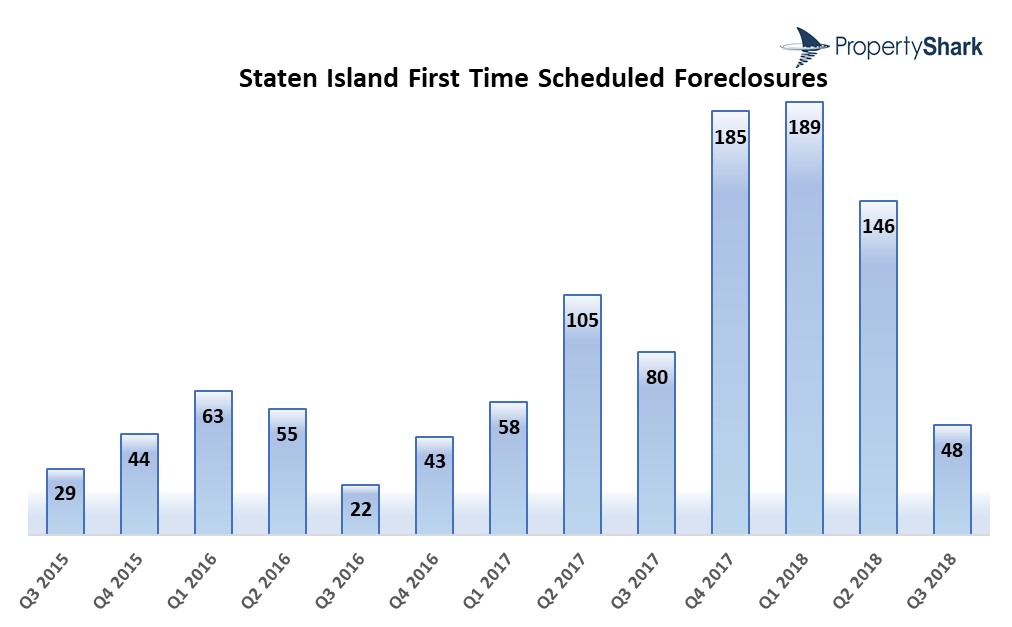
New Foreclosures in Staten Island Decrease 40%
Following the increased number of homes heading to auction in the past couple of quarters, foreclosures saw a steep drop in Q3 2018 in Staten Island. With only 48 unique cases, the borough had the least amount of foreclosures in Q3 after Manhattan, registering a 40% contraction. Staten Island also saw a colossal drop quarter-over-quarter, a whopping 67% decrease.
The last time Staten Island foreclosures dipped below 50 was in the fourth quarter of 2016.
With Only 22 Unique Cases in Q3, Manhattan Reaches New Historic Lows
Year-over-year, Manhattan saw the steepest drop in foreclosures: a 44% decrease. Manhattan also had the least amount of auctioned off homes out of the five boroughs in the third quarter of 2018, with only 22 properties foreclosing for the first time. In addition, the borough set a record-low for the number of foreclosed properties in one quarter since Q1 2014.
Homes Entering Pre-Foreclosure Reach Record Low in Q3
Following the same trend as citywide foreclosures, residential lis pendens in NYC have also decreased both year-over-year and quarter-over-quarter. Totaling 2,309 cases in Q3, homes entering pre-foreclosure dropped 36% year-over-year, and dipped 15% quarter-over-quarter.
In the last 19 quarters, the fewest lis pendens cases were registered in Q3 2018.
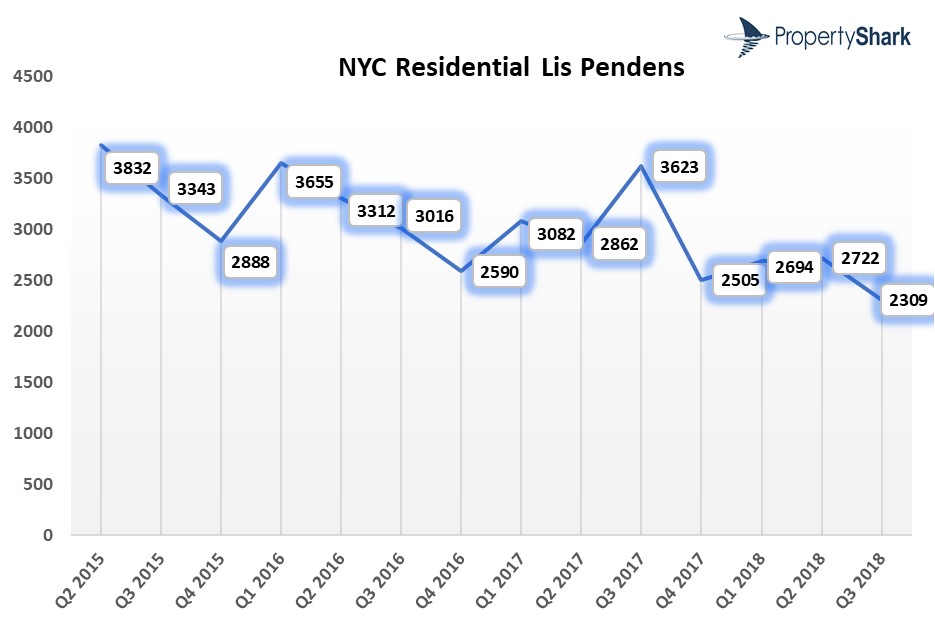
As for the boroughs, Queens had the most lis pendens in Q3 2018 with 825 cases, followed by Brooklyn (776 pre-foreclosures) and Staten Island (312 pre-foreclosures). Both year-over-year and quarter-over-quarter, pre-foreclosures decreased in each of the five boroughs. The largest Y-o-Y drops occurred in Queens and Staten Island, falling 42% in both boroughs
Methodology
Having tracked foreclosure listings for over a decade, PropertyShark is the only service in New York that guarantees 100% coverage of the local foreclosure market. The stats include only first-time foreclosures to avoid over-reporting the number of distressed properties in the city as auctions are frequently postponed and rescheduled. We report separately on lis pendens filings—legal notices which mark the beginning of the foreclosure process.
Our report focuses on residential properties (single- and two-family homes, condo, and co-op units) that were scheduled for auction for the first time in Q3 2018.
Pre-foreclosure data refers to unique properties that received at least one lis pendens filing in Q3 2018. This may be a first-time filing or a re-filing. The same building class restrictions apply, excluding co-ops. If more than 3 units were referenced on the same lis pendens filing, they were not counted at all in order to avoid counting entire buildings.
Access Every New York Foreclosure — First.
Get full access to NYC foreclosures, pre-foreclosures, REOs & auctions. Updated daily with lien & owner data. 100% coverage.
POSTED IN: Market Studies, New York Foreclosures

Robert is a copywriter at CommercialCafe and brings 3+ years of experience in commercial real estate. He previously worked as a copywriter at PropertyShark, as a senior associate editor at Commercial Property Executive and Multi-Housing News, and also wrote monthly market reports at Yardi Matrix.
Recent Reports

Prices Rise in 32 of NYC’s Leading Neighborhoods as City and Manhattan Hit Record Highs
Q2 2026 saw NYC and Manhattan reach historic highs, with Brooklyn and Queens marking close to new records as well. Meanwhile, Hudson Yards remained at the top, Central Midtown posted its highest price ever and Carroll Gardens marked its third consecutive quarter over $2 million

2026 Q2 Foreclosure Report: Bronx Caseload Hits 7-Year High, Brooklyn & Manhattan Slow to 4-Year Low
Manhattan yet again slowed to become the city’s least active foreclosure market, Brooklyn’s caseload dropped so low it barely edged out Staten Island, while the Bronx heated up enough to surpass all boroughs except Queens.

NYC Resale Gains & Losses: Every Borough Made Money in 2025, Except Manhattan
In 2025, NYC home-sellers mostly made money. But, in Manhattan, resales came with losses — and it was apartments and recent buyers that absorbed them.