

California Real Estate | 2 minute read
Zoom In: L.A. County Zoning Map Shows What You Can Build and Where in Los Angeles
BY Roxana Baiceanu | Jul 7, 2015
If you’ve ever built in Los Angeles County, you probably know that one of the main challenges you may be facing at the beginning is not knowing where the best areas for development are.
While there are many resources out there which provide specific information at the local level, researching each of them can be very time consuming. That’s why it would be extremely helpful to have an up-to-date comprehensive zoning resource covering the entire county which would allow you to see all areas of development.
This is where our L.A. zoning map comes in. Last updated in May, it’s the most up-to-date resource of its kind available at the county level.
The map is meant to help developers and investors alike quickly understand where it’s best to build and what zoning groups there are in any areas of interest: single family, multifamily, commercial, industrial, etc. Just look up any property on the map to see how its area is zoned:

If you are a PropertyShark subscriber you’ll also have access to the mini report available for any L.A. property. The report provides an overview of the property as well as the zoning code, its description, and a link to the county’s zoning site.
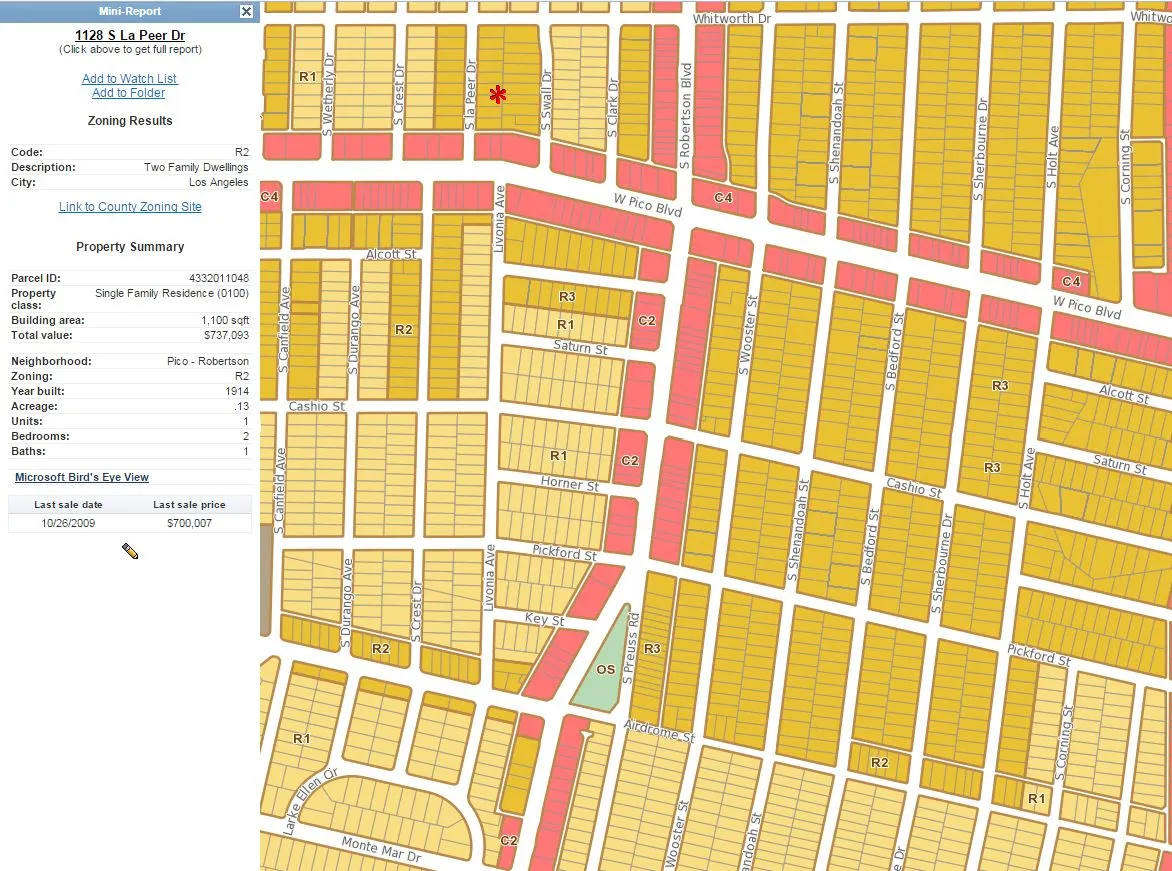
The mini report will also include a link to the full property report, where you can find extensive property information ranging from square footage, year built, and number of bedrooms, to ownership data, recent sales, and much more. Check out our sample report to see exactly what type of data is available for L.A. properties.
The list of useful maps available for L.A. County doesn’t stop here. Why not give our popular maps a try and see:
- how much L.A. home prices have changed in the last 10 years
- recent L.A. home sales
- tax values per square foot
- crime incidents
- how your lot is classified compared to your block and your neighborhood (Landuse Map)
- if your property is at risk of flooding or storm surge and if it requires flood insurance (FEMA Flood Zones)
- if your property is in a landslide, liquefaction or earthquake fault zone (Geohazards map)
- if there’s any fire burn history in your area (Wildfires map), and more.
Latest Posts
Want to stay on top of the real estate market?
Access comprehensive property data and ownership information with intuitive research tools.
POSTED IN: California Real Estate, Los Angeles Real Estate

Roxana is an associate editor with Multi-Housing News and Commercial Property Executive. In the past, she also created content for PropertyShark and Point2Homes’ blog pages. She also has 5 years of experience as a marketing copywriter.
Recent Reports

Locked-In Owners, Mobile Renters: Homeowners Stay Put as Renters Move 3.7x More Across Largest U.S. Cities
Renters became the primary drivers of long-distance mobility across the largest U.S. cities, moving 3.7 times more than owners in 2024, as high mortgage rates and housing costs kept many homeowners in place.

$4.6M Hudson Yards Maintains Top Spot, Luxury Sales in Malba Set $2.5M Price Record for Queens
Despite prices declining, Hudson Yards remained the most expensive NYC neighborhood, but TriBeCa’s growth closed the gap to under $400,000, while Malba set a new historic price record for Queens at $2.5 million, securing the highest ranking ever for the borough at #5.
2026 Q1 Foreclosure Report: Brooklyn Filings Fall Sharply, Bronx & Staten Island Hit New Peaks
Behind a deceptively mild citywide downtick, borough foreclosure markets pulled into significantly diverging paths as Brooklyn cases were nearly halved and the Bronx hit a new, record high. Meanwhile, Queens remained unchanged, Staten Island surged back up and Manhattan cooled slowly.