

RELEASED ON April 4, 2019
Brooklyn Foreclosures Drop 22% in Q1 2019, Bronx Foreclosures Up 28%
Robert Demeter | 4 minute read
Key takeaways: NYC first-time foreclosure cases decreased 5% in Q1 2019 In Q1 2019, Queens had the highest number of unique cases: 315 foreclosures The Bronx had the largest increase in foreclosure activity, with a 28% surge With a 22% drop, Brooklyn foreclosures decreased the most among the five boroughs NYC lis pendens decreased 13% overall in Q1 2019 New York City first-time foreclosure cases gradually decreased throughout 2018, and the trend seems to be continuing into Q1 2019, as well. Year-over-year, NYC foreclosure activity saw a 5% drop, with 870 residential properties heading to the auction block in the first quarter of 2019. Lis pendens cases also dipped YoY, decreasing 13% overall. Queens lead borough activity with 315 unique cases, followed by Brooklyn with 214. With a 28% increase, The Bronx saw the largest spike in first-time foreclosures, while Brooklyn and Staten Island cases dropped 22% and 19%, respectively. In Manhattan, homes hitting the auction block increased 6%. Quarter-over-quarter, foreclosures increased 21%, and the borough with the largest spike was the Bronx, registering a 65% surge. Queens: 315 Homes Hit the Auction Block in Q1 2019 With 315, Queens had the largest number of first-time foreclosure cases among…
Key takeaways:
-
- NYC first-time foreclosure cases decreased 5% in Q1 2019
- In Q1 2019, Queens had the highest number of unique cases: 315 foreclosures
- The Bronx had the largest increase in foreclosure activity, with a 28% surge
- With a 22% drop, Brooklyn foreclosures decreased the most among the five boroughs
- NYC lis pendens decreased 13% overall in Q1 2019
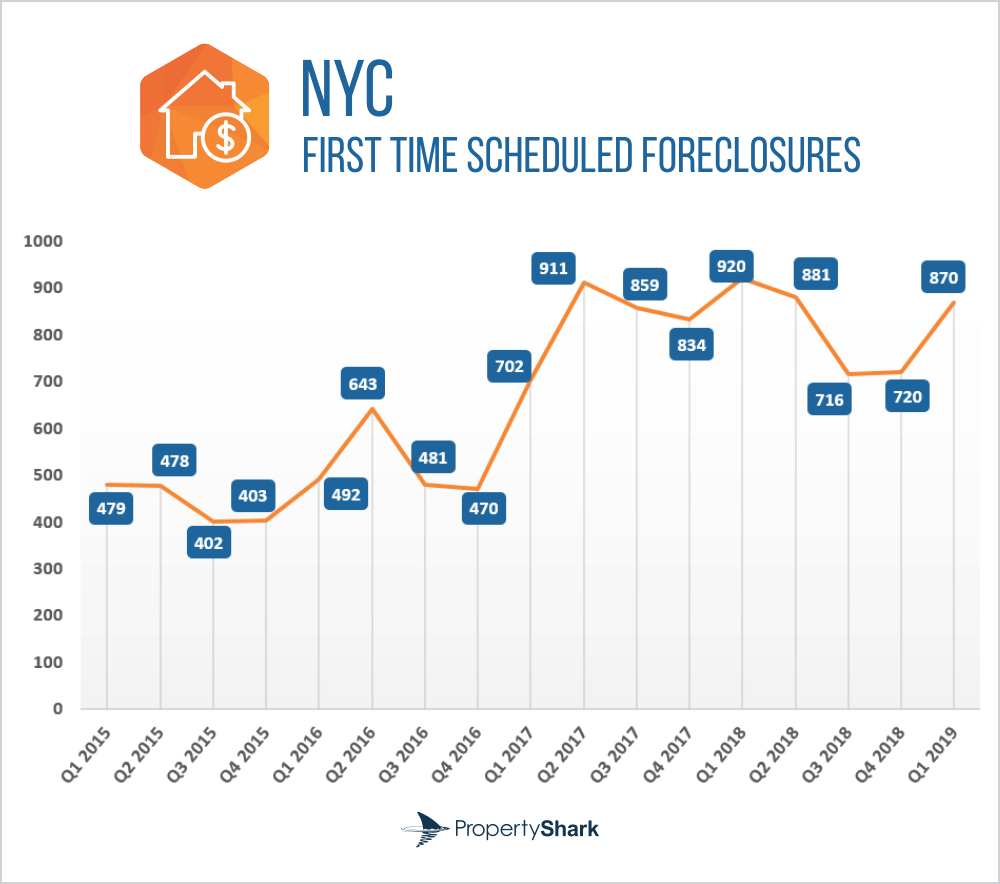
New York City first-time foreclosure cases gradually decreased throughout 2018, and the trend seems to be continuing into Q1 2019, as well. Year-over-year, NYC foreclosure activity saw a 5% drop, with 870 residential properties heading to the auction block in the first quarter of 2019. Lis pendens cases also dipped YoY, decreasing 13% overall.
Queens lead borough activity with 315 unique cases, followed by Brooklyn with 214. With a 28% increase, The Bronx saw the largest spike in first-time foreclosures, while Brooklyn and Staten Island cases dropped 22% and 19%, respectively. In Manhattan, homes hitting the auction block increased 6%.
Quarter-over-quarter, foreclosures increased 21%, and the borough with the largest spike was the Bronx, registering a 65% surge.
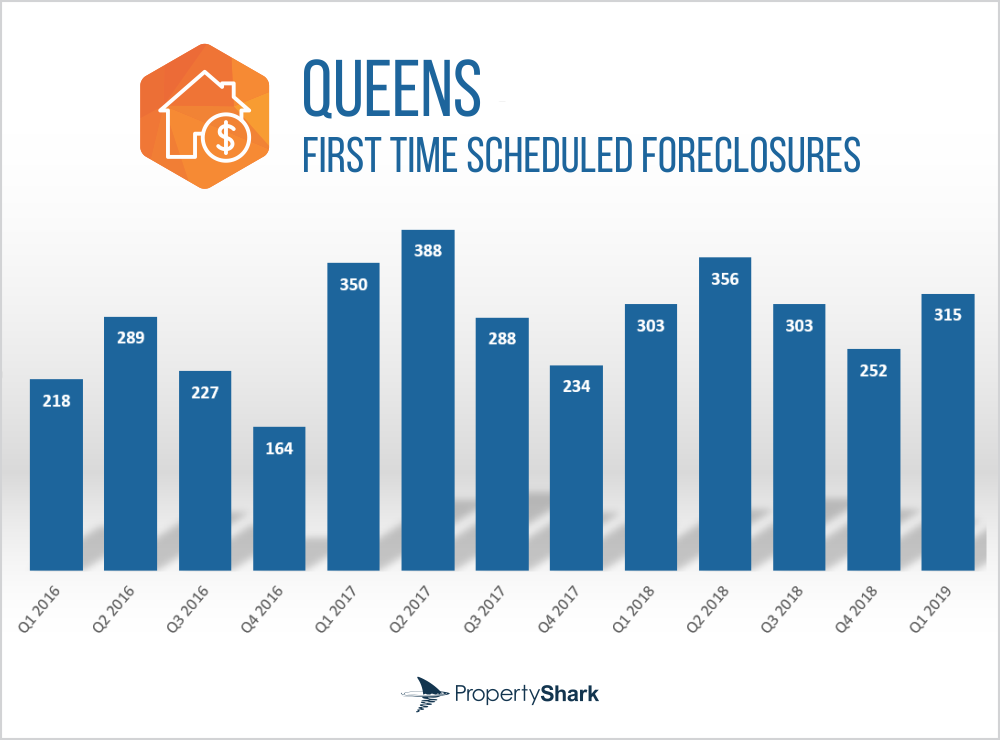
Queens: 315 Homes Hit the Auction Block in Q1 2019
With 315, Queens had the largest number of first-time foreclosure cases among the 5 boroughs in the first quarter of 2019. Year-over-year the borough saw a 4% increase, while quarter-over-quarter a 25% uptick was registered.
The 11434 zip-code encompassing Jamaica, South Jamaica, Rochdale and St. Albans neighborhoods had the most foreclosures in the borough: 28 unique cases.
Pre-foreclosures dropped 10% in Queens year-over-year and saw an uptick of 7% quarter-over-quarter. A total of 898 cases were registered.
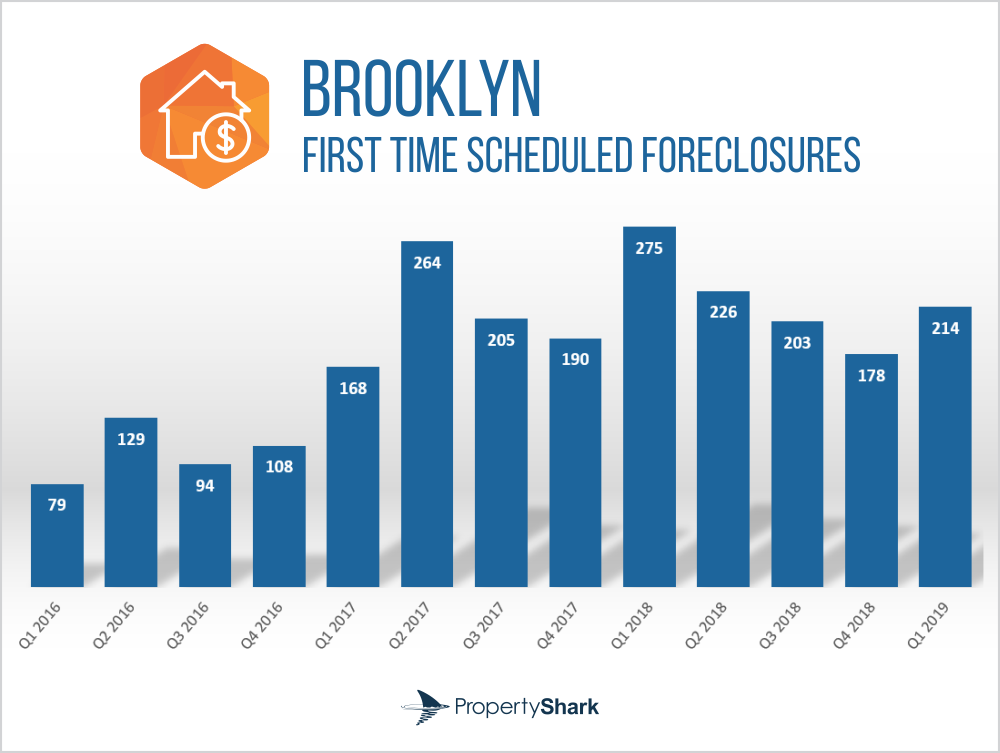
Brooklyn: Foreclosures Dropped 22% Year-Over-Year
214 residential properties headed to the auction block in the first quarter of 2019 in Brooklyn. Foreclosure activity dropped 22% year-over-year, while quarter-over-quarter it increased 20%.
The 11236 zip-code consisting of Canarsie, Flatlands, Marine Park, Mill Basin and Bergen Beach neighborhoods had the most foreclosures in the borough, with 30 cases.
Pre-foreclosures filed in Q1 2019 totaled 728 unique cases, down 12% year-over-year.
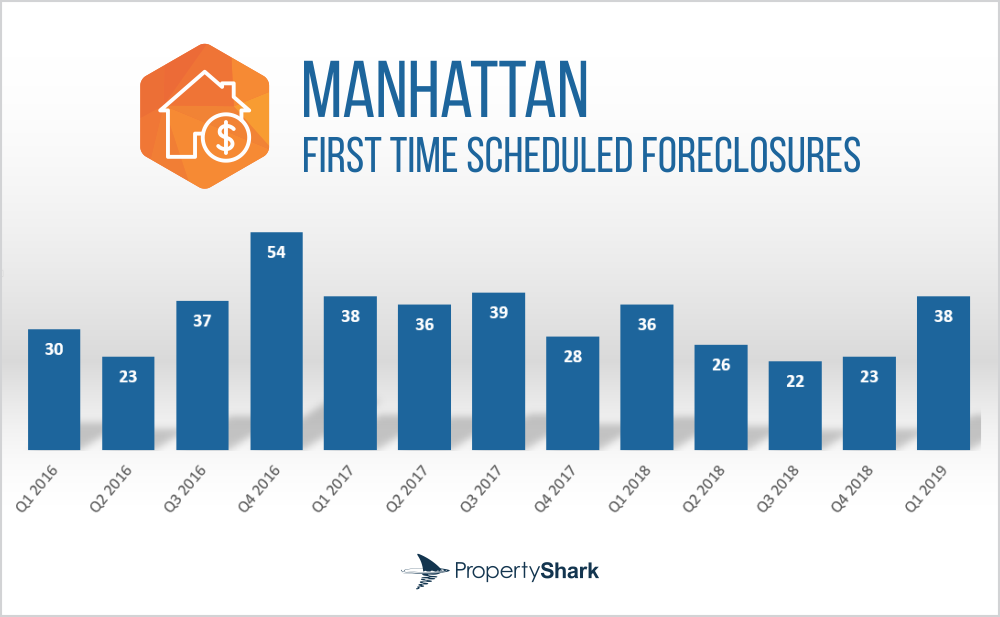
Manhattan: Foreclosure Activity Up 6% Year-Over-Year
A total of 38 homes hit the auction block in Manhattan in the first quarter of 2019, in line with the borough’s historical Q1 figures. Year-over-year, the borough registered a 6% increase.
Manhattan continues to display stability in terms of foreclosures, with first-time cases constantly hovering above 20 and below 40 over the last couple quarters.
Lis pendenscases decreased 8% year-over-year, with 104 residential properties entering the pre-foreclosure stage.
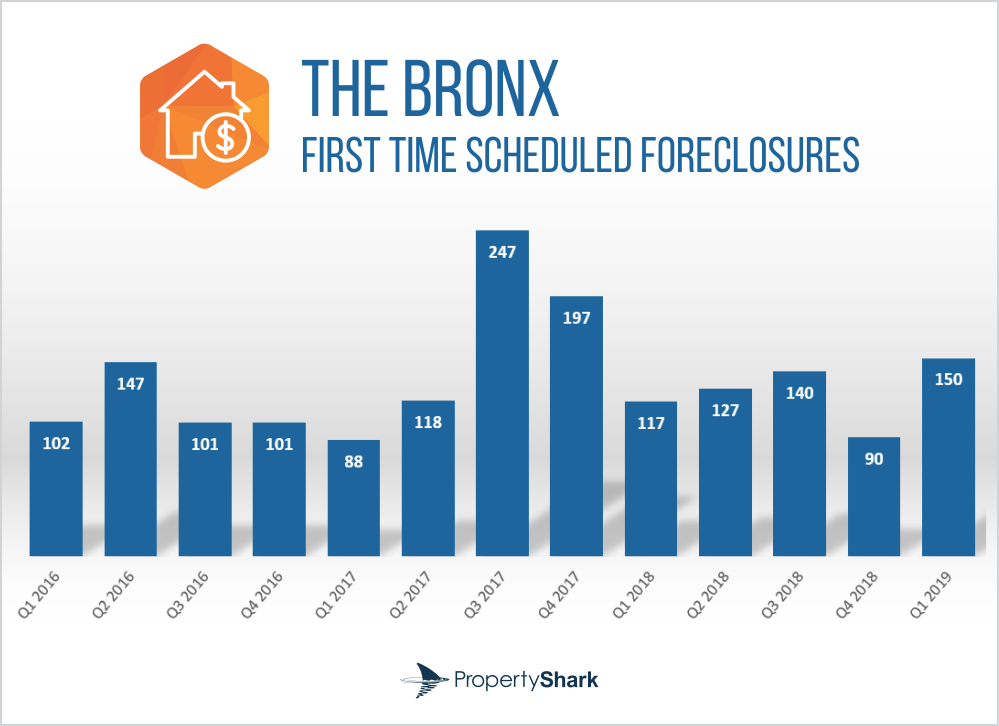
The Bronx: Foreclosures Up 28%, Largest Increase in Q1 2019
With foreclosures gradually decreasing last year in the borough, they went back up in the first three months of 2019, increasing 28% year-over-year and marking the largest increase among the 5 boroughs. The Bronx also saw the largest quarter-over-quarter increase, a staggering 67% spike.
A total of 150 unique cases were registered in the first three months of the year. The 10469-zip code had the highest number of residential homes (27) entering the foreclosure process in the Bronx.
Lis pendens dropped 28%, with 279 cases entering the pre-foreclosure process for the first time.
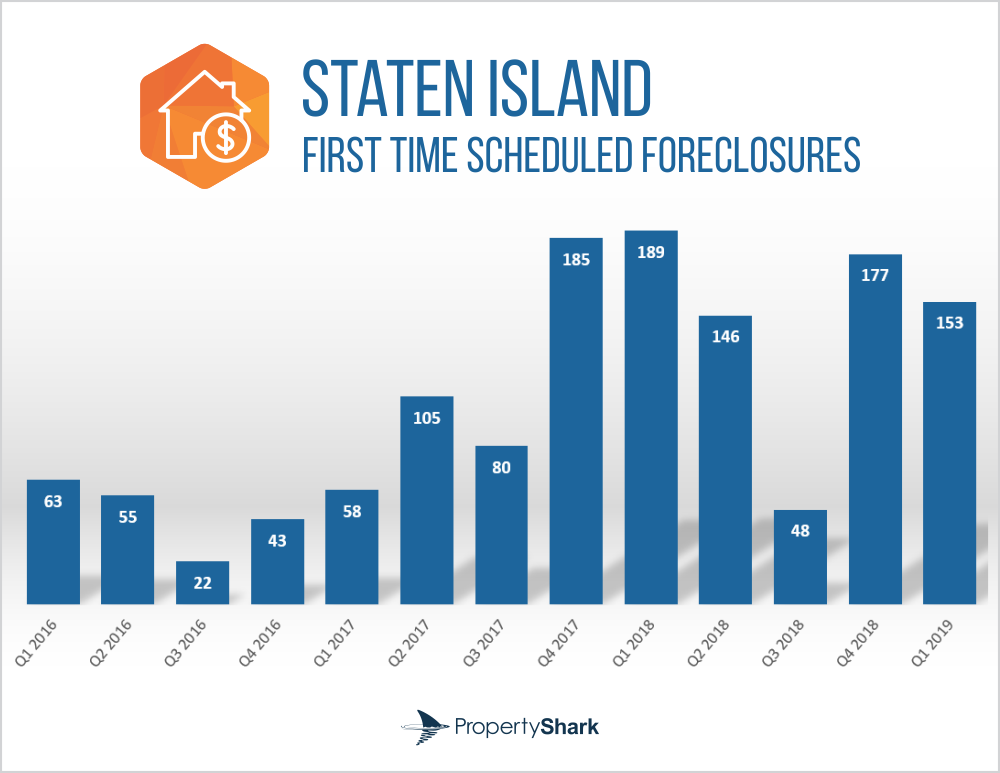
Staten Island: Foreclosures Down 19% Year-Over-Year
A total of 153 new foreclosure cases were registered in Staten Island in the first three months of 2019 a 19% drop over the same period last year. For the last previous quarters, foreclosures were above the 140 mark, the only exception being Q3 2018, when only 48 homes ended up being foreclosed.
Staten Island’s South Island neighborhood had the highest number of foreclosed properties in Q1 2019: 24.
Lis pendens dropped 12%, with 326 properties entering the pre-foreclosures process.
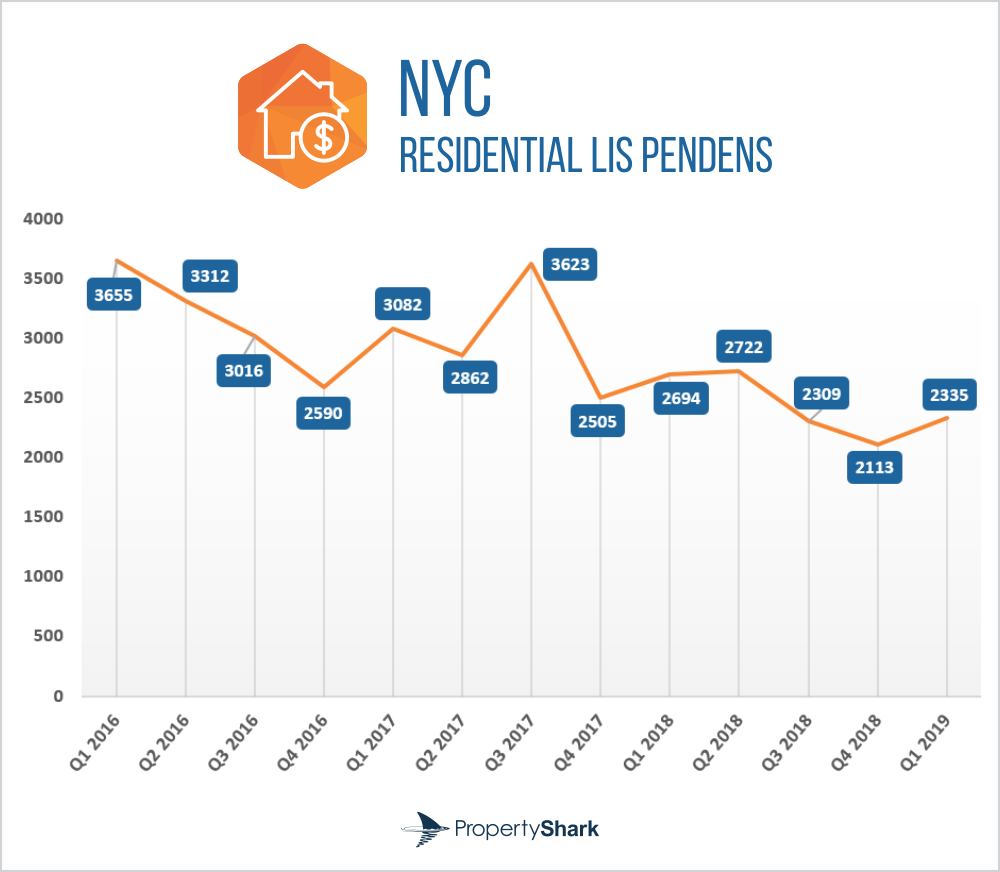
New York City Pre-Foreclosure Activity Drops 13% Year-Over-Year
Citywide lis pendens cases decreased 13% in Q1 2019 compared to the same period last year, with a total of 2,335 properties entering the pre-foreclosure process for the first time.
Each borough saw contractions, and the largest drop was registered in The Bronx (-28%). Lis pendens decreased 12% in Brooklyn, 10% in Queens and 8% in Manhattan.
Methodology
Having tracked foreclosure listings for over a decade, PropertyShark is the only service in New York that guarantees 100% coverage of the local foreclosure market. The stats include only first-time foreclosures to avoid over-reporting the number of distressed properties in the city, as auctions are frequently postponed and rescheduled.
We report separately on lis pendens (pre-foreclosure) filings—legal notices which mark the beginning of the foreclosure process.
Our report focuses on residential properties (single- and two-family homes, condo, and co-op units) that were scheduled for auction for the first time in Q1 2019.
Pre-foreclosure data refers to unique properties that received at least one lis pendens filing in Q1 2019. This may be a first-time filing or a re-filing. The same building class restrictions apply, excluding co-ops. If more than 3 units were referenced on the same lis pendens filing, they were not counted at all in order to avoid counting entire buildings.
Access Every New York Foreclosure — First.
Get full access to NYC foreclosures, pre-foreclosures, REOs & auctions. Updated daily with lien & owner data. 100% coverage.
POSTED IN: Market Studies, New York Foreclosures

Robert is a copywriter at CommercialCafe and brings 3+ years of experience in commercial real estate. He previously worked as a copywriter at PropertyShark, as a senior associate editor at Commercial Property Executive and Multi-Housing News, and also wrote monthly market reports at Yardi Matrix.
Recent Reports

NYC Resale Gains & Losses: Every Borough Made Money in 2025, Except Manhattan
In 2025, NYC home-sellers mostly made money. But, in Manhattan, resales came with losses — and it was apartments and recent buyers that absorbed them.

World Cup or Your Mortgage/Rent? Ticket Prices Rival Host City Housing Costs
World Cup ticket prices rival monthly housing expenses in the 11 U.S. host cities, with even the cheapest seats covering weeks or even months of rent or mortgage payments.

Locked-In Owners, Mobile Renters: Homeowners Stay Put as Renters Move 3.7x More Across Largest U.S. Cities
Renters became the primary drivers of long-distance mobility across the largest U.S. cities, moving 3.7 times more than owners in 2024, as high mortgage rates and housing costs kept many homeowners in place.