

Metro New York Foreclosure Report
Brooklyn Foreclosures Up 64% Y-o-Y, While Queens Sees 13% Decrease
RELEASED ON April 4, 2018 | 4 minute read
Here are the key findings from our NYC Foreclosure Report for Q1 2018: 920 homes were scheduled for auction for the first time in Q1 2018, up 31% compared to Q1 2017 Brooklyn saw a 64% year-over-year increase in new foreclosure auctions New foreclosures in the Bronx went up 33% year-over-year, as 117 homes were scheduled for auction Queens recorded a 13% decrease in homes headed for the auction block Staten Island foreclosures skyrocketed 226% year-over-year, as 189 new cases were recorded Lis pendens across NYC were down 13% year-over-year Our yearly foreclosure report for 2017 revealed that the number of homes scheduled for auction reached the highest level in 8 years, having gone up 58% year-over-year. The first quarter of 2018 brought with it a further increase in new foreclosures as the number of cases climbed 31% year-over-year. 920 new foreclosures were recorded in Q1 2018, compared to 702 in Q1 2017. While we’re seeing the highest number of foreclosed homes in any quarter since 2009, lis pendens cases were down 13% year-over-year, meaning that fewer homeowners are entering the foreclosure process. Brooklyn and the Bronx led by increases in new foreclosures, while cases went down 13% in Queens. Here…
Here are the key findings from our NYC Foreclosure Report for Q1 2018:
- 920 homes were scheduled for auction for the first time in Q1 2018, up 31% compared to Q1 2017
- Brooklyn saw a 64% year-over-year increase in new foreclosure auctions
- New foreclosures in the Bronx went up 33% year-over-year, as 117 homes were scheduled for auction
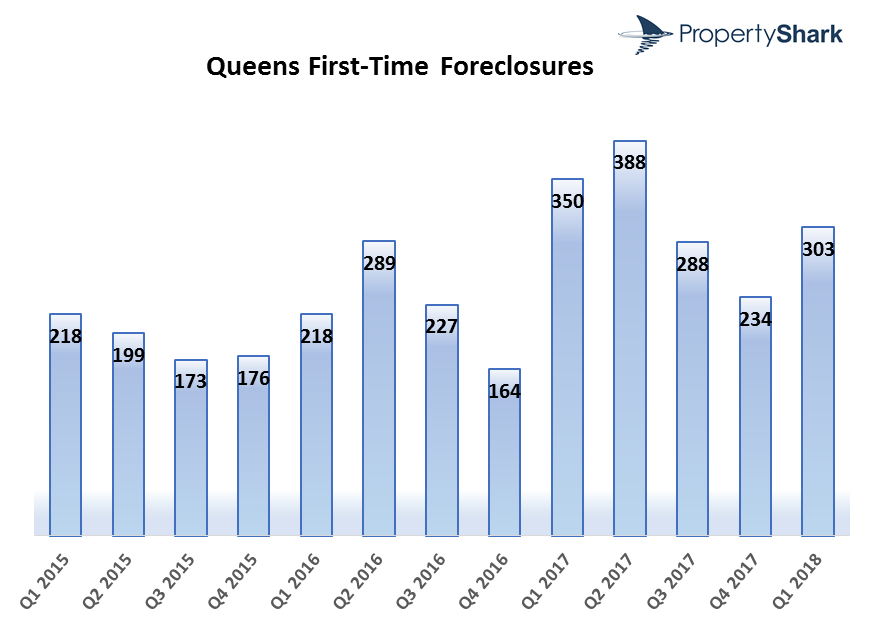
- Queens recorded a 13% decrease in homes headed for the auction block
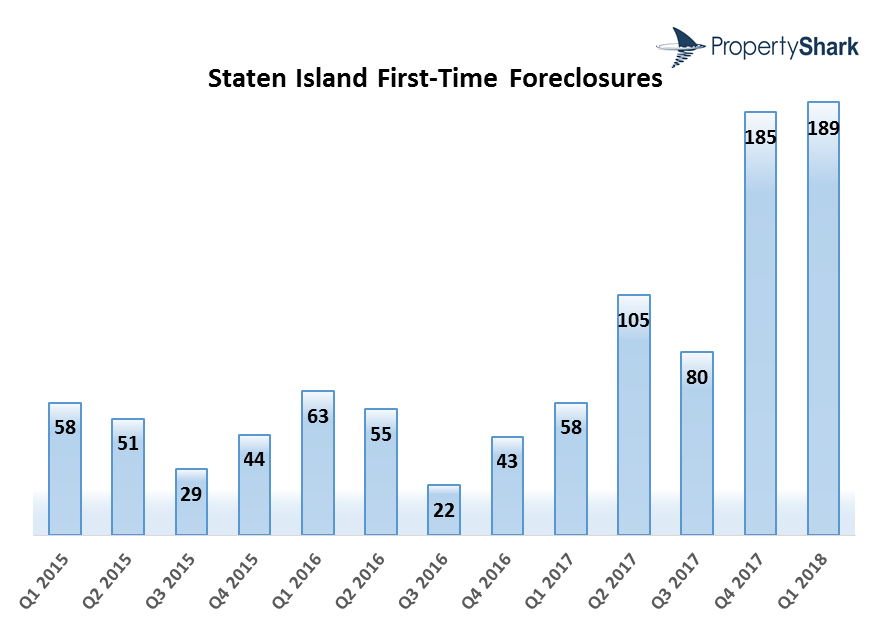
- Staten Island foreclosures skyrocketed 226% year-over-year, as 189 new cases were recorded
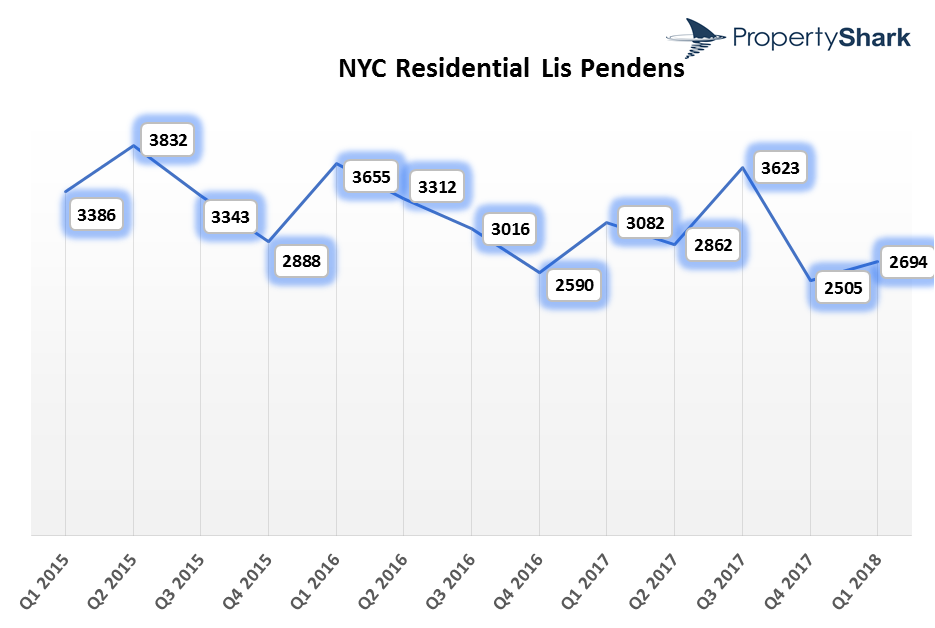
- Lis pendens across NYC were down 13% year-over-year
Our yearly foreclosure report for 2017 revealed that the number of homes scheduled for auction reached the highest level in 8 years, having gone up 58% year-over-year. The first quarter of 2018 brought with it a further increase in new foreclosures as the number of cases climbed 31% year-over-year.
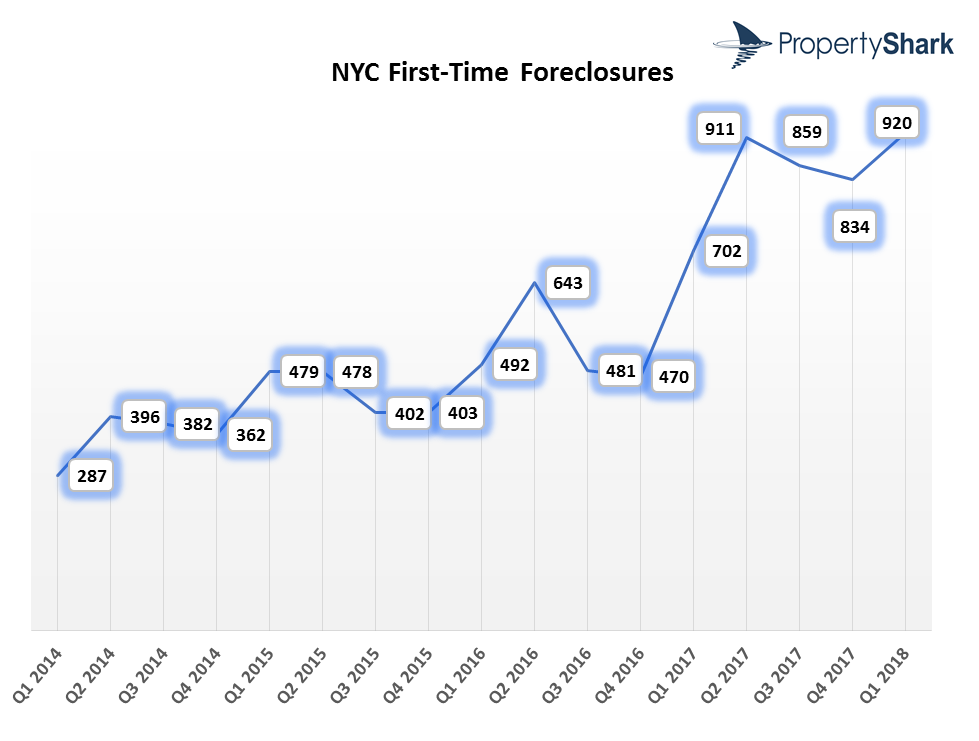
920 new foreclosures were recorded in Q1 2018, compared to 702 in Q1 2017. While we’re seeing the highest number of foreclosed homes in any quarter since 2009, lis pendens cases were down 13% year-over-year, meaning that fewer homeowners are entering the foreclosure process. Brooklyn and the Bronx led by increases in new foreclosures, while cases went down 13% in Queens. Here is a breakdown by borough and a comparison with Q1 2017:
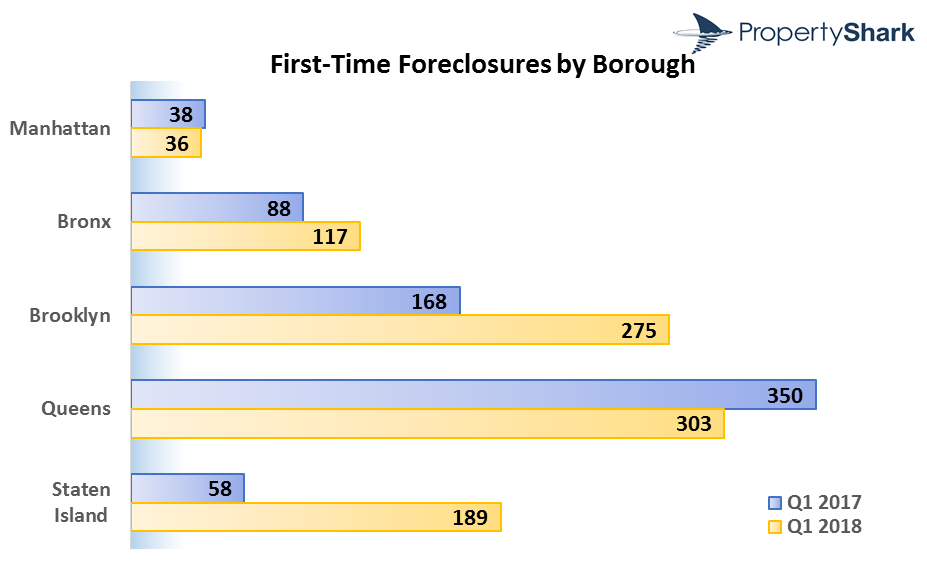
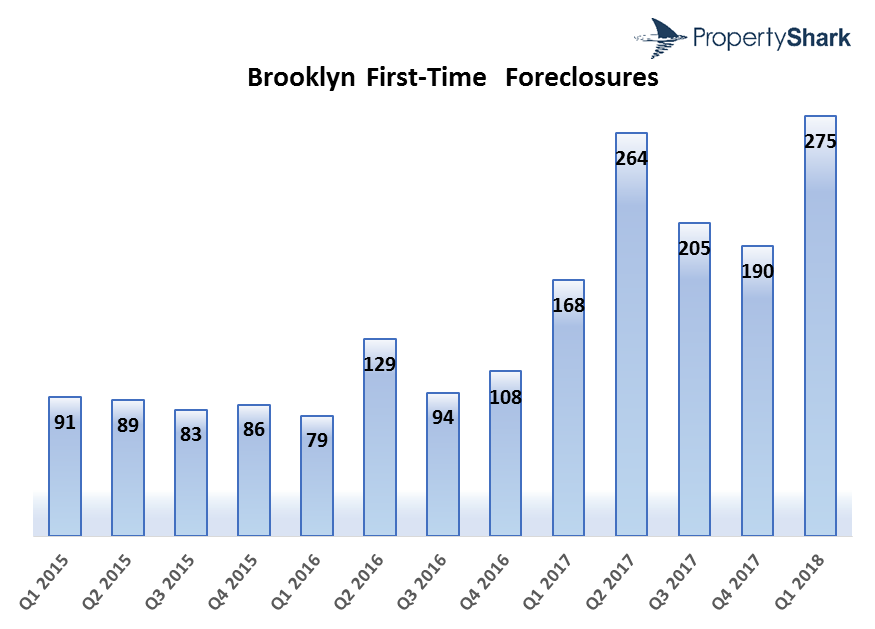
Brooklyn foreclosures up 64% year-over-year, driving the city’s increase in new cases
In Brooklyn, 275 homes were scheduled for auction for the first time during Q1 2018, the highest number ever recorded in the borough and close to the level recorded in Queens during the same period. By comparison, in Q1 2017, 168 Brooklyn homes were scheduled for auction. The increase is even more dramatic if we were to compare this past quarter with the numbers recorded two years ago–only 79 properties were foreclosed during Q1 2016. This trend might be partly due to recent changes made by the Kings County Supreme Court to consolidate cases under fewer judges in order to decrease the borough’s backlog of distressed properties.
The highest number of new foreclosures in Brooklyn comes from its eastern part, and zip code 11236 covering Canarsie and Flatlands had the most cases of any NYC zip code – 45 homes were scheduled for auction here.
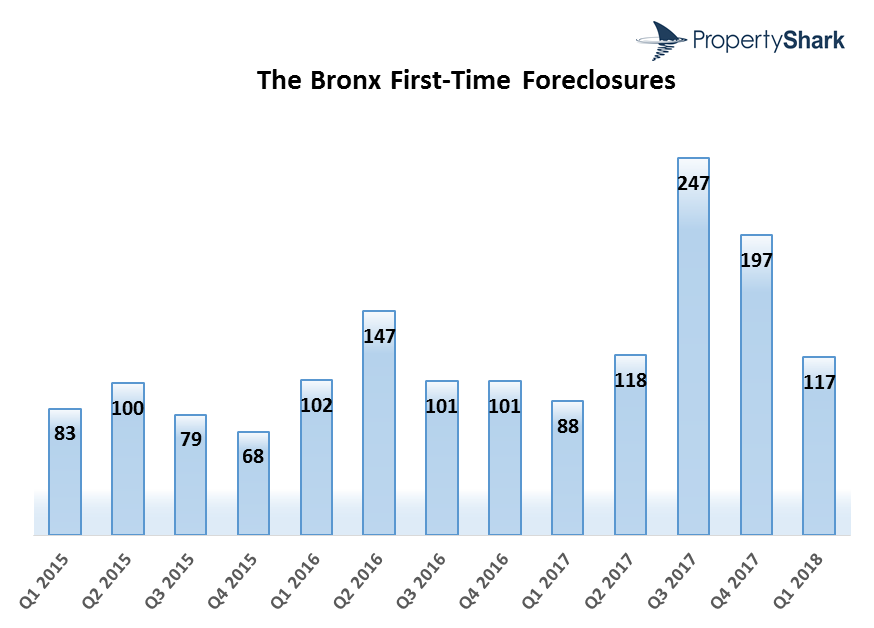
New foreclosures in the Bronx increase 33% year-over-year
The first quarter of 2018 brought a 33% hike in new cases as 117 homes in the Bronx headed for the auction block. This represents a 41% drop compared to Q4 2017, when 197 homes in the borough had an auction scheduled. Zip code 10462, covering parts of Van Nest, Parkchester, Bronxdale, and Morris Park had 25 auctions, the highest in any zip code in the Bronx.
Staten Island closes Q1 with another dramatic increase in first-time auctions
189 homes on Staten Island were scheduled for auction in Q1 2018, marking a sharp 226% year-over-year increase. The borough had low foreclosure activity over the past years, but this trend changed in 2017 when the number of cases started going up, with a spike in Q4 2017 when 185 new foreclosures were recorded.
Queens sees a 13% decrease in foreclosure cases; Manhattan stays stable
Bucking the city-wide trend, foreclosures in Queens went down compared to the same quarter last year, registering a 13% year-over-year decrease in Q1 2018. The borough’s highest foreclosure activity was still recorded in Jamaica’s 11434 zip code where 32 homes were scheduled for auction during the first quarter of 2018.
The other borough to close Q1 with a decrease in first-time foreclosures is Manhattan, where foreclosure activity did not go through any major fluctuations over the years. In Q1 2018, 36 new foreclosure auctions were scheduled, translating into a 5% year-over-year decrease.
Homes entering the foreclosure process down 13% year-over-year
While the number of homes scheduled for auction in NYC is going up, new lis pendens filings decreased 13% year-over-year city-wide. In Q1, 2,694 homes entered pre-foreclosure compared to 3,082 during the same quarter last year. The Bronx was the only borough to register an uptick in new cases, of 2%, while all other boroughs saw decreases.
Methodology
Having tracked foreclosure listings for over a decade, PropertyShark is the only service in New York that guarantees 100% coverage of the local foreclosure market. The stats include only first-time foreclosures to avoid over-reporting the number of distressed properties in the city as auctions are frequently postponed and rescheduled. We report separately on lis pendens filings – legal notices which mark the beginning of the foreclosure process.
Our report focuses on residential properties (single- and two-family homes, condo, and co-op units) that were scheduled for auction for the first time in Q1 2018. Auction postponements are fairly common so by removing them from our analysis we avoid over-reporting the number of properties affected by foreclosure.
Pre-foreclosure data refers to unique properties that received at least one lis pendens filing in Q1 2018. This may be a first-time filing or a re-filing. The same building class restrictions apply (excluding co-ops). If more than 3 units were referenced on the same lis pendens filing they were not counted at all in order to avoid counting entire buildings.
Access Every New York Foreclosure — First.
Get full access to NYC foreclosures, pre-foreclosures, REOs & auctions. Updated daily with lien & owner data. 100% coverage.
POSTED IN: Market Studies, New York Foreclosures

With 10+ years of experience at PropertyShark, Andra covers the latest product updates and market reports for our blog. Her work has been featured in The Real Deal, Curbed, TimeOut, The Daily Mail, Business Insider, Crain’s New York.
Recent Reports

Prices Rise in 32 of NYC’s Leading Neighborhoods as City and Manhattan Hit Record Highs
Q2 2026 saw NYC and Manhattan reach historic highs, with Brooklyn and Queens marking close to new records as well. Meanwhile, Hudson Yards remained at the top, Central Midtown posted its highest price ever and Carroll Gardens marked its third consecutive quarter over $2 million

2026 Q2 Foreclosure Report: Bronx Caseload Hits 7-Year High, Brooklyn & Manhattan Slow to 4-Year Low
Manhattan yet again slowed to become the city’s least active foreclosure market, Brooklyn’s caseload dropped so low it barely edged out Staten Island, while the Bronx heated up enough to surpass all boroughs except Queens.

NYC Resale Gains & Losses: Every Borough Made Money in 2025, Except Manhattan
In 2025, NYC home-sellers mostly made money. But, in Manhattan, resales came with losses — and it was apartments and recent buyers that absorbed them.