
New York Real Estate | 3 minute read
Flatiron Ranks #1 among the Priciest Neighborhoods in NYC
BY Andra Rus | Oct 11, 2017
Key Takeaways:
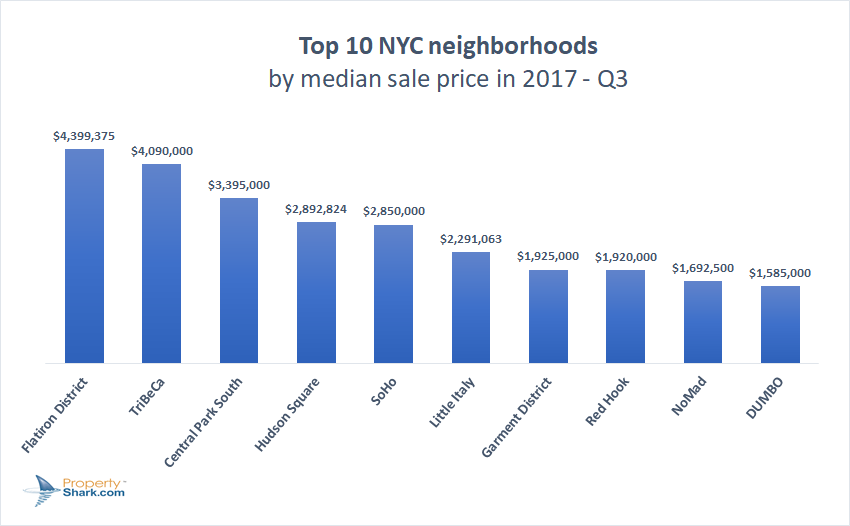
- The Flatiron District is the most expensive neighborhood in NYC in Q3
- TriBeCa occupies the second spot, with sales activity dropping considerably
- The exclusive Central Park South rounds out the top 3, with a median sale price of $3.4M
- Red Hook is Brooklyn’s most expensive neighborhood in Q3, overthrowing DUMBO
In its most recent quarterly report, Corcoran states that Q3 2017 marked the second consecutive quarter of annual growth for the Manhattan residential market. Meanwhile, the Brooklyn market continued to keep up the pace set at the beginning of the year, despite the limited resale inventory now facing the borough.
The 50 priciest neighborhoods in New York City include, as usual, hot areas like TriBeCa, SoHo and the Flatiron District. However, the third quarter of this year also brought up-and-coming neighborhoods, like the Garment District and Red Hook, to our attention. While many industry insiders may be used to TriBeCa being the priciest neighborhood in New York City, in Q3 2017 the neighborhood took the second spot, while the upscale SoHo took a tumble, landing in 5th place.
After ranking second in Q2, the Flatiron District stole the show in Q3 and became the priciest neighborhood in New York City. The median sale price reached $4,399,375, a 220% increase compared to the same time last year. This massive growth is largely attributed to the 39 condos that sold at 41-43 East 22nd Street, where prices ranged from $2.6 million to $9.4 million.
TriBeCa takes a step back in Q3, and lands in the second spot with a 9% drop, to a median sale price of $4,090,000. Sales activity in the landmark neighborhood slowed down considerably in Q3, with only 70 transactions closed, while in Q3 2016 TriBeCa saw a total of 153 transactions close, amounting to a year-over-year decrease of over 50%.
Central Park South takes the third spot with a median sale price of $3,395,000–an annual growth of 103%. The rise in the median sale price in Central South Park can be attributed to the four transactions that took place at the high-end ONE57 building at 157 West 57 Street, where units fetched prices between $3.6 and $6.6 million.
Check out the complete top 10 list below:
Brooklyn’s Red Hook, a new entry on our list, ranked 8th with a median sale price of $1,920,000, thus snatching the title of the priciest Brooklyn neighborhood in Q3. One of the main reasons Red Hook made it onto our list this quarter is the new townhouse development on King Street. First announced by YIMBY in 2015, the project came online in the early months of 2016. The massive project is quite uncommon for the Brooklyn scene, and for Red Hook as well, but it proved to be a real success, bringing in significant growth to the borough’s residential market.
Apart from Red Hook, Brooklyn’s Dumbo ranked 10th, making it the second neighborhood the borough had in the top 10. Perhaps not surprisingly, Brooklyn accounts for 21 of the top 50 neighborhoods on our list. On the other hand, Queens might not have any neighborhoods in the top 10 but, out of the 9 neighborhoods it had in the top 50, all of them saw annual increases in median sale prices.
Ranking 27th in our top 50, Belle Harbor is the priciest neighborhood in Queens. Belle Harbor prices increased 27% over last year, reaching a median sale price of $1,072,500. Other neighborhoods, like Ditmars-Steinway, East Flushing and Douglaston, also saw prices increase by double-digits. The most impressive growth can be observed in Douglaston, where prices rose 45% year-over-year.
You can see the full ranking in the table below:
| No | BOROUGH | NEIGHBORHOOD | MEDIAN SALE PRICE | vs Q3 2016 | Transactions |
|---|---|---|---|---|---|
| 1 | Manhattan | Flatiron District | $4,399,375 | 220% | 88 |
| 2 | Manhattan | TriBeCa | $4,090,000 | -9% | 70 |
| 3 | Manhattan | Central Park South | $3,395,000 | 103% | 15 |
| 4 | Manhattan | Hudson Square | $2,892,824 | 61% | 26 |
| 5 | Manhattan | SoHo | $2,850,000 | -23% | 39 |
| 6 | Manhattan | Little Italy | $2,291,063 | 76% | 5 |
| 7 | Manhattan | Garment District | $1,925,000 | - | 5 |
| 8 | Brooklyn | Red Hook | $1,920,000 | - | 7 |
| 9 | Manhattan | NoMad | $1,692,500 | -15% | 44 |
| 10 | Brooklyn | DUMBO | $1,585,000 | -35% | 27 |
| 11 | Manhattan | Chelsea | $1,470,000 | 26% | 125 |
| 12 | Brooklyn | Brooklyn Heights | $1,420,000 | 39% | 51 |
| 13 | Manhattan | Central Midtown | $1,400,000 | 8% | 57 |
| Brooklyn | Cobble Hill | $1,400,000 | 29% | 17 | |
| 14 | Brooklyn | Columbia Street Waterfront District | $1,315,000 | 68% | 6 |
| 15 | Manhattan | Clinton - Hell's Kitchen | $1,295,000 | 31% | 124 |
| 16 | Manhattan | Upper West Side | $1,285,000 | 19% | 541 |
| 17 | Manhattan | West Village | $1,260,000 | 1% | 57 |
| 18 | Brooklyn | Gowanus | $1,250,000 | 10% | 9 |
| Manhattan | Greenwich Village | $1,250,000 | -29% | 105 | |
| 19 | Brooklyn | Carroll Gardens | $1,245,000 | -2% | 24 |
| Manhattan | Financial District | $1,245,000 | 15% | 111 | |
| 20 | Manhattan | Upper East Side | $1,200,000 | 15% | 642 |
| 21 | Manhattan | Sutton Place | $1,150,000 | 29% | 65 |
| 22 | Manhattan | Battery Park City | $1,141,458 | -26% | 42 |
| 23 | Brooklyn | Boerum Hill | $1,133,678 | 9% | 24 |
| 24 | Brooklyn | Park Slope | $1,130,000 | 13% | 143 |
| 25 | Manhattan | Roosevelt Island | $1,116,159 | 3% | 10 |
| 26 | Brooklyn | Fort Greene | $1,081,000 | 58% | 24 |
| 27 | Queens | Belle Harbor | $1,072,500 | 27% | 8 |
| 28 | Brooklyn | Prospect - Lefferts Gardens | $1,050,000 | -5% | 13 |
| 29 | Brooklyn | Greenwood Heights | $1,030,000 | 5% | 13 |
| 30 | Manhattan | Theatre District - Times Square | $985,000 | 20% | 9 |
| 31 | Manhattan | Gramercy Park | $981,601 | 12% | 93 |
| 32 | Queens | Hunters Point | $967,203 | 3% | 44 |
| 33 | Brooklyn | Greenpoint | $965,000 | -11% | 24 |
| 34 | Brooklyn | Wingate | $950,000 | 105% | 9 |
| 35 | Manhattan | East Village | $932,500 | -3% | 69 |
| 36 | Brooklyn | Prospect Heights | $930,250 | 22% | 90 |
| 37 | Brooklyn | Mill Basin | $930,000 | 2% | 11 |
| 38 | Brooklyn | Williamsburg | $910,000 | 6% | 131 |
| 39 | Brooklyn | Bedford-Stuyvesant | $899,000 | 30% | 61 |
| 40 | Brooklyn | Dyker Heights | $895,000 | 23% | 12 |
| 41 | Brooklyn | Downtown Brooklyn | $885,000 | 10% | 33 |
| 42 | Queens | Ditmars - Steinway | $879,000 | 10% | 5 |
| 43 | Queens | Queensboro Hill | $868,000 | 6% | 7 |
| 44 | Queens | Auburndale | $850,000 | 9% | 25 |
| Brooklyn | Borough Park | $850,000 | 27% | 38 | |
| 46 | Queens | East Flushing | $817,500 | 14% | 15 |
| 47 | Queens | Jamaica Estates | $810,000 | - | 37 |
| 48 | Queens | Fresh Meadows | $807,500 | 7% | 32 |
| 49 | Manhattan | Lower East Side | $798,500 | 2% | 48 |
| 50 | Queens | Douglaston | $770,000 | 45% | 35 |
| Manhattan | Turtle Bay | $770,000 | -6% | 84 |
Share this on your site
Check out The most expensive neighborhoods in NYC in Q2 2017 and the 2016 Top most expensive NYC neighborhoods: Q1 and Q3.
Methodology:
The median sale prices were calculated based on residential property sales closed between July 1st, 2017 and September 30th, 2017. The residential properties included in the stats are single-family homes, condos and co-ops.
The boundaries to some of the neighborhoods in Manhattan have been changed from previous studies. Therefore, data on several small neighborhoods is now included in stats for larger areas. For example, NoLita is now included in Little Italy; NoHo is included in Greenwich Village; and Carnegie Hill, Lenox Hill and Yorkville are included in the Upper East Side.
Latest Posts
Want to stay on top of the real estate market?
Access comprehensive property data and ownership information with intuitive research tools.
POSTED IN: New York Real Estate

With 10+ years of experience at PropertyShark, Andra covers the latest product updates and market reports for our blog. Her work has been featured in The Real Deal, Curbed, TimeOut, The Daily Mail, Business Insider, Crain’s New York.
Recent Reports

Prices Rise in 32 of NYC’s Leading Neighborhoods as City and Manhattan Hit Record Highs
Q2 2026 saw NYC and Manhattan reach historic highs, with Brooklyn and Queens marking close to new records as well. Meanwhile, Hudson Yards remained at the top, Central Midtown posted its highest price ever and Carroll Gardens marked its third consecutive quarter over $2 million

2026 Q2 Foreclosure Report: Bronx Caseload Hits 7-Year High, Brooklyn & Manhattan Slow to 4-Year Low
Manhattan yet again slowed to become the city’s least active foreclosure market, Brooklyn’s caseload dropped so low it barely edged out Staten Island, while the Bronx heated up enough to surpass all boroughs except Queens.

NYC Resale Gains & Losses: Every Borough Made Money in 2025, Except Manhattan
In 2025, NYC home-sellers mostly made money. But, in Manhattan, resales came with losses — and it was apartments and recent buyers that absorbed them.