

New York Real Estate | 4 minute read
A Decade of Home Price Changes in NYC Reveals a Very Divided City
BY Roxana Baiceanu | Oct 14, 2015
Everywhere we turn these days, the real estate headlines seem to announce the same thing: “Average home prices in Manhattan hit a new record.” Then a new one.
And it’s not just in Manhattan that home prices have been sky-rocketing month after month. In parts of Brooklyn and Queens average home price tags are boasting staggering numbers, as if what’s happening in Manhattan has started to take effect all over New York City. But is the real estate boom we keep hearing about really the rule in the NYC real estate market?
The map below reveals that, in reality, almost half of Brooklyn and Queens, together with several neighborhoods in Northern Manhattan show stagnation and even decreases in median home prices over the past decade (all values have been adjusted for inflation).
This portrays New York City as a very divided metropolis, but not necessarily split between rich and poor, but rather between the wealthy and the middle class. The latter, no longer able to afford homes in the formerly classy-but-affordable areas are being pushed toward South Brooklyn or Queens.
Note: The darker and lighter shades of green show increases while the red and its lighter shades show stagnation and decreases in home prices.

Manhattan: Where Should You Have Really Invested 10 Years Ago?
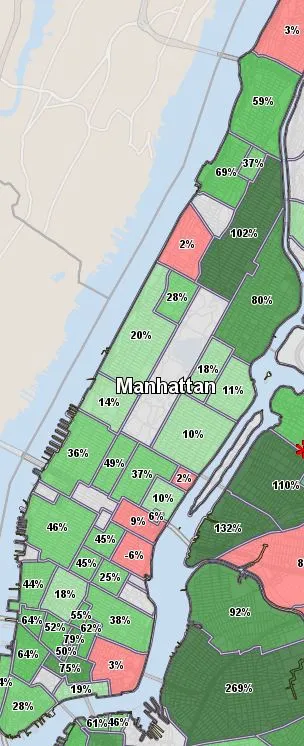
As you might have expected, the traditionally rich areas around Central Park have gotten more expensive to live in over the past decade. However, the increases in home prices there were quite modest, going up by only 20%.
Among the pricier nabes which registered the most significant increases were NoLita and Chinatown, where the median price per square foot jumped by 79% and 75% respectively, hitting staggering values ($1,813/sq.ft in NoLita and $1,216/sq.ft. in Chinatown).
The most remarkable changes in the Manhattan housing market took place, however, in Central and East Harlem.
- In Harlem, the median home price per square foot was $709/sq.ft. in 2014, a 102% increase from $351/sq.ft.
- East Harlem saw an increase of 80%, from $468/sq.ft. to $842 sq.ft.
Brooklyn: Williamsburg Sees Median Home Price/Sq.Ft. Go Up by 269%
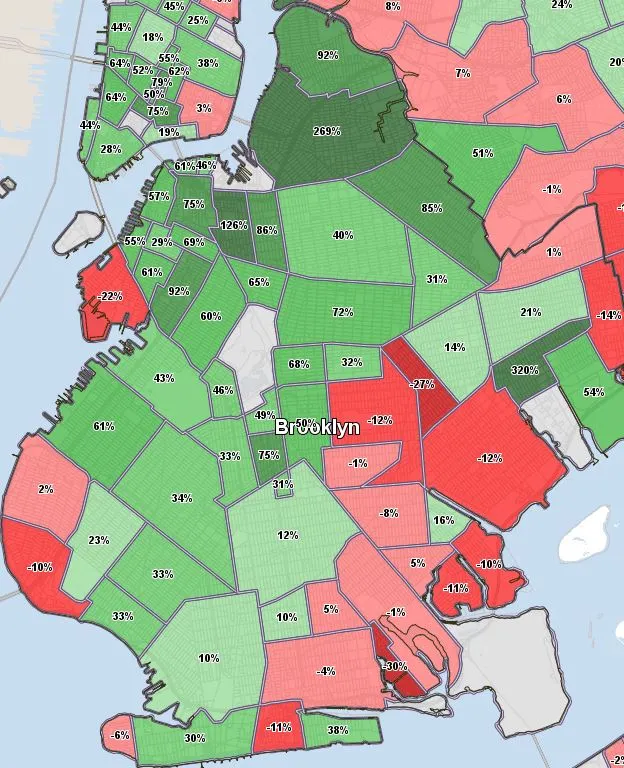
Brooklyn has always been divided into two parts – the Brooklyn of Carroll Gardens, Park Slope, and Brooklyn Heights and the rest of Brooklyn. The wealthy areas, under the impact of gentrification, continued to see their home prices rise between 2004 and 2014, but surprising transformations took place in less developed neighborhoods too.
In Williamsburg, part of the top ten list of the most expensive neighborhoods in NYC in 2014, the home prices sky rocketed from $275/sq.ft. in 2004 to $1,015/sq.ft. in 2014, marking a 269% increase.
Elsewhere in Brooklyn, however, several affluent oceanside nabes took a hit as a result of Hurricane Sandy. In Red Hook, the median home price per square foot saw a cut of 22%, from $526/sq.ft. to $413/sq.ft. In Brighton Beach and Basin Mill the decrease was 11%.
The biggest increase in median home price per square foot took place in what was considered the least developed neighborhood in Brooklyn, New Lots. Several housing programs here led to a 320% increase in median home prices, which reached $296/sq.ft. in 2014.
Queens: the Next Brooklyn?
In Queens, the biggest home price increases can be seen in the neighborhoods located at the border with Manhattan. These areas, albeit industrial, were still considered middle-class even in 2004. Thus, one can hardly talk here about a phenomenon similar to what Williamsburg is in Brooklyn.
- In Hunters Point the median home price/sqft. went up by 132% between 2004 and 2014, from $399 to $924. The new price tag brings Hunters Point to the same level with Park Slope and other rich neighborhoods in Brooklyn;
- LIC also saw an impressive 110% jump in median home price/sqft (from $326 to $685);
- Sunnyside and South Astoria, which were considered upper-middle-class even back in 2004, have kept the same status in 2014. Median home prices went up by 66% in Sunnyside reaching $664/sq.ft while in South Astoria they climbed by 53% ($625 /sq.ft. in 2014)..
The Bronx: A Declining Housing Market
With only a few exceptions, home prices throughout the Bronx have been following a descending path in the last decade. Concourse Village and Fieldston registered the most significant increases in median home price/sq.ft — 59% and 43% respectively.
NYC Caught between Sky-Rocketing Home Prices and Distressed Properties
For those looking for an answer to why we’re seeing this stark divide, our NYC Pre-Foreclosure map could help.
If we are to compare the home price map with a map of distressed properties, we can easily see that the areas which registered stagnation or decreases in median home prices are also seeing the most intense activity in pre-foreclosure or lis pendens filings. This is usually one of the main factors which trigger a decrease in home prices.
If a lis pendens is filed for a property, it means that the owner failed to make the monthly mortgage or tax payments. The next step after the filing is the foreclosure auction.
Click on the map and zoom in to see how many properties are in lis pendens in an area of interest:

Latest Posts
Want to stay on top of the real estate market?
Access comprehensive property data and ownership information with intuitive research tools.
POSTED IN: New York Real Estate

Roxana is an associate editor with Multi-Housing News and Commercial Property Executive. In the past, she also created content for PropertyShark and Point2Homes’ blog pages. She also has 5 years of experience as a marketing copywriter.
Recent Reports

World Cup or Your Mortgage/Rent? Ticket Prices Rival Host City Housing Costs
World Cup ticket prices rival monthly housing expenses in the 11 U.S. host cities, with even the cheapest seats covering weeks or even months of rent or mortgage payments.

Locked-In Owners, Mobile Renters: Homeowners Stay Put as Renters Move 3.7x More Across Largest U.S. Cities
Renters became the primary drivers of long-distance mobility across the largest U.S. cities, moving 3.7 times more than owners in 2024, as high mortgage rates and housing costs kept many homeowners in place.

$4.6M Hudson Yards Maintains Top Spot, Luxury Sales in Malba Set $2.5M Price Record for Queens
Despite prices declining, Hudson Yards remained the most expensive NYC neighborhood, but TriBeCa’s growth closed the gap to under $400,000, while Malba set a new historic price record for Queens at $2.5 million, securing the highest ranking ever for the borough at #5.