

Market Studies | RELEASED ON July 8, 2026
2026 Q2 Foreclosure Report: Bronx Caseload Hits 7-Year High, Brooklyn & Manhattan Slow to 4-Year Low
Eliza Theiss | 9 minute read
Manhattan yet again slowed to become the city's least active foreclosure market, Brooklyn's caseload dropped so low it barely edged out Staten Island, while the Bronx heated up enough to surpass all boroughs except Queens.
Key Takeaways:
- NYC foreclosures decline 5% year-over-year (Y-o-Y), totaling 388 first-time cases in Q2 2026
- Citywide lis pendens rise 27% Y-o-Y to 1,831 filings, fueled by Brooklyn’s increase
- Bronx foreclosure sector heats up to seven-year high to become second-most-active market in city
- Brooklyn foreclosures drop to four-year low, but pre-foreclosures jump 44% Y-o-Y
- Yet again, Manhattan is slowest foreclosure market in NYC with filings down to post-moratorium lows
- Queens maintains lead with 140 first-time filings, Jamaica and Saint Albans concentrate highest number of foreclosures by neighborhood with 18 cases each
- Staten Island stands as the only borough with decreasing pre-foreclosures, contracting 19% Y-o-Y
- Single family homes drive city’s foreclosure sector with 36% of cases
- NYC’s foreclosure hotspot moves to zip 10469 in northeastern Bronx with 16 cases
NYC Overview
Behind 5% Citywide Decrease, the Five Boroughs Chart Disparate Paths
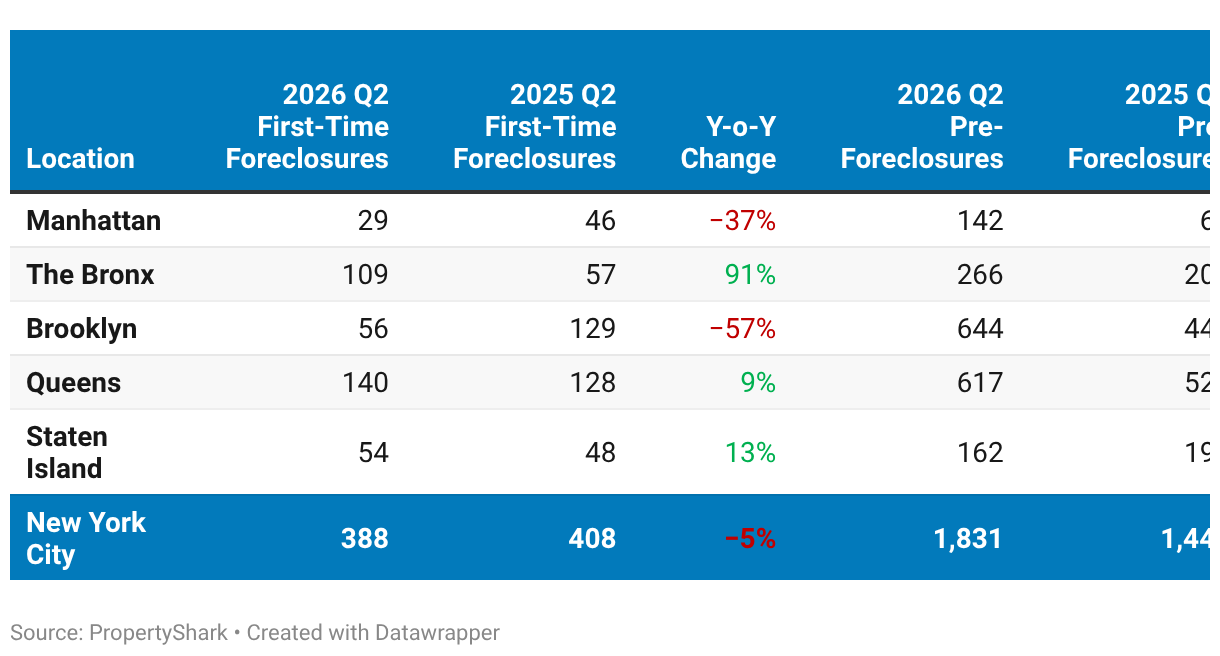
The New York City foreclosure market closed the second quarter of the year with 388 first-time filings for a 5% Y-o-Y downtick. However, the mild changes observed at the city level hide more complex and often opposing trends at the borough level. In fact, the city’s foreclosure sector is once again behaving less like one homogenous industry and more like five separate markets shaped by differing forces and trends.
This time, the Bronx was the standout foreclosure market after closing Q2 with 109 first-time filings to mark the borough’s most active quarter in seven years. This came as cases nearly doubled year-over-year, fueled by the rapid acceleration of mortgage foreclosures throughout the last year.
What’s more, this sharp increase made the Bronx the city’s second-most-active foreclosure market. It was surpassed only by Queens, which logged 140 first-time cases after a 9% Y-o-Y increase. Cases also rose on Staten Island, but its 54 first-time filings remained just under its record-setting Q1 figures.

By contrast, foreclosures decreased in Manhattan and Brooklyn. Specifically, Manhattan cases fell by more than one-third to just 29 first-time filings to make Manhattan the slowest foreclosure market in the city yet again. Meanwhile, Brooklyn’s caseload was more than halved to 56 unique filings, marking the slowest quarter for the borough in four years.
That said, Brooklyn’s slowdown may be temporary as lis pendens rose sharply to 644 filings to make it the city’s pre-foreclosure leader, surpassing even Queens’ 617 cases. At the same time, pre-foreclosure activity was far lower in the other three boroughs with Staten Island filings even decreasing by nearly one-fifth.
Notably, pre-foreclosures were on the rise in the Bronx, hinting at potential further increases in new foreclosures in the borough, while Manhattan remained the slowest pre-foreclosure market in the city, despite cases more than doubling. Overall, the city totaled 1,831 lis pendens for a 27% Y-o-Y increase in NYC pre-foreclosures.

NYC Asset Types
Single Family Leads, but Co-op Filings Rise to 25% of NYC’s Total
Single family homes remained the dominant asset type for citywide foreclosures between April and June, continuing the property mix trend of the first three months of the year. However, the mix was more balanced in the second quarter with single family foreclosures accounting for 36% of new filings and two-family homes for 30%.

Yet, even as the combination of single and two-family house foreclosures grew more balanced, co-op and condo foreclosures drifted further apart. More precisely, the number of condo foreclosures dropped by one-third compared to the same period last year to account for less than one in 10 new cases.
For comparison, co-op foreclosures rose 10% to represent one-quarter of all NYC foreclosures in Q2, totaling 97 first-time filings. That increase originated from the uptick in co-op foreclosures in the Bronx.
Manhattan
Manhattan Back to City’s Slowest Foreclosure Market
Following a 37% Y-o-Y drop, Manhattan closed the second quarter of the year with 29 first-time filings, accounting for just 7% of NYC’s caseload. This returned Manhattan to the title of the city’s least-active foreclosure market — a position it held for two years after the lifting of the pandemic foreclosure moratorium.

Seemingly by contrast, Manhattan pre-foreclosures more than doubled after surging 115% Y-o-Y. Even so, its 142 lis pendens were still the lowest figure boroughwide, suggesting that Manhattan foreclosures may remain scarce, at least in the near future.
The borough’s muted foreclosure activity was also evidenced by its clusters: Lenox Hill overall totaled just seven first-time filings, but was nevertheless the borough’s leading neighborhood for foreclosures. Of these, five were concentrated in zip 10065.
Manhattan’s muted foreclosure activity was also demonstrated by the fact that none of the city’s priciest foreclosure sales in Q2 were Manhattan assets. Looking ahead, though, that may change. In Q3, the two most expensive foreclosures by lien amount headed to auction are Manhattan properties. One is a 2,633-square-foot condo at 432 Park Ave. originally purchased for $21.16 million back in 2016. It’s set to hit the block with a $12.19 million lien. The other is set to hit the block the same day with a $4.89 million lien tied to two merged co-op units at 40 E. 80th St.
Top 5 Upcoming NYC Residential Auctions By Lien Amount: Q3 2026
| Top 5 Upcoming Residential Foreclosures by Lien: Q3 2026 | |||||
|---|---|---|---|---|---|
| Rank | Borough | Address | Lien Amount | Auction Date | Occurrence |
| 1 | Manhattan | 432 Park Avenue #81A | $12,187,850 | 7/21/2026 | rescheduled |
| 2 | Manhattan | 40 East 80th Street #17B-18B | $4,893,895 | 7/21/2026 | rescheduled |
| 3 | Queens | 67-31 47th Avenue | $1,703,413 | 7/24/2026 | first-time |
| 4 | Brooklyn | 3402 Avenue K | $1,531,800 | 7/23/2026 | rescheduled |
| 5 | Brooklyn | 85-30 67th Road | $1,401,209 | 7/24/2026 | first-time |
Brooklyn
Brooklyn Hits 4-Year Low After Caseload Gets Halved
Following an unusually slow first quarter, the Brooklyn foreclosure market decreased an additional 10% quarter-over-quarter, totaling a mere 56 first-time filings between April and June. That also represented a 57% Y-o-Y decrease, which brought the borough down to the depressed activity last seen four years ago in the immediate aftermath of the end of the foreclosure moratorium.

The Bronx had nearly twice as many first-time filings in Q2, and even Staten Island totaled only two fewer cases than Brooklyn. However, the borough’s slowdown may be merely temporary glitch: Brooklyn pre-foreclosures rose 44% Y-o-Y to total 644 filings and surpass Queens’ lis pendens volume.
It’s worth noting here that Brooklyn’s uncharacteristic foreclosure performance was further reinforced by its foreclosure hotspot, zip 11201, which supplied nine first-time cases from the area covering parts od Vinegar Hill, DUMBO, Brooklyn Heights, Downtown Brooklyn, Boerum Hill and Cobble Hill. Of these nine cases, eight originated in just one Boerum Hill building, all of which are tied to common charge liens.
By comparison, in the last two years, Brooklyn foreclosures tended to cluster in zip 11236 in the Canarsie and East Flatbush area, whereas zip 11220 in the Sunset Park and Bay Ridge area led in 2023.
Queens
Queens Remains City’s Lead Foreclosure Market
Like almost always, the Queens foreclosure market was the city’s most active with 140 first-time filings, 9% more than during the same period last year. At the same time, pre-foreclosures in Queens rose 17% Y-o-Y to total 617 lis pendens filings.

In terms of foreclosure clusters, the borough’s southeastern area near JFK saw the most activity, as has often been the case in recent years. Specifically, zip 11412 in Saint Albans had the borough’s highest concentration of first-time filings with 15 unique cases. Meanwhile, the entirety of Saint Albans logged 18 foreclosures, tied with Jamaica’s 18 cases. These two areas claimed the city’s highest neighborhood-level concentration of foreclosures, although the Bronx led in terms of zip code clusters.
Jamaica was also the setting for one of the most expensive foreclosures of the previous quarter: 150-15 123rd Ave. hit the auction block in early June with a $963,000 lien before the 1,593-square-foot, two-family frame home reverted to the lender. But this wasn’t the borough’s priciest foreclosure to hit the block in Q2. Rather, it was a 1,750-square-foot two-family home in Rochdale, which went to auction with a $976,000 lien. It, too, reverted to the lender.
Top 5 NYC Residential Auctions by Lien Amount: Q2 2026
| Top 5 Residential Foreclosures by Lien: Q2 2026 | |||||
|---|---|---|---|---|---|
| Rank | Borough | Address | Lien Amount | Auction Date | REO |
| 1 | Brooklyn | 91 Stanhope Street | $1,223,925 | 7-May-26 | Yes |
| 2 | Brooklyn | 1719 East 51st Street | $1,139,863 | 2-Apr-26 | Yes |
| 3 | Queens | 182-16 144th Avenue | $976,275 | 10-Apr-26 | Yes |
| 4 | Queens | 150-15 123rd Avenue | $962,522 | 22-May-26 | Yes |
| 5 | The Bronx | 2331 Yates Avenue | $880,954 | 11-May-26 | Yes |
The Bronx
Bronx Foreclosures Nearly Double, Hit 7-Year High
Coming hot on the heels of the borough’s most active post-pandemic quarter, the second quarter of this year was another record-setting one for the Bronx, which totaled 109 first-time foreclosures — the highest number in more than seven years. Not only that, but it also made the Bronx foreclosure market the second-most active in the city, surpassed by Queens alone.
Additionally, this dynamic of Queens leading and the Bronx following as the runner-up has not been seen in nearly 10 years, when it was more typical during the city’s 2016 and 2017 foreclosure markets.

This positioning is even more notable considering the size and ownership gap between the two boroughs: the Bronx has around 583,000 housing units and a 20% homeownership rate, whereas Queens has some 935,000 housing units and a 45% ownership rate, per the New York State Comptroller.
The Bronx’s latest foreclosure performance was the result of a 91% Y-o-Y increase in first-time filings that were overwhelmingly driven by single family mortgage foreclosures in the borough. Namely, foreclosures of Bronx single family homes rose sharply during the last year, going from just 32 cases in Q3 2025 to 57 in the first three months of this year and 79 first-time filings in the second quarter.

Co-ops made up an additional 18 cases in Q2, contributing to NYC’s 10% Y-o-Y increase in co-op foreclosures. Granted, seven of these were common charge foreclosures clustered at 800 Grand Concourse — the only building in the borough to supply more than two foreclosures in the second quarter.
Otherwise, cases were peppered throughout the borough with a dense, 16-foreclosure concentration in zip 10469, which covers parts of Allerton, Baychester, Laconia, Pelham Gardens and Williamsbridge. Zip 10469 also supplied the borough’s priciest foreclosure auction in Q2: 2331 Yates Ave. in the zip’s Allerton area hit the block in late May with an $881,000 lien. Many of the zip’s cases were supplied by Williamsbridge, which tied with Throggs Neck as the borough’s most active neighborhoods for foreclosures, each originating 10 first-time filings.
Likewise, Bronx pre-foreclosures were also on the rise, although nowhere near the scale of foreclosure increases. Specifically, pre-foreclosure filings in the borough rose 29% Y-o-Y to total 266 lis pendens.
Staten Island
Staten Island Foreclosure Market Heats Up to 14-Quarter High
The Staten Island foreclosure market finished the second quarter with 54 first-time filings. While that represented a 13% Y-o-Y increase, it was still below the borough’s 14-quarter high from the start of the year. Still, the first two quarters of 2026 had almost as many foreclosures as the entirety of the previous year: 112 filings versus 139.

Although the start of the year saw Staten Island’s 11314 Mid-Island zip tie with two Queens locations as the city’s foreclosure hotspots with 12 cases each, Q2 was more muted. Specifically, zip 11312 led the borough, clustering nine new foreclosures in the Arden Heights, Annadale, Woodrow, Huguenot and Eltingville areas. However, Great Kills was the borough’s most active neighborhood for foreclosures with five first-time filings.
Finally, in terms of lis pendens, Staten Island pre-foreclosures went against the grain after contracting 19% Y-o-Y to 162 filings. Only Manhattan logged fewer pre-foreclosure filings. Notably, Staten Island was the only NYC borough to see lis pendens trend down in Q2.
Data Snapshot: All Boroughs
Q2 2026 NYC Foreclosures & Pre-Foreclosures by Borough
Methodology
Having tracked foreclosure listings for more than a decade, PropertyShark is the only service in New York that guarantees 100% coverage of the local foreclosure market. Because auctions are frequently postponed and/or rescheduled, the statistics referenced in this report include only first-time foreclosures in order to avoid over-reporting the number of distressed properties in the city.
Separately, we also report on lis pendens (pre-foreclosure) filings — legal notices that mark the beginning of the foreclosure process.
Pre-foreclosure data refers to unique properties that had at least one lis pendens filing in Q2 2026, which may be a first-time filing or a refiling. The same building class restrictions apply, excluding co-ops. If more than three units were referenced on the same lis pendens filing, they were excluded in order to avoid accounting for entire buildings.
This report focuses exclusively on residential properties (single and two-family homes; condos; and co-op units) that were scheduled for auction for the first time in Q2 2026.
FAQs
1. Are foreclosure filings increasing in NYC?
No, in Q2 2026, NYC totaled 388 first-time foreclosure filings, down 5% year-over-year.
2. Which borough had the most foreclosures?
Queens was the most active foreclosure market with 140 first-time filings in Q2 2026, marking a 9% increase compared to Q2 2025.
3. Which borough had the fewest foreclosures?
Manhattan the slowest foreclosure market with 29 first-time filings for a 37% decrease compared to Q2 2025.
Fair Use & Redistribution
We encourage and freely grant permission to reuse and repost information, analysis, charts, tables, and images included on this page. When doing so, we only ask that you link back to this page or PropertyShark.com as the official source.
About PropertyShark
PropertyShark is an online real estate database and property research tool that provides building details, ownership information, comparable sales, and foreclosure data. Founded in 2003, PropertyShark serves real estate professionals and consumers in New York and other major U.S. markets.
Want to stay on top of the real estate market?
Access comprehensive property data and ownership information with intuitive research tools.

POSTED IN: Market Studies, New York Foreclosures

Eliza Theiss is a senior writer reporting real estate trends in the US. Her work has been cited by CBS News, Curbed, The Los Angeles Times, and Forbes among others. With an academic background in journalism, Eliza has been covering real estate since 2012. Before joining PropertyShark, Eliza was an associate editor at Multi-Housing News and Commercial Property Executive. She has also contributed extensively to CommercialEdge. Reach her at [email protected]
Recent Reports
NYC Homeownership by the Numbers: How Household Type, Gender & Age Shape Who Owns in Every Neighborhood
In a city where homeownership is dominated by married-couple families, Manhattan stands as the only borough led by nonfamily owners. At the same time, residents younger than 35 make up less than one tenth of the ownership pool and female-led family households outnumber male-led families across 91% of NYC neighborhoods.

Prices Rise in 32 of NYC’s Leading Neighborhoods as City and Manhattan Hit Record Highs
Q2 2026 saw NYC and Manhattan reach historic highs, with Brooklyn and Queens marking close to new records as well. Meanwhile, Hudson Yards remained at the top, Central Midtown posted its highest price ever and Carroll Gardens marked its third consecutive quarter over $2 million
NYC Resale Gains & Losses: Every Borough Made Money in 2025, Except Manhattan
In 2025, NYC home-sellers mostly made money. But, in Manhattan, resales came with losses — and it was apartments and recent buyers that absorbed them.