
Metro New York Foreclosure Report
New Foreclosures in NYC Up a Striking 79% in Q3 2017
RELEASED ON October 5, 2017 | 5 minute read
Key highlights – Q3 2017 NYC Foreclosure Report NYC foreclosures up 79% year-over-year and down 6% compared to Q2 2017 All 5 boroughs saw new cases going up year-over-year New foreclosure cases in the Bronx increased a staggering 145% year-over-year After a peak in new cases in Q2 2017, new foreclosures in Brooklyn were down 22% quarter-over-quarter, but up 118% year-over-year New foreclosures in NYC hiked 79% year-over-year in Q3 2017 The number of first-time foreclosures in NYC surged 79% year-over-year in Q3 2017 – 859 homes were scheduled, compared to 481 in Q3 2016. After a peak in foreclosure activity in Q2 2017, with 911 new foreclosures scheduled across all 5 boroughs, Q3 2017 brought a slight slowdown in the number of cases. This translates into a 6% decrease quarter-over-quarter, following a trend we’ve noticed when tracking foreclosure data as Q3 is usually slower than Q2. By property type, single- and two-family homes have seen the highest increases in Q3 2017. All 5 boroughs registered increases in the number of homes scheduled for auction, though Staten Island, the Bronx, and Brooklyn saw numbers skyrocket compared to Q3 2016. Manhattan saw little fluctuation and, rather unusually, foreclosures only moderately increased…
Key highlights – Q3 2017 NYC Foreclosure Report
- NYC foreclosures up 79% year-over-year and down 6% compared to Q2 2017
- All 5 boroughs saw new cases going up year-over-year
- New foreclosure cases in the Bronx increased a staggering 145% year-over-year
- After a peak in new cases in Q2 2017, new foreclosures in Brooklyn were down 22% quarter-over-quarter, but up 118% year-over-year
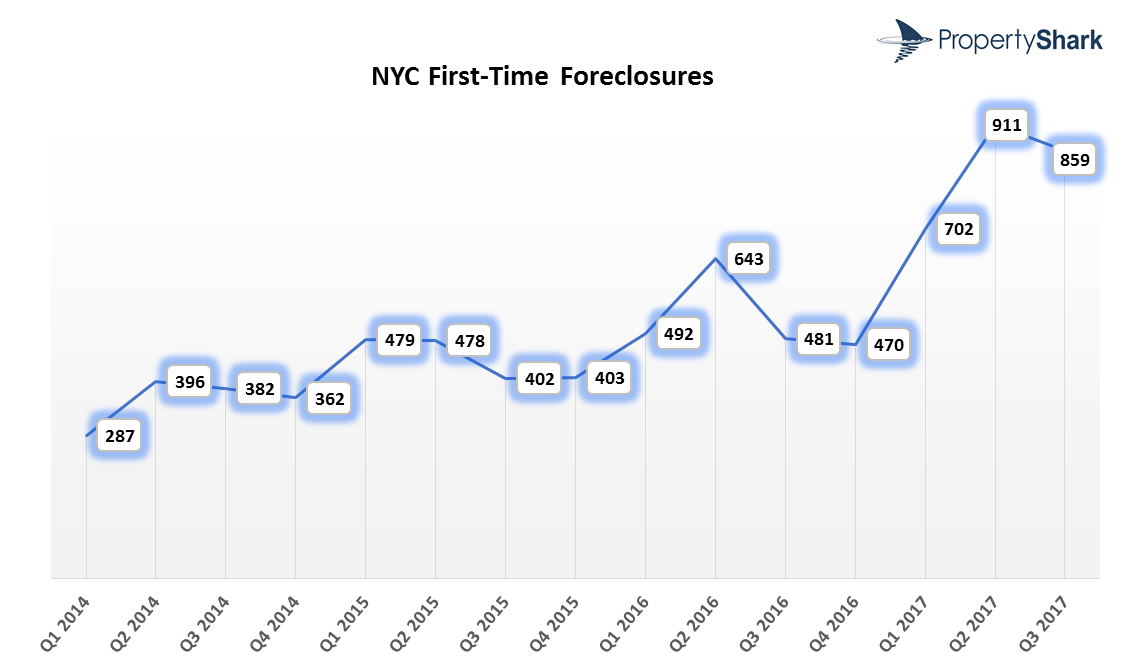
New foreclosures in NYC hiked 79% year-over-year in Q3 2017
The number of first-time foreclosures in NYC surged 79% year-over-year in Q3 2017 – 859 homes were scheduled, compared to 481 in Q3 2016. After a peak in foreclosure activity in Q2 2017, with 911 new foreclosures scheduled across all 5 boroughs, Q3 2017 brought a slight slowdown in the number of cases. This translates into a 6% decrease quarter-over-quarter, following a trend we’ve noticed when tracking foreclosure data as Q3 is usually slower than Q2. By property type, single- and two-family homes have seen the highest increases in Q3 2017.
All 5 boroughs registered increases in the number of homes scheduled for auction, though Staten Island, the Bronx, and Brooklyn saw numbers skyrocket compared to Q3 2016. Manhattan saw little fluctuation and, rather unusually, foreclosures only moderately increased in Queens – a 27% uptick year-over-year.
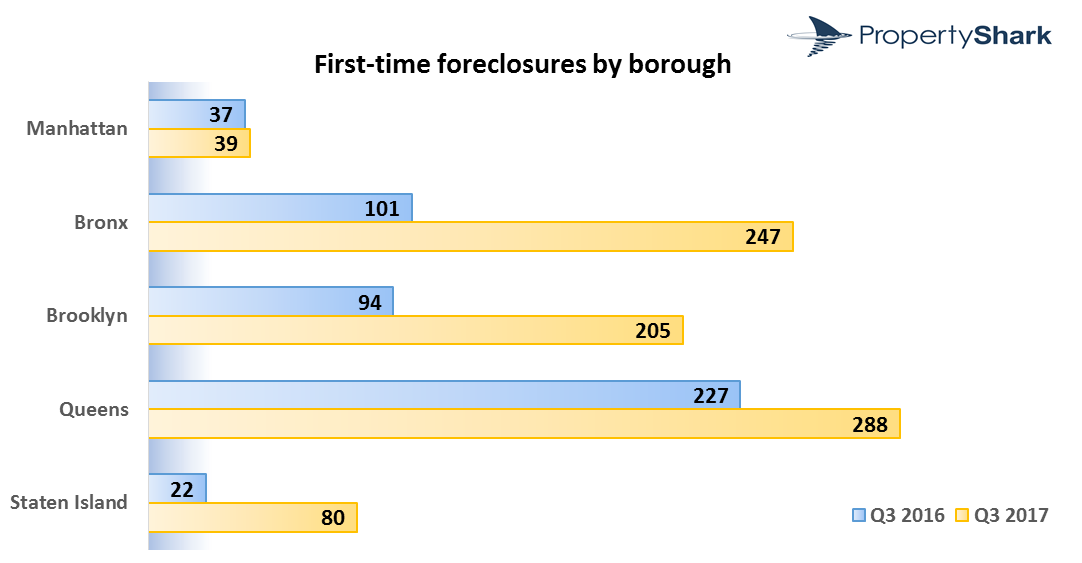
Stats by borough reveal that, when looking at absolute numbers, Brooklyn and the Bronx are the major sources behind the increase in new foreclosures.
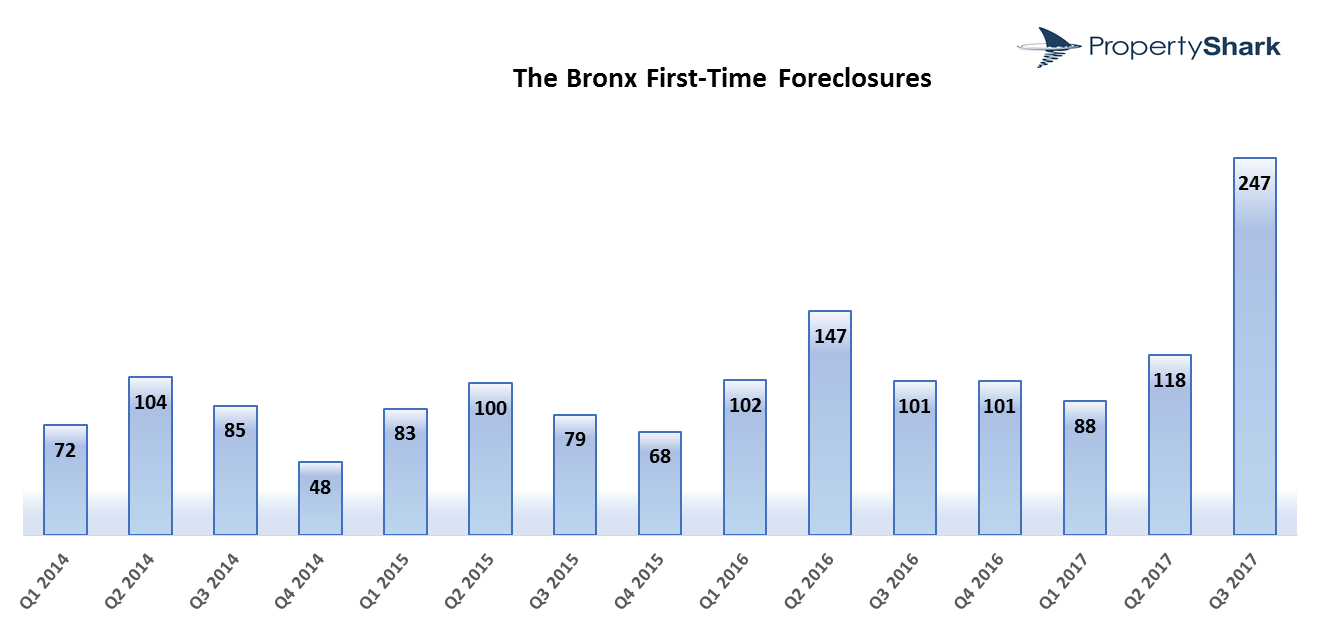
Foreclosed homes in the Bronx reached record levels in Q3, up a striking 145% year-over-year
A record-high number of homes were scheduled for auction in Q3 2017, representing a 145% increase compared to Q3 2016. The number of cases in the Bronx kept relatively at the same levels for the past quarters with a spike in Q2 2016 but otherwise hovering around 100 homes per quarter or even lower than that. Back in the second quarter, the Bronx was the only borough that recorded a year-over-year decrease in foreclosure activity. The situation changed drastically in Q3 2017 when 247 homes were scheduled for the first time.
Zip code 10469 had the highest number of new foreclosures: 32 homes were scheduled here in Q3 2017. Not far behind, zip codes 10462, 10473, 10466, and 10465 all had close to 30 new cases each, showing a concentration of foreclosure activity in the eastern half of the borough. The graph below captures the evolution in the number of cases and the spike recorded this previous quarter.
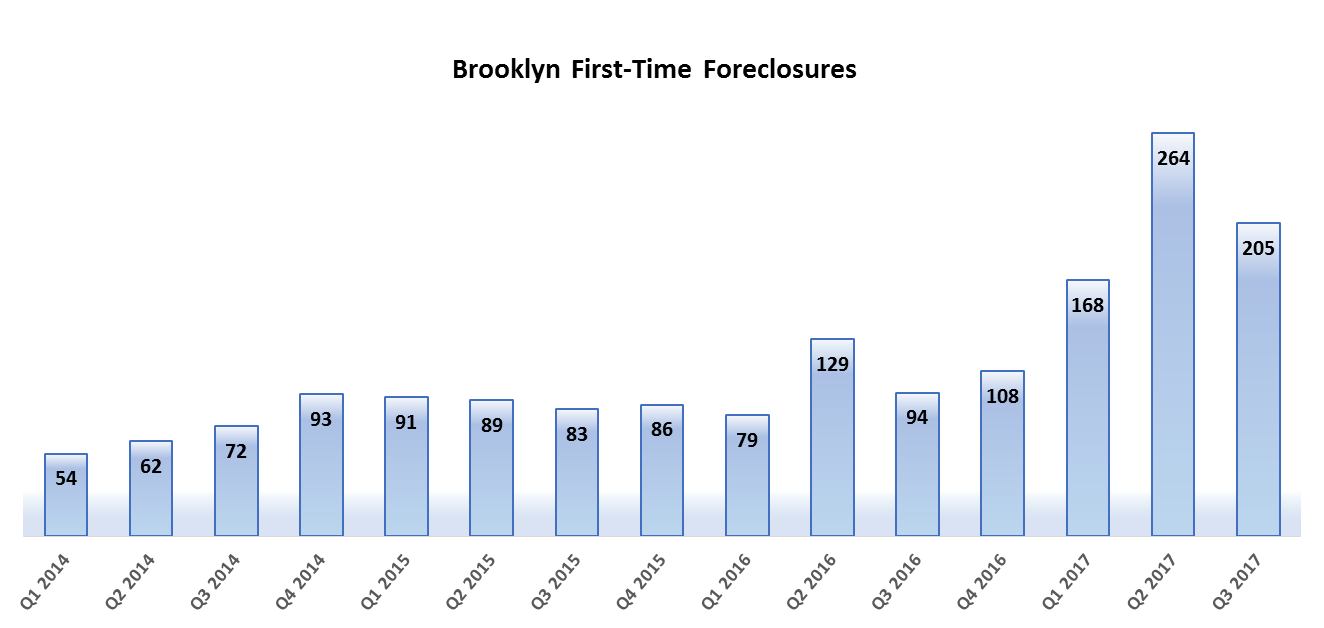
Brooklyn foreclosures up 118% year-over-year, and down 22% compared to Q2 2017
While compared to the previous quarter’s count of 264 homes scheduled for auction, Q3 2017 seems to have brought some respite for Brooklyn, the number of homes headed for auction is still high. Q3 2017 brought a 118% year-over-year jump, given that 205 homes were headed for the auction block. When looking at Q3 2016, only 94 new foreclosures were recorded in the borough.
Zip code 11236, covering Canarsie, had the most cases filed – 31 homeowners here saw their homes scheduled to be auctioned in Q3 2017. East NY, Canarsie, and the Flatlands are usually the scene for the highest number of cases in Brooklyn, but this time we noticed increases in Southern Brooklyn zip codes as well. For example, in 11229 there were only 4 first-time foreclosures in Q3 2016, compared to 15 in Q3 2017. Bed-Stuy’s 11233 also recorded a jump in cases from 2 in Q3 2016 to 10 in Q3 2017.
The first three quarters of 2017 were particularly harsh for Brooklyn homeowners, especially compared to the numbers we tracked over the past years. While in 2016 there were a total of 410 homes scheduled for auction in the borough, with only 3 quarters elapsed from 2017, there have already been 637 new foreclosures. Check out the graph below for a detailed, by-quarter evolution of first-time foreclosures in Brooklyn.
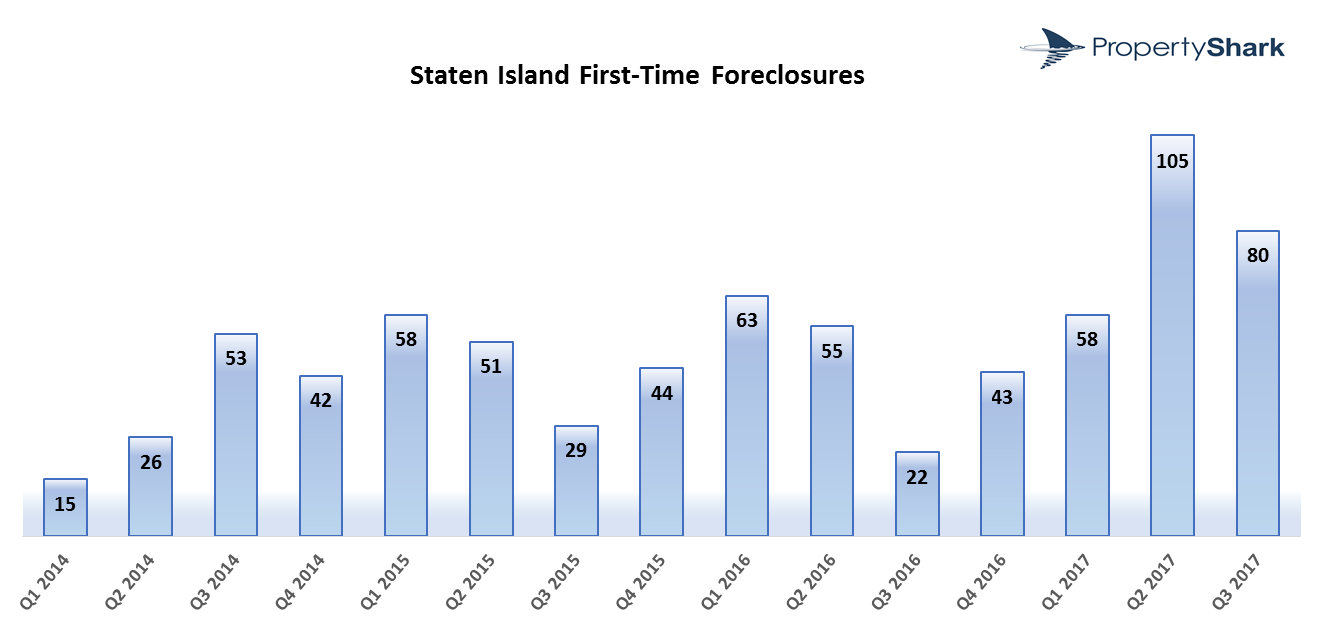
In Staten Island, new foreclosure cases surged 246% year-over-year, down 24% quarter-over-quarter
Historically, Staten Island had low numbers of homes heading for the auction block, but the second quarter of 2017 brought a record-high number: 105 first-time foreclosures were scheduled. In Q3 2017, the number went down 24% quarter-over-quarter, but it was up 246% year-over-year. That’s also due to the fact that Q3 2016 only had 22 cases, which was low even for what we’re used to seeing each quarter in Staten Island.
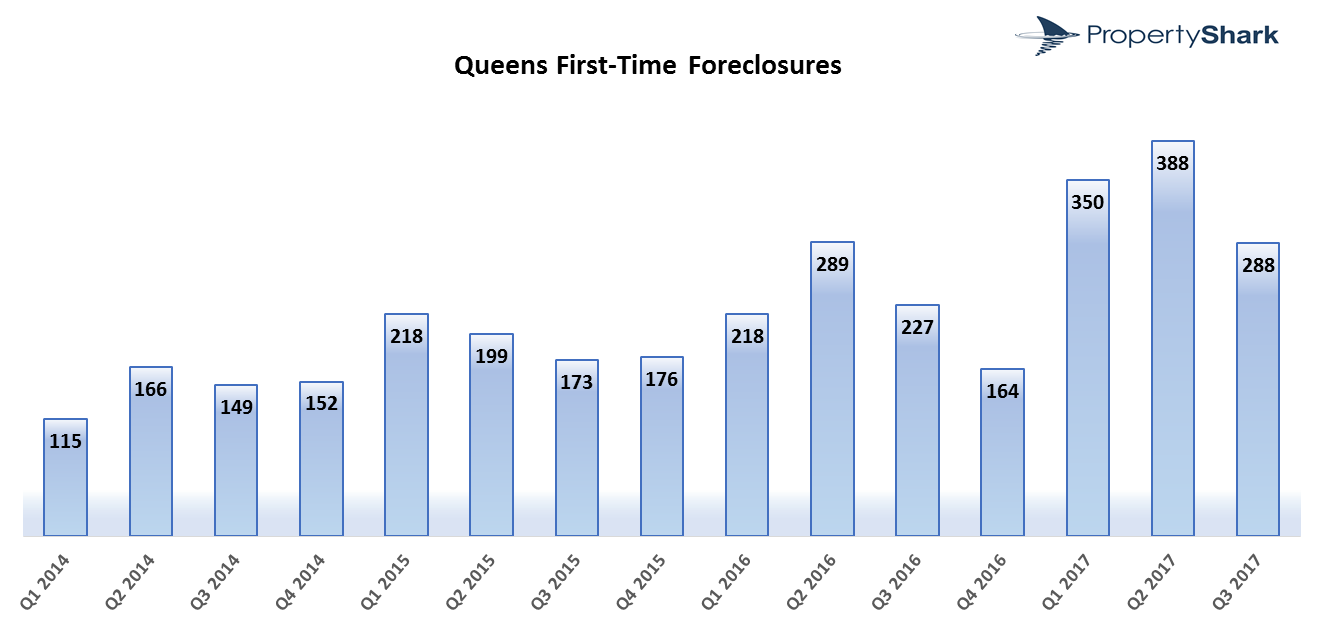
Queens saw a moderate year-over-year increase in new foreclosures
Back in Q3 2016, Queens accounted for almost half of new foreclosure cases in NYC, as 227 of the 481 new foreclosures in the city were recorded in Queens . The first two quarters of 2017 brought a high number of cases with a peak in Q2. In the third quarter of 2017, however, foreclosures in Queens dropped 26% quarter-over-quarter and settled in at 288 cases.
Though still up 27% compared to Q3 2016, Queens is now far from having around half of all NYC cases, mainly as a result of the increases recorded in Brooklyn and the Bronx. In Q3 2017, the number of new foreclosures in each of the two boroughs was close to reaching the one recorded in Queens.
Queens also used to be home to the top zip code by number of foreclosures – Jamaica’s 11434 consistently had a high number of cases each quarter. This time, there were 29 first-time foreclosures in 11434, fewer than the numbers recorded in the top zip codes for both Brooklyn and the Bronx.
Manhattan continues mostly unaffected by foreclosure activity
Q3 2017 did not bring any changes when it comes to foreclosure cases in Manhattan; the borough still has a low number of cases and almost no fluctuation. While foreclosures are still a rare sight here as 39 homes were scheduled, Manhattan did make the news several times this summer due to big ticket auctions scheduled for two separate units at the luxurious One57.
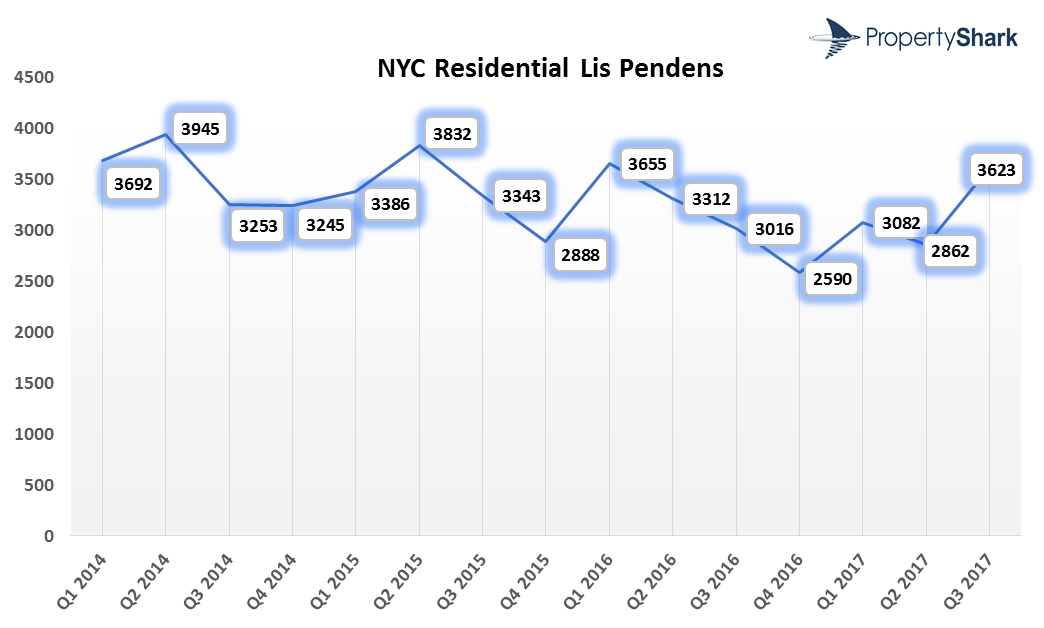
Lis pendens cases in NYC went up 20% year-over-year
The number of NYC homes that received a pre-foreclosures notice in Q3 2017 was up 20% year-over-year. 3,623 homes had a lis pendens filed this previous quarter compared to 3,016 in Q3 2016. Manhattan saw the biggest year-over-year increase at 30%, as 134 homes entered pre-foreclosure. Brooklyn and Staten Island followed, both with 27% year-over-year increases in Q3 2017.
Check out our Q2 2017 Foreclosure report here
Methodology
Our report focuses on residential properties that are scheduled for auction for the first time. Auction postponements are fairly common and by removing them from our analysis we avoided over-reporting the number of properties affected by foreclosure. Residential properties included are single- and two-family homes, and condo and co-op units.
Pre-foreclosure data refers to unique properties that received at least one lis pendens filing in Q3 2017. This may be a first-time filing or a re-filing. The same building class restrictions apply (excluding co-ops). If more than 3 units were referenced on the same lis pendens filing they were not counted at all in order to avoid counting entire buildings under lis pendens.
Access Every New York Foreclosure — First.
Get full access to NYC foreclosures, pre-foreclosures, REOs & auctions. Updated daily with lien & owner data. 100% coverage.
POSTED IN: Market Studies, New York Foreclosures

With 10+ years of experience at PropertyShark, Andra covers the latest product updates and market reports for our blog. Her work has been featured in The Real Deal, Curbed, TimeOut, The Daily Mail, Business Insider, Crain’s New York.
Recent Reports

Prices Rise in 32 of NYC’s Leading Neighborhoods as City and Manhattan Hit Record Highs
Q2 2026 saw NYC and Manhattan reach historic highs, with Brooklyn and Queens marking close to new records as well. Meanwhile, Hudson Yards remained at the top, Central Midtown posted its highest price ever and Carroll Gardens marked its third consecutive quarter over $2 million

2026 Q2 Foreclosure Report: Bronx Caseload Hits 7-Year High, Brooklyn & Manhattan Slow to 4-Year Low
Manhattan yet again slowed to become the city’s least active foreclosure market, Brooklyn’s caseload dropped so low it barely edged out Staten Island, while the Bronx heated up enough to surpass all boroughs except Queens.

NYC Resale Gains & Losses: Every Borough Made Money in 2025, Except Manhattan
In 2025, NYC home-sellers mostly made money. But, in Manhattan, resales came with losses — and it was apartments and recent buyers that absorbed them.