
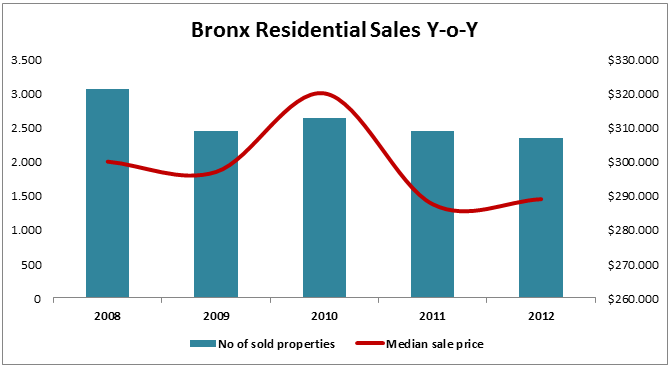
Home Sales in the Bronx Down to a 5-Year Low
Real estate in the Bronx might not be on every home buyer’s tour these days as closed sales in 2012 hit a 5-year low. 2,339 homes in this borough found a new owner last year, a 4% drop compared to both 2011 and 2009 and a larger drop compared to 2008 and 2010. The median…
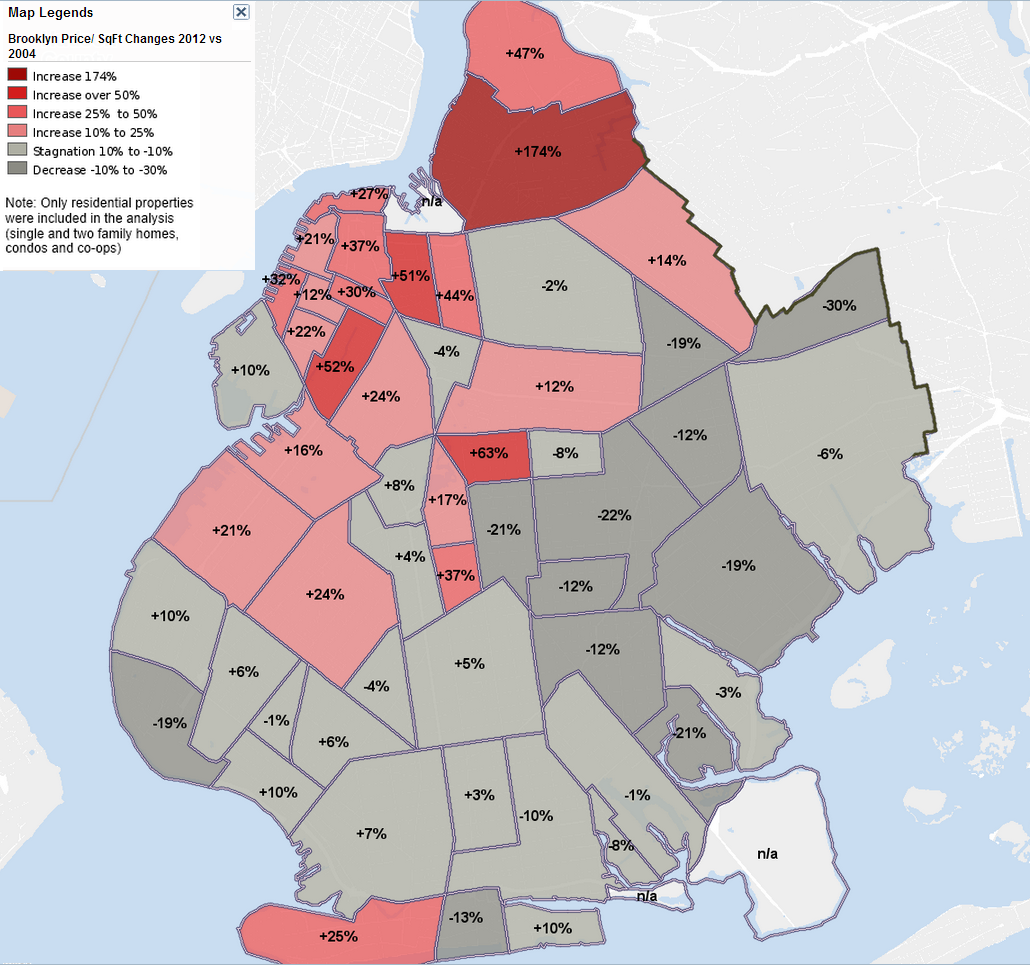
Gentrified Brooklyn Neighborhoods See Home Prices per Square Foot Shooting Up
Several parts of Brooklyn have experienced significant urban redevelopment and demographic change over the past decade. These shifts — often referred to as gentrification — have brought new investment, rising property values, and changes in the housing and cultural landscape. Increasingly, homebuyers from across New York City have turned to Brooklyn for residential opportunities that…
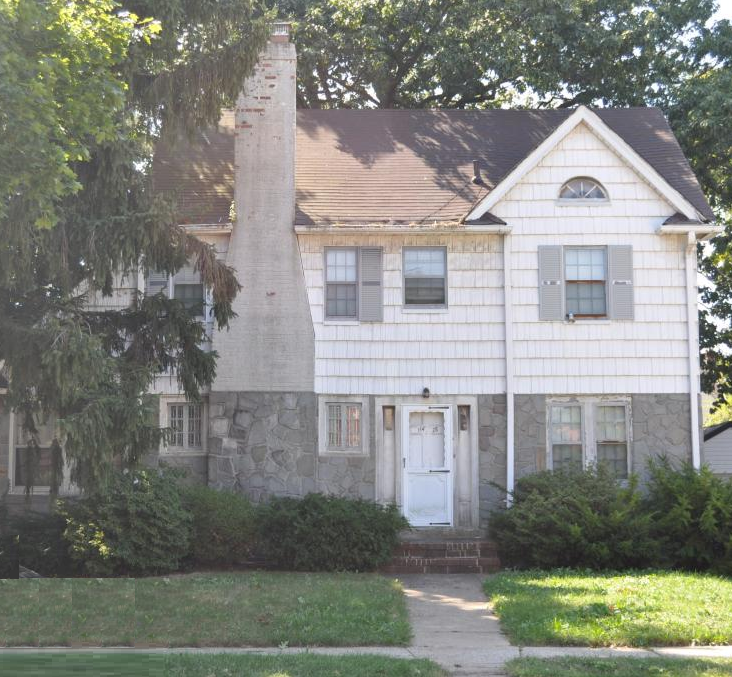
10 homes auctioned by the Public Administrator of Queens County
If you didn’t have time to go and see the properties on December 8th or 9th you can still get a sense of what shape they are in by looking at the property reports on PropertyShark.

Public Records Are NOT Error Free! But There’s a Way Around
Everyone in real estate knows that public records are not error free. Some more than others claim this happens too often. We won’t go into that debate. What’s undeniable, however, is the growing need for ways to validate data found in public records and to quickly determine whether the information provided is true or false….
The Most Expensive Zip Codes in NYC (Hint: It’s not 10065!)
It’s hard to picture almost any US top-10 list without New York City somewhere in there. The most expensive US zip codes list compiled annually by Forbes Magazine makes no exception. In fact, Upper East Side’s 10065 heads their list this year, securing the coveted #1 for the first time. But is 10065 indeed the…
Newcomer in the Top-10 Most Expensive NYC Neighborhoods: Manhattan Beach, Brooklyn
As home sales and median sale prices across NYC have continued to inch up in Q3 2012, Brooklyn is pulling some aces from its sleeve–Manhattan Beach has secured the #4 place in the list of the most expensive NYC neighborhoods PropertyShark completed for this quarter. Median sale prices in Manhattan Beach have spiked at 143%…
Most Expensive Homes in Staten Island (2005-2012)
Staten Island’s luxury home market has some nice figures to show for the 2005-2012 period. Two transactions coming close to $4 million signal that the area, and more specifically the upscale neighborhood Todt Hill, has real estate appeal for the wealthy. In the boom year of 2007, the 7,582 sqft home on 29 High Point…
Queens’ most expensive homes (2005-2012)
News about estates selling at record-breaking prices in New York is almost exclusively linked to Manhattan, and occasionally to Brooklyn. But a blockbuster $5.1 million sale in the upscale neighborhood of Neponsit has recently put Queens on the luxury real estate map of New York. It was hailed as the most expensive home ever sold…

Top Home Lenders in NYC
Who finances your home mortgage loan? If it’s Wells Fargo Bank, learn that you’re with the biggest home lender in NYC, PropertyShark data provided exclusively for Crain’s New York indicates*.

The Kardashians and the Trumps Top PropertyShark’s Searches by Property Owner
Celebrities and the real estate sector usually make quite a hot pair. How hot? It depends if you are on the East Coast or West Coast, and if you prefer Hollywood to the business world. At PropertyShark we were quite curious to see what names most people were running owner searches for, and the results…
Top 10 NYC Home Sales in Q2 2012
What do you think you might find at the high end of NYC’s residential market in Q2 2012? The answer might not be surprising– it’s mostly luxury co-ops in Manhattan, making up half of the top-10 priciest NYC homes sold in spring. What might surprise you instead is to find out that this quarter recorded…
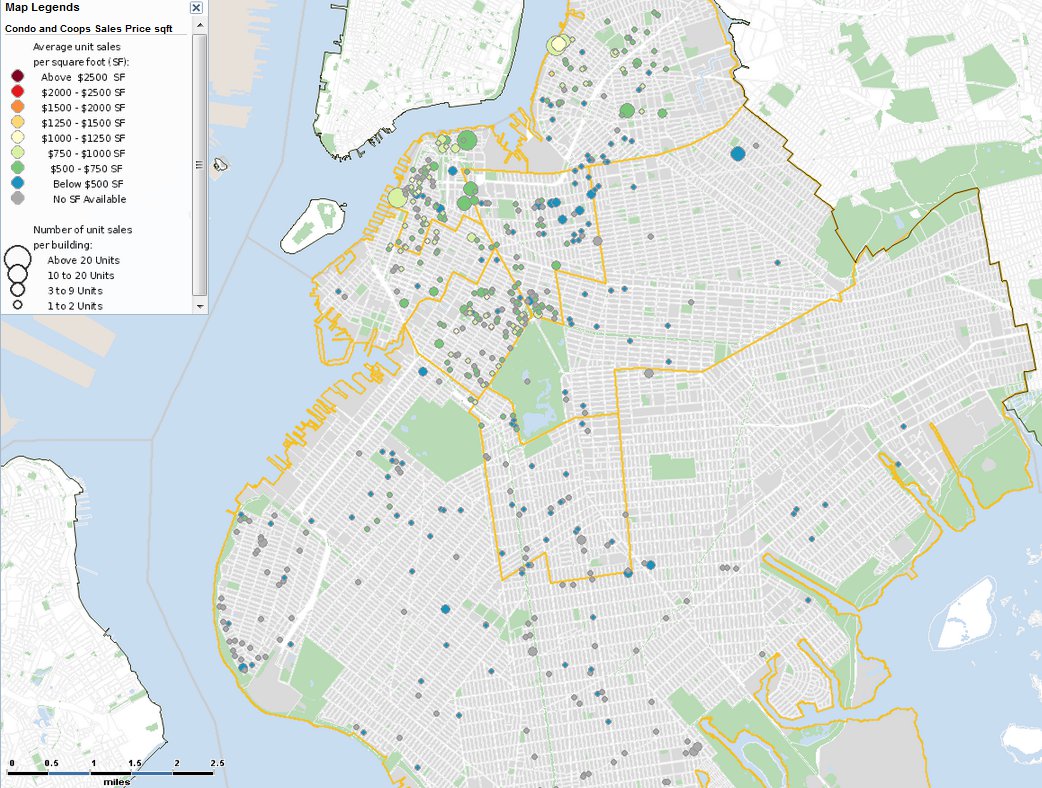
Q2 2012 Brooklyn Apartment Sales Map
The areas with the most intense sales activity this quarter were Park Slope, Brooklyn Heights, and Downtown Brooklyn.
Chart of the Week: NYC Home Sales in Q2 2012
It looks like more New Yorkers found a new home in the second quarter of 2012. A glance at PropertyShark‘s weekly chart shows rising trends in both number of sold properties and median sales price. There were 24% more homes sold in NYC in Q2 2012 compared to Q1 2012, while the median sales price–$485,000–also…
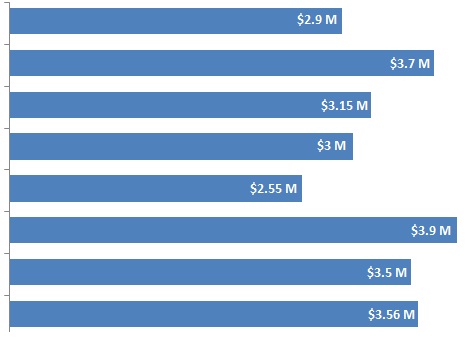
Chart of the week: Brooklyn’s most expensive homes (2005-2012)
If you’re interested in expensive homes featured in slideshows and Brooklyn, PropertyShark’s chart of the week provides you the perfect combination of the two. If last week we crowned this $88M pad as the most expensive home sale in Manhattan, this week we’re looking at how high home sales went in Brooklyn from 2005 to…
Chart of the week: NYC most expensive homes (2005-2012)
How much is not too much for certain New Yorkers when it comes to buying a home? $30M, $40M, $50M? Close…but still far away. At PropertyShark.com we looked at the highest price tags put on residential homes sold each year since 2005, and we’re ready to share the findings with you in our weekly chart….
New Business and Retail Interactive Map for Manhattan. Brooklyn next.
As first reported by The Real Deal, PropertyShark has launched a while back a new business and retail mapping tool covering New York City. Currently, our map covers all Manhattan’s businesses and retail stores and will soon provide those interested with a fast visual grasp of NYC’s entire business landscape. If before, brokers and real…
Chart of the week: Tallest NYC residential towers by borough
NYC renters with “high aspirations” (literally!), we invite you to have a look at our chart of the week, featuring the tallest residential towers in each borough in NYC. Unfortunately, the limit is not really the sky, but somewhere around 870 feet or 76 floors high. In Manhattan, at least. 870 feet is how high…
NYC Homes: Two Centuries of Architecture
As America was celebrating last Friday, June 8th, the 145th would-be birthday of its most famous architect, Frank Lloyd Wright, at PropertyShark we turned our attention toward what represents almost two centuries of home architecture in New York City. A 2012 walk through the city’s most prominent historic districts — Greenwich Village, Brooklyn Heights – still…
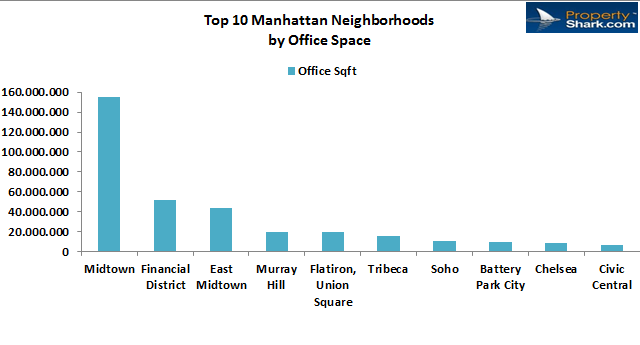
Weekly chart: Top 10 Manhattan neighborhoods by office space
It’s Manhattan, it’s morning, and it’s time to go to the office. In case you were wondering what neighborhoods devote the largest total areas of office space to the working crowd in Manhattan, here is our weekly chart to consider: There’s no doubt about number 1 — Midtown Manhattan, New York’s largest commercial district and…
Central Park views still worth their price
How much more would you pay for having Manhattan’s most prominent patch of grass in your „front yard”? This might still sound out of place to some, but last year home buyers considered it worth paying a median sale price premium of 118% for living in one of the condo or coop units bordering Central…
Want to stay on top of the real estate market?
Access comprehensive property data and ownership information with intuitive research tools.