
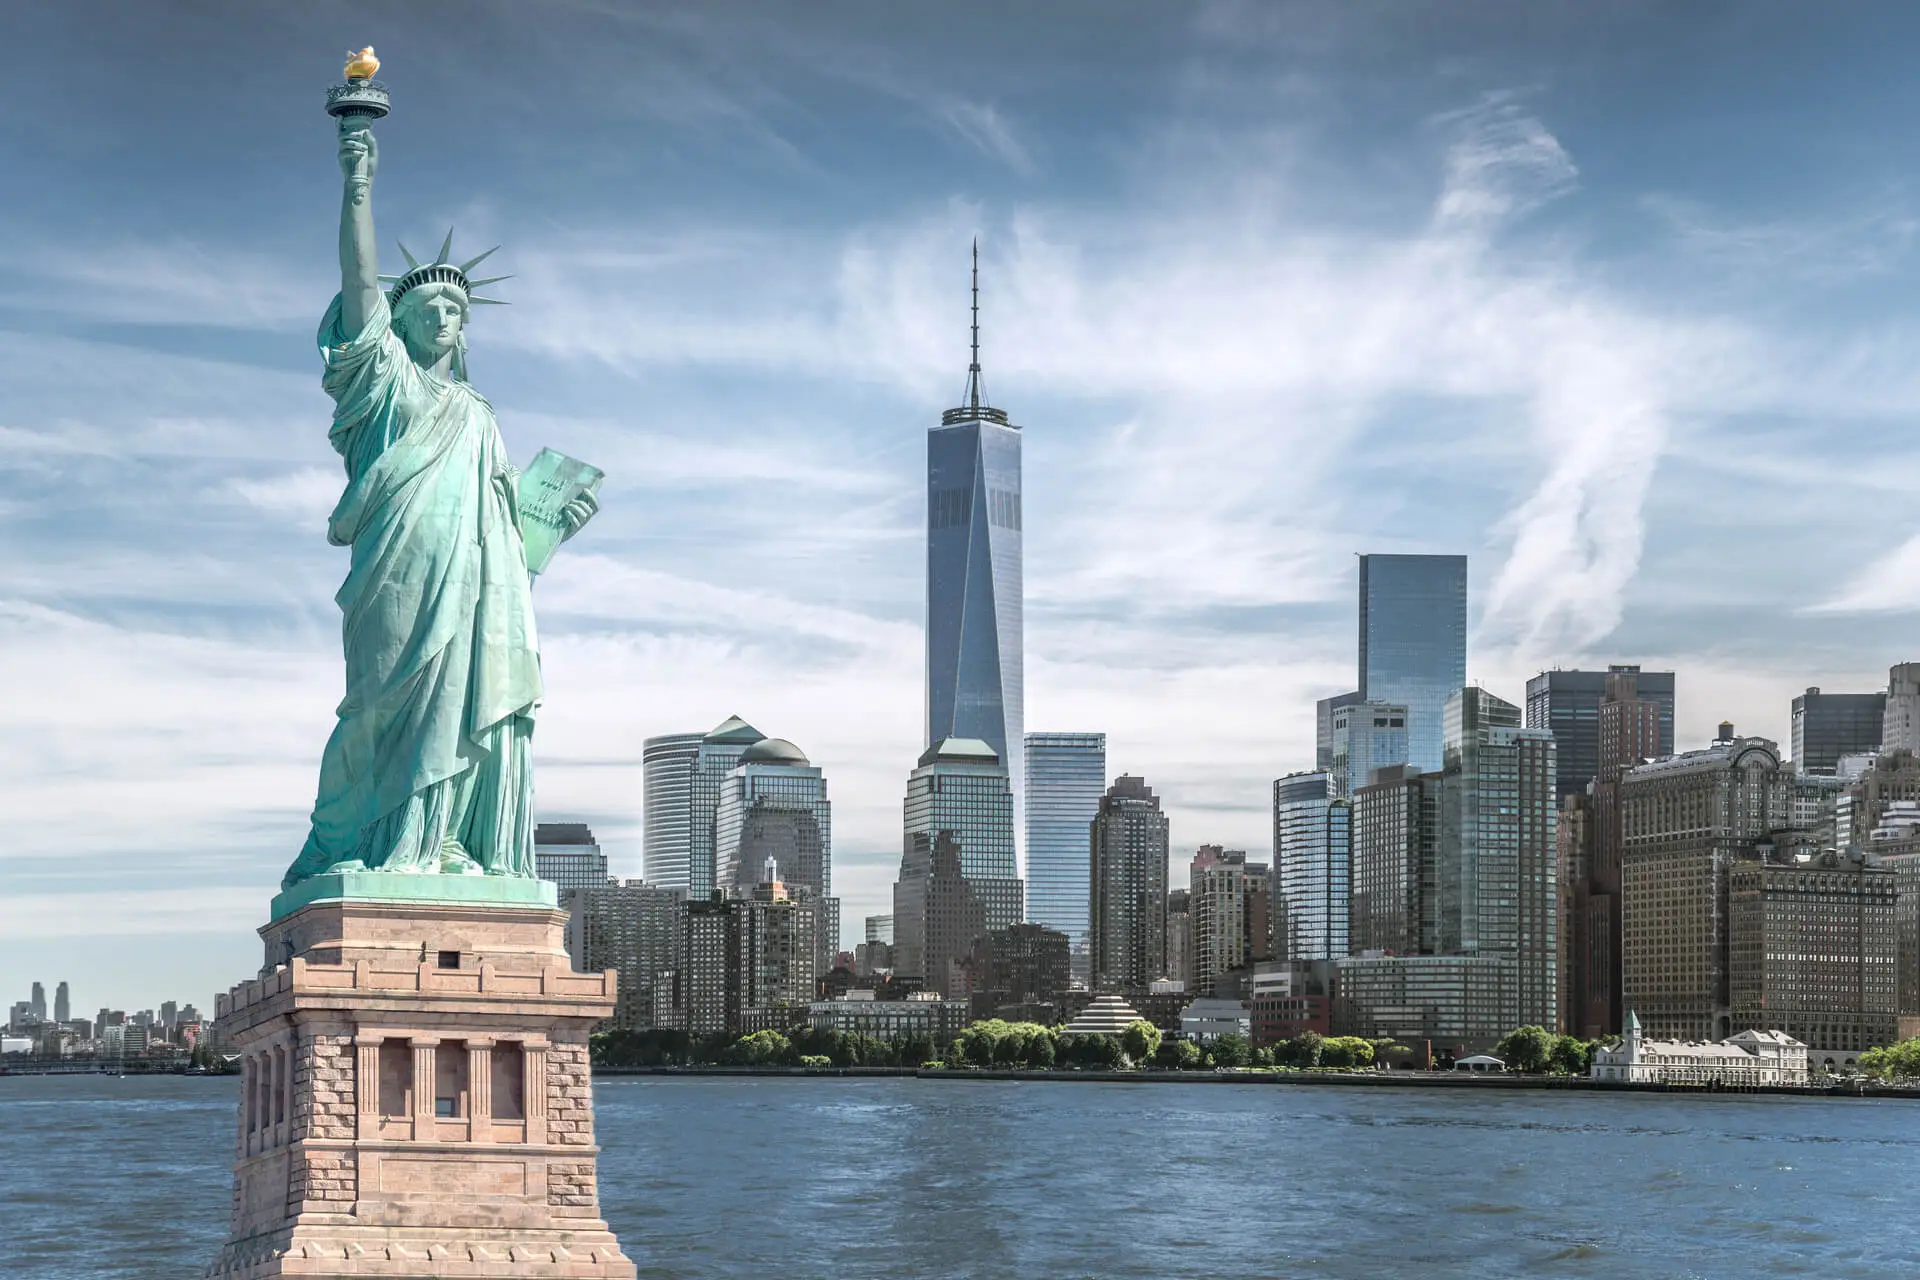
Q1 2020 New York City Neighborhood Real Estate Report
Key Takeaways: First quarter sales activity went up by 5% compared to last year. Hudson Yards remained most expensive neighborhood with a $4.6 million median sale price. Malba was the 7th-priciest neighborhood, with a $2 million median sale price. Manhattan’s most affordable neighborhood was Inwood with a $409,575 median home sale price. The first quarter…
Real Estate Professionals Under Lockdown: Impact & Future Opportunities in NYC
We reached out to NYC-based professionals to see how they’re experiencing the situation on the ground, how they’re adapting and planning for the future, and where they see opportunities emerging.
NYC Multifamily Sales Volume Surges 39% in Q1
The effects of COVID-19 have yet to show up for NYC multifamily in Q1: sales volume leaps 39% Y-o-Y, totals $1.9 billion.
2019 Annual Multifamily Report: NYC Sales Volume Down 41%, Unit Volume Halved
Key Takeaways: Multifamily sales volume dives 41% Y-o-Y across the four boroughs. Manhattan prices accelerate; price per unit up 22% Y-o-Y. Queens loses 60% of its sales volume Y-o-Y after strong 2018. Bronx sales activity down 37%, inking a mere 155 deals. Brooklyn sales volume halved, transactional activity down 32% Y-o-Y. As a blue wave…
Office Sales in Manhattan Drop 12% Y-o-Y in Q4 2019
Manhattan office sales dropped 12% year-over-year (Y-o-Y), with total volume dipping under $2.8 billion. Quarter-over-quarter, Manhattan sales decreased by more than $1 billion, despite gaining traction in Q3. Highlights: Year-over-year, the average price per square foot increased to $875. About 3.3 million square feet of office space was traded in Q4 2019, down 17% compared…

2019 Annual Foreclosure Report: NYC Foreclosures Dip 6% Y-o-Y, Manhattan Cases Surge 39%
Key Takeaways: Foreclosure activity increased in just one borough, with Manhattan surging 39%. Y-o-Y NYC foreclosures dipped 6%, while pre-foreclosures slid 7%. Bronx undergoes steepest drop in first-time foreclosures – down 21% Y-o-Y. Queens logs most foreclosures with 1,164 unique cases. Staten Island foreclosures remain relatively flat, yet still 313% above 2014 levels. Brooklyn’s 11236…
The New York City Ultra-Luxury Residential Report
Key Takeaways: June sales activity surged 185% month-over-month, inking 262 deals above $5 million. H2 2019 recorded lower transactional activity than the single month of June, as the new mansion tax took hold. TriBeCa was the #1 neighborhood for ultra-luxury sales, claiming 14% of all NYC deals. Central Park South was the most expensive neighborhood…
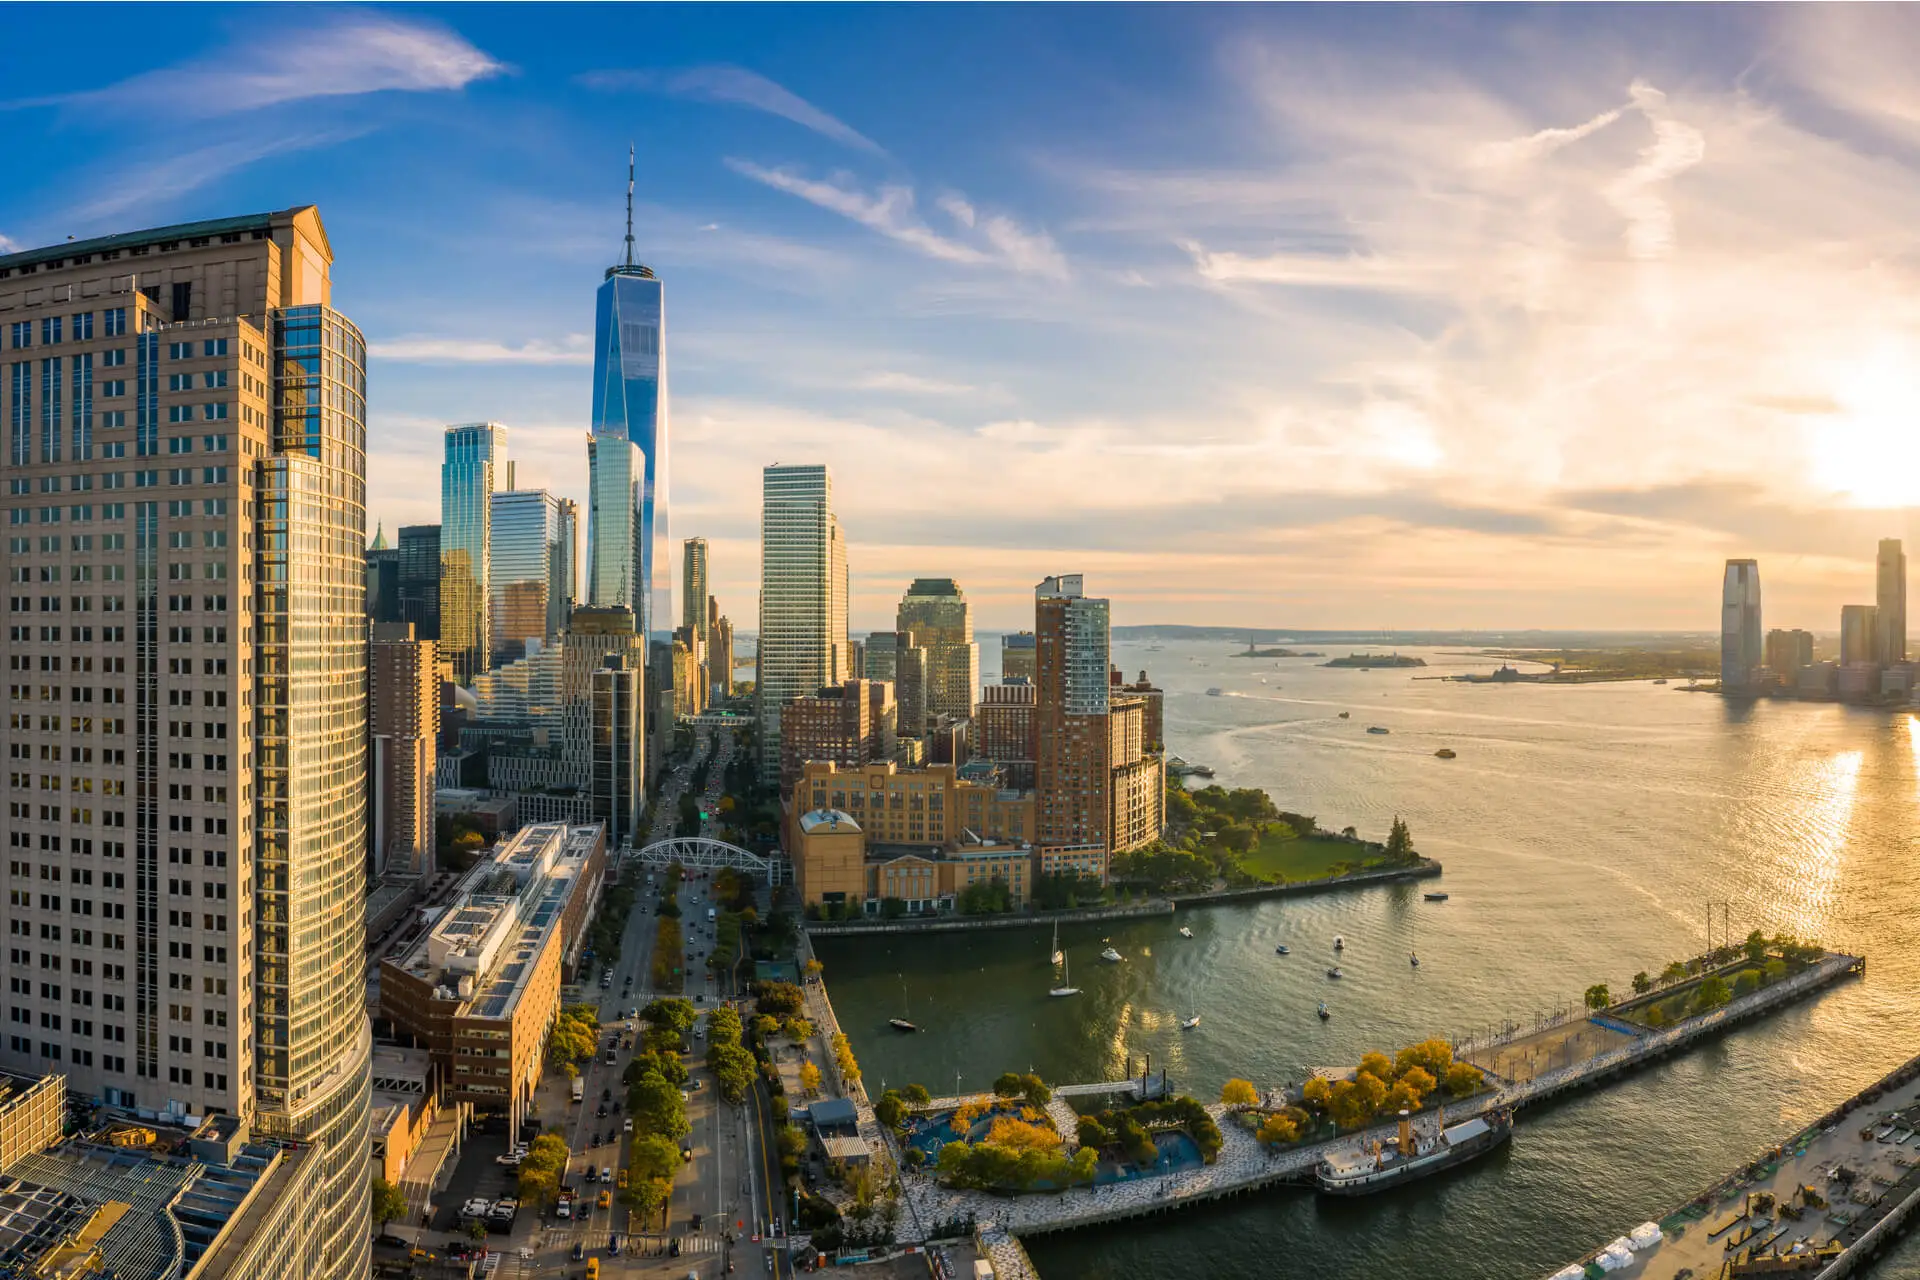
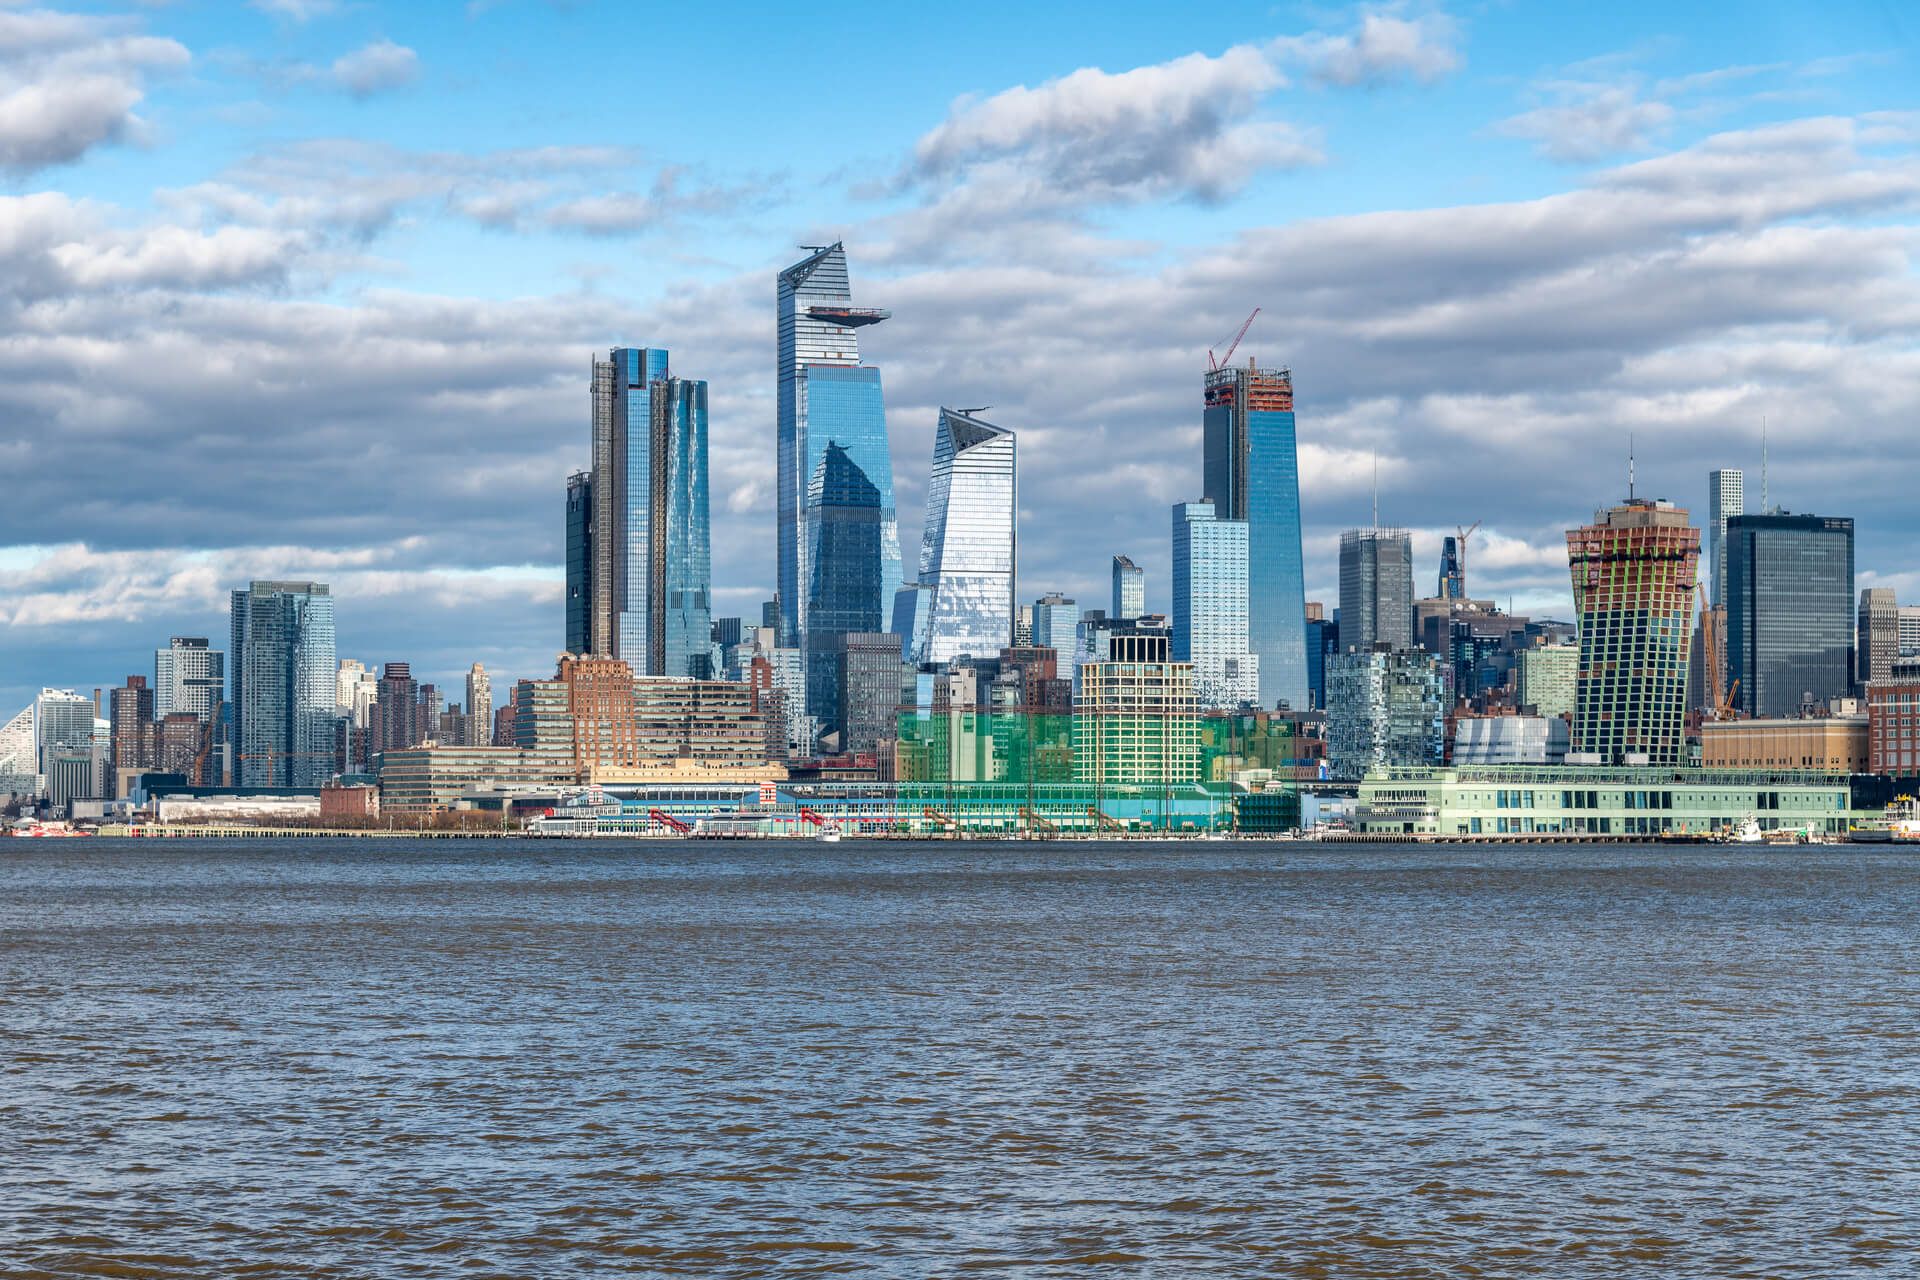
At Almost $4 Million,Hudson Yards Surpasses Tribeca As NYC’s Priciest Neighborhood
Hudson Yards’ nearly $4 million price put Tribeca squarely in second place. pushing SoHo to third.
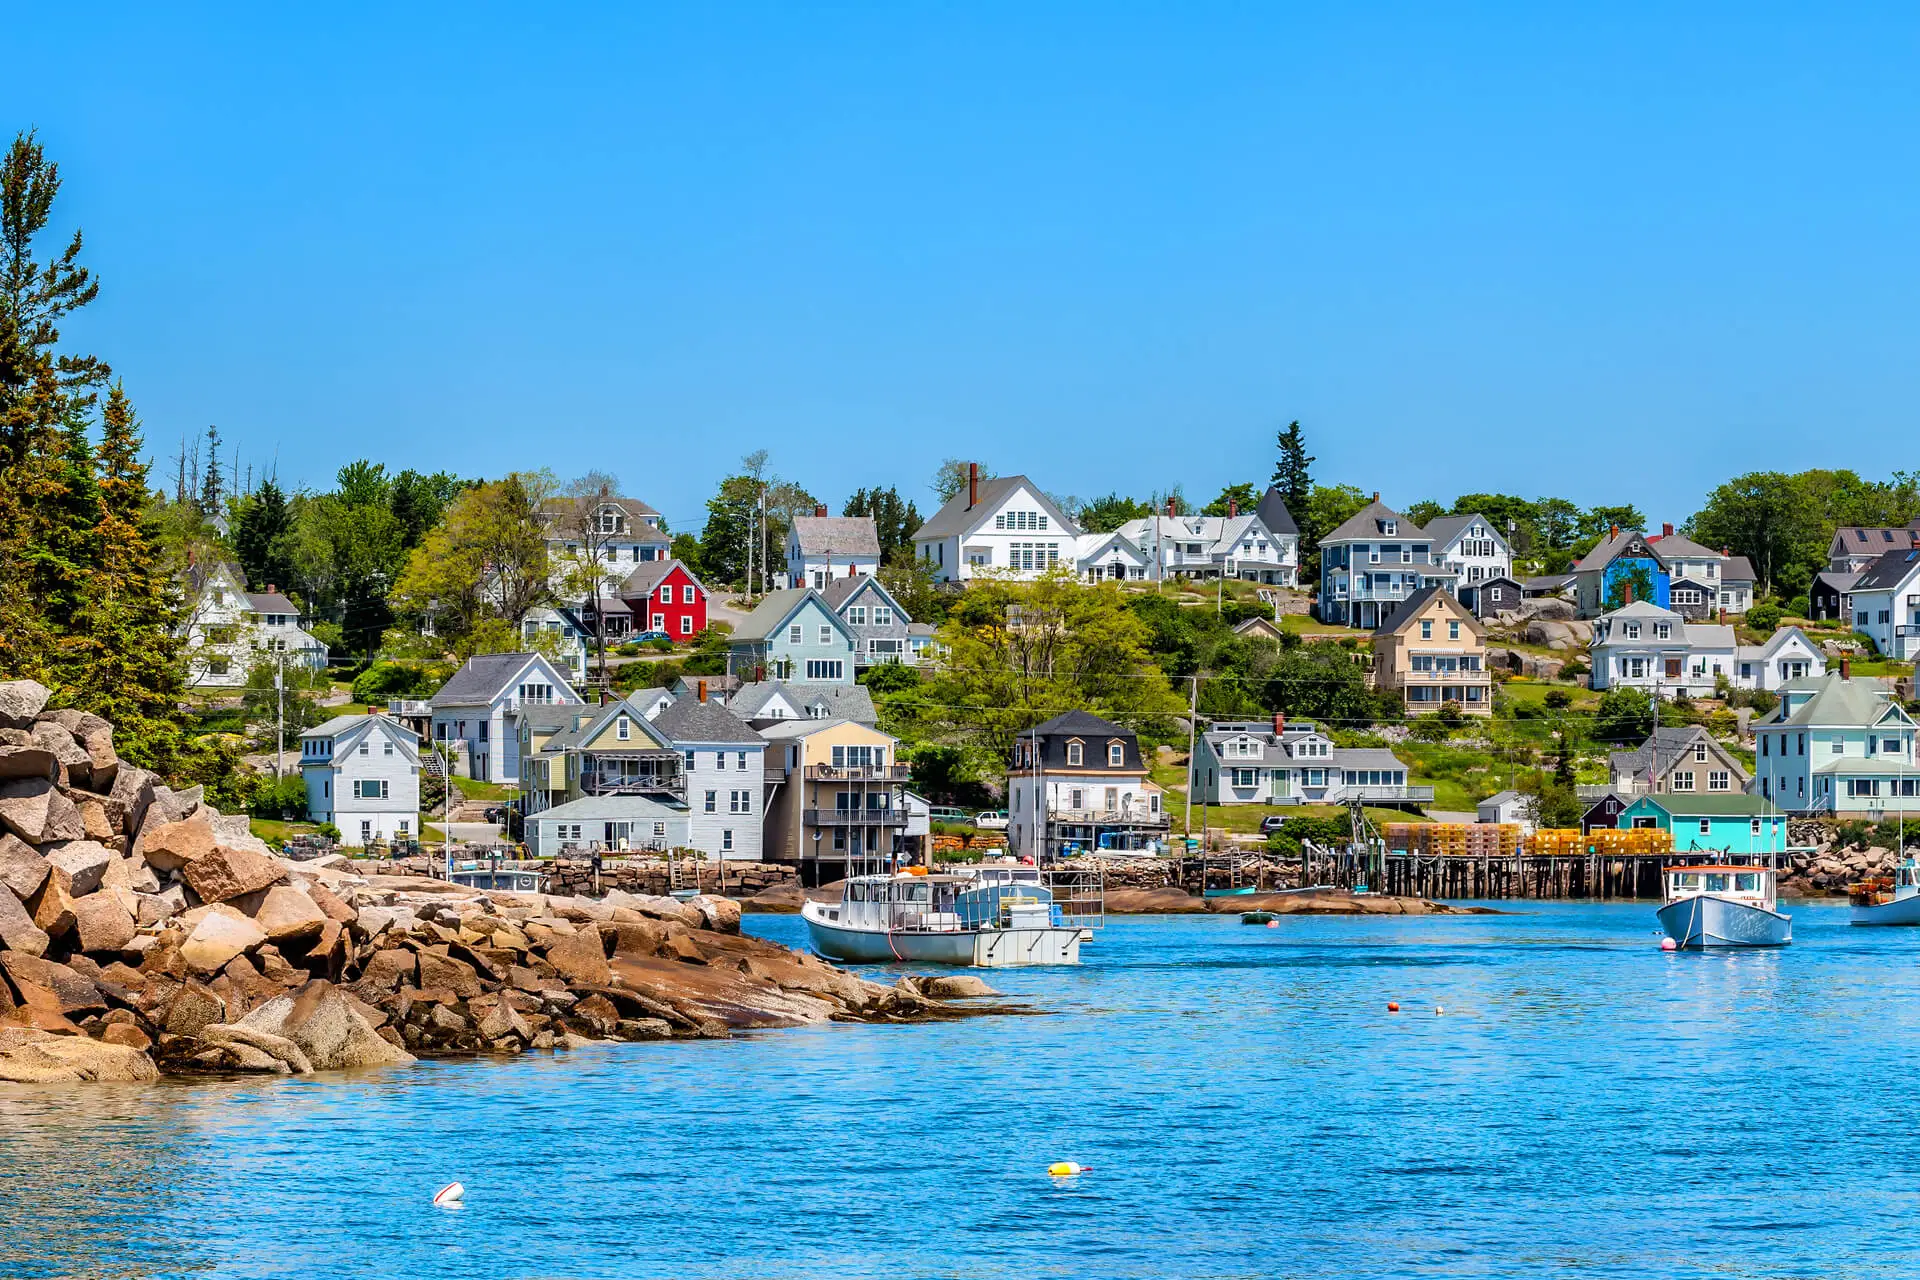
Top 50 Most Expensive Zip Codes in New England
Key Takeaways: After releasing our traditional year-end report of the 100 most expensive zip codes in the U.S., we were curious about the 50 priciest New England zip codes in 2019. After all, the region placed seven zip codes among the 100 most expensive in the U.S. – including 02199 in Boston, the #6 most expensive zip code…

Central Business Districts vs. Urban vs. Suburban: Breaking Down 10 Years of Office Expansion in the US
Between 2008 and 2018, the U.S. expanded its office footprint by 682 million square feet, 370 million of which have been added in the top 20 markets. Using data from Yardi Matrix, a recent COMMERCIALCafé study looked closely at where this space was added—urban areas, suburban areas or central business districts (CBDs). The findings highlight…
Top 25 Most Expensive Chicago Area Zip Codes in 2019
Key Takeaways: Kenilworth’s 60043 leads as the only zip with a median greater than $1 million. Chicago’s priciest zip code is The Loop’s 60603 at $570,000. The North Shore is home to six of the 10 most expensive zip codes in the Chicago area. City of Chicago ranks 12 zips among the area’s top 25…
Top 50 Most Expensive Desert States Zip Codes in 2019
Key Takeaways: At $1.76 million, Glenbrook, NV, is the most expensive desert states zip code. Only 3 Nevada and Arizona zip codes feature medians greater than $1 million. Paradise Valley remains home to Arizona’s priciest zip code, up 40% in two years. With 7 each, Phoenix and Scottsdale tie for the highest number of expensive…

Miami-Dade Residential Price Evolution 2014-2018: Median Sale Price More Than Doubles in 7 Markets
Key Takeaways: Pinewood leads residential price growth with 138% expansion rate. Highest growth rates recorded in markets with 2014 medians below $80,000. Fontainebleau sales activity soars with 210% appreciation. Miami median sale price gains 30% in five years, hits $334,000. At $2.4M, Golden Beach is most expensive Miami-Dade market. One of the most vibrant cities…
Bay Area Price Evolution 2014-2018: Bethel Island Median Up 117%, but Peninsula Still Absolute Price Leader
Key Takeaways: Median sale price up 40%+ in one-third of Bay Area markets. Bethel Island median leads with 117% expansion. 43 Bay Area municipalities post medians of at least $1 million. Penngrove leads sales activity growth, expanding 88%. At $6.7 million, Atherton is the most expensive Bay Area market. One of the most exclusive real…
Multifamily Sales Volume Declines City-Wide, But Gains 26% Y-o-Y in Brooklyn
Key Takeaways: City-wide multifamily sales volume down 60% Y-o-Y. Brooklyn sales volume climbs 26% Y-o-Y. NYC price per unit gains 26% over year-ago figures. Top multifamily sale in Manhattan fetches $53 million. YTD unit volume drops 65% in Queens. Sales activity down 60% in the Bronx. As New York City’s commercial real estate market adjusts…
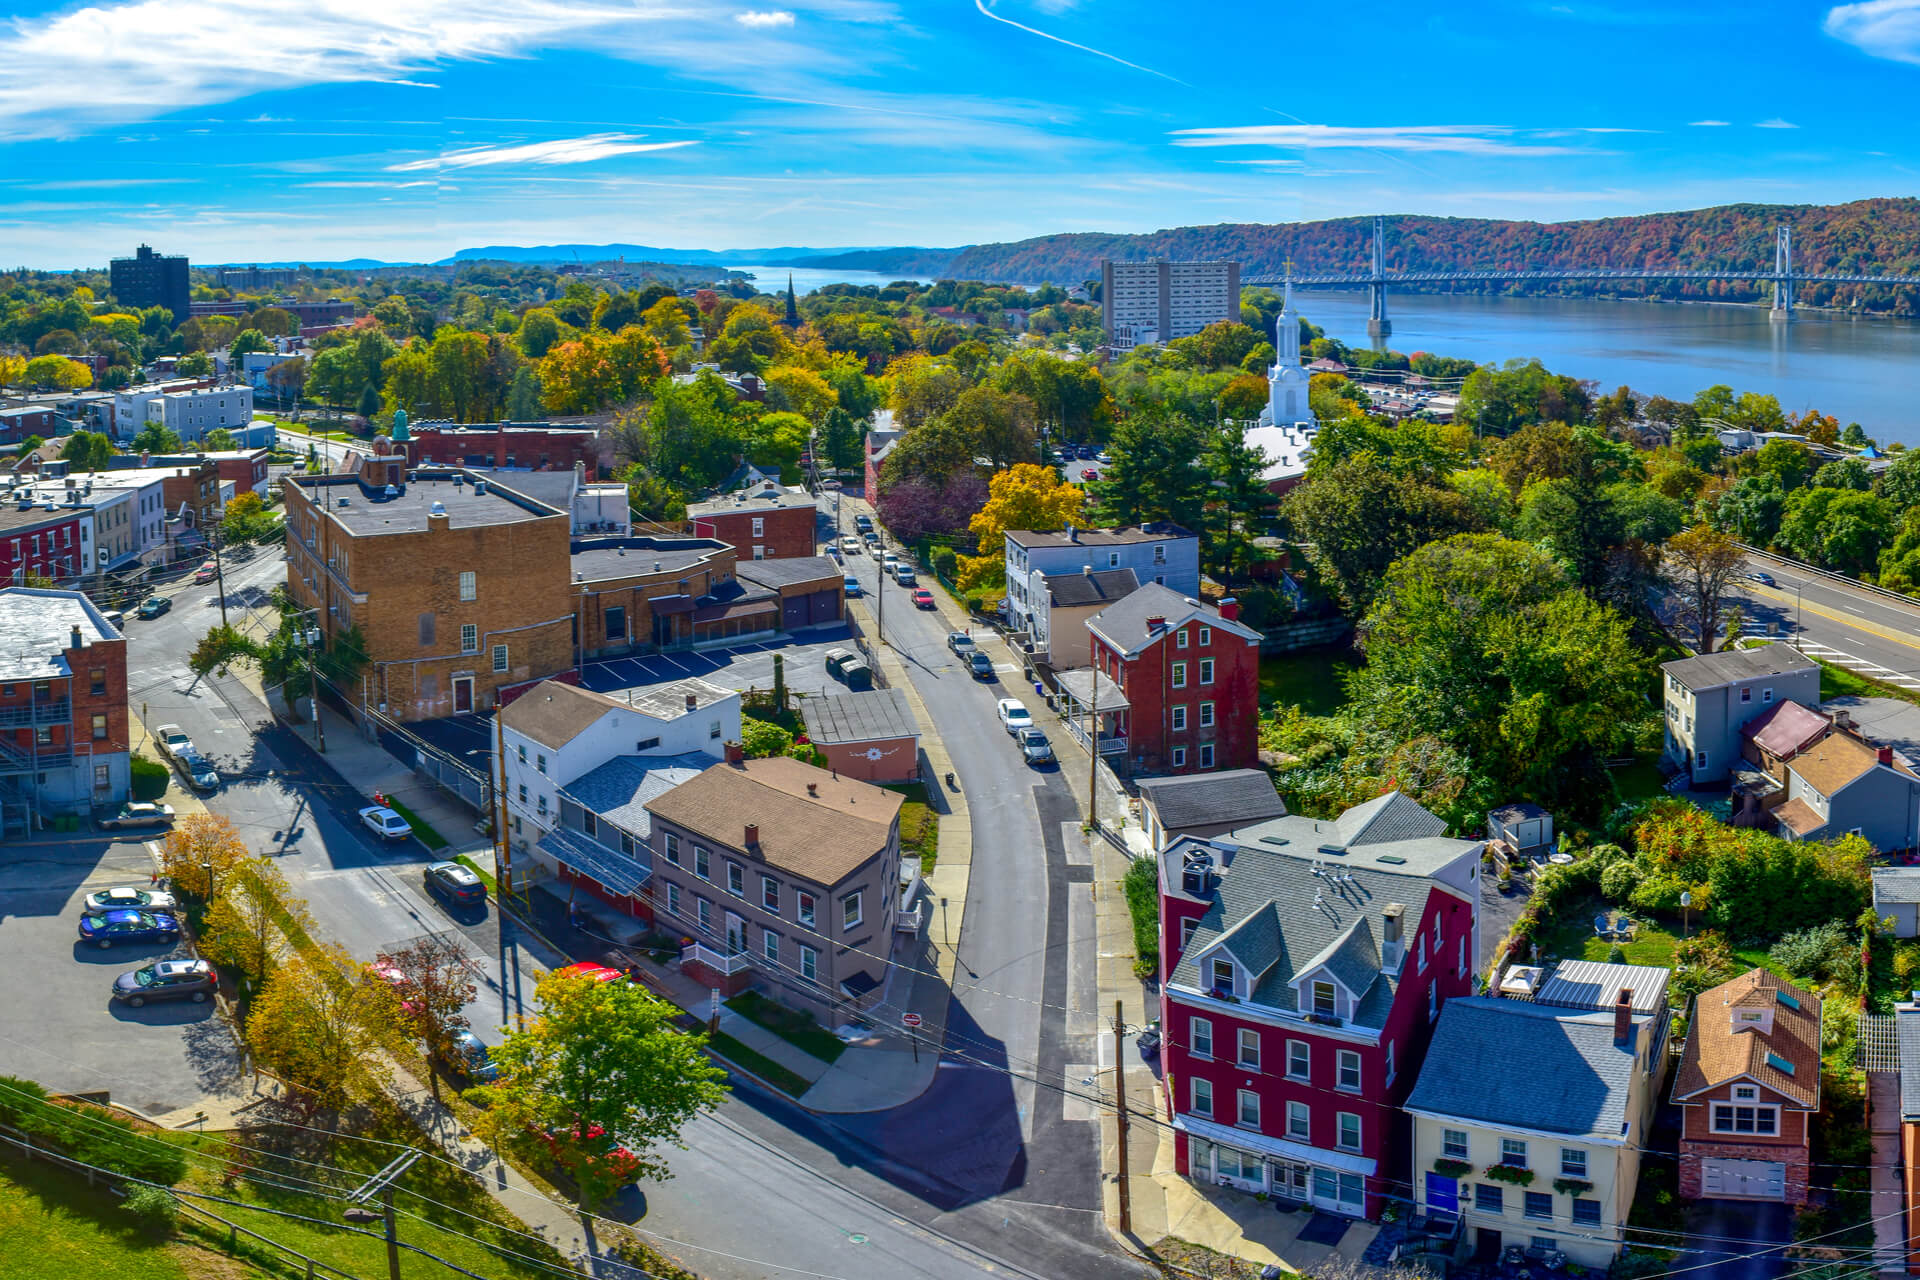
Hudson Valley Residential Price Evolution 2014-2018: Prices Contract in 39% of Hudson Valley Markets
Key Takeaways: Stanford leads Hudson Valley price evolution with 36% median growth. Deerpark undergoes biggest price contraction at 27%. Sales activity more than doubles in Union Vale and Dover Town. At $1.85 million, Rye has the highest median sale price in the Hudson Valley. Located on the doorstep of one of the most dynamic real…
NYC Multifamily Market Continues Slowdown in September, Y-O-Y Sales Volume Declines 76%
Key Takeaways: September slowest sales month for NYC multifamily, down 51% Y-O-Y Queens doubles September sales volume Bronx prices hit lowest figure in 18 months YTD unit volume down 74% in Brooklyn Y-O-Y sales volume falls 81% in Manhattan City-wide sales volume drops 76% Y-O-Y New York City’s new Housing Stability and Tenant Protection Act…
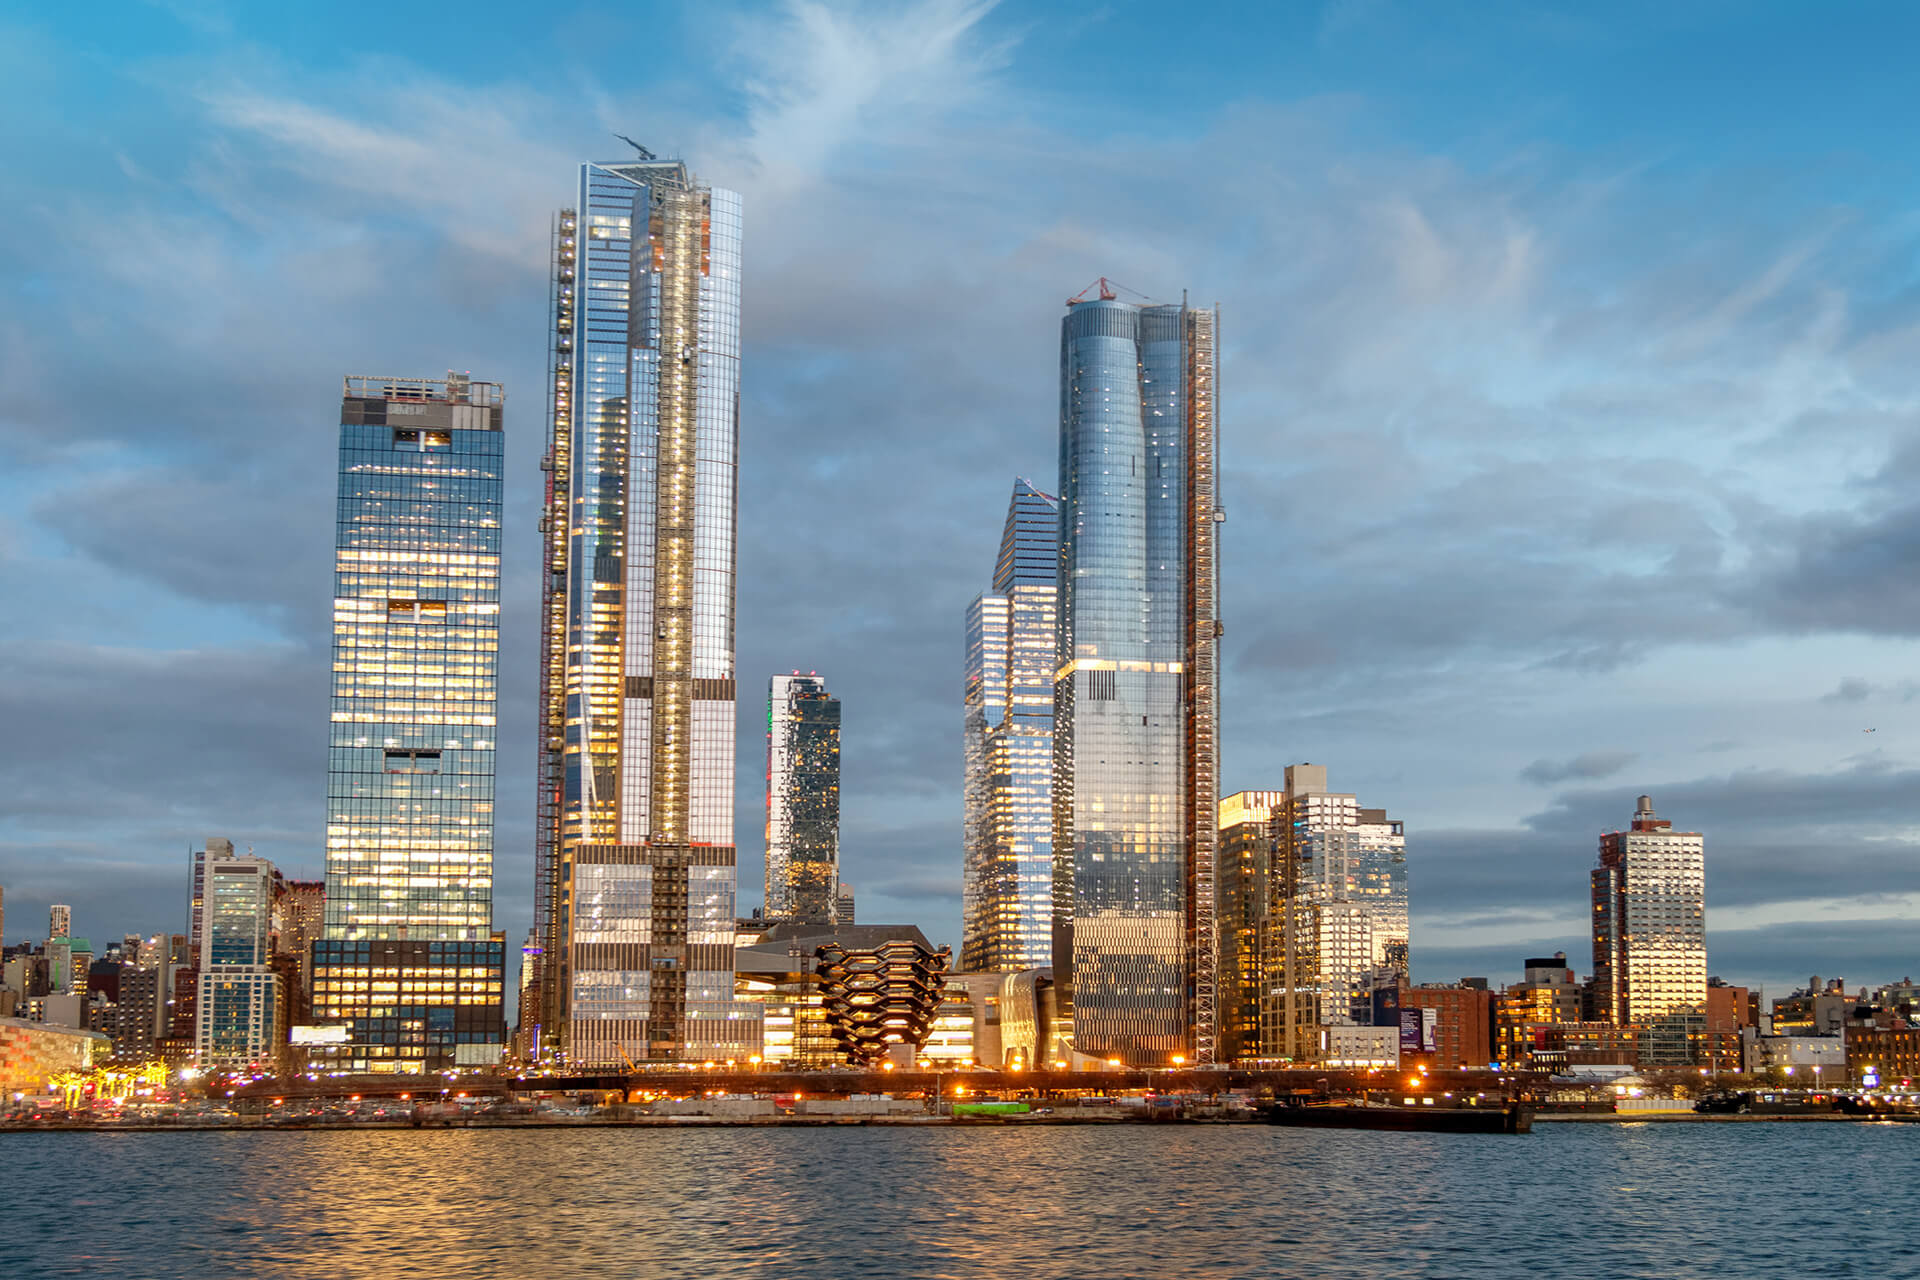
At Almost $5 Million, Hudson Yards Overtakes TriBeCa as the Priciest Neighborhood in NYC
Key takeaways: Hudson Yards take top spot by large margin TriBeCa falls from top spot for the first time in seven quarters Lower East Side jumps to 8th position on high sale volume Manhattan’s median sale price falls to lowest level since 2016 The top 50 Hudson Yards also dethroned Tribeca as the priciest neighborhood, more…

Manhattan Foreclosures Increase 118% Y-o-Y – Q3 2019 Report
Key takeaways: Manhattan cases up a staggering 118% year-over-year Staten Island unique cases skyrocket 183% The Bronx sees the steepest drop in foreclosure activity, a 51% drop Y-o-Y In Queens, foreclosure cases dipped 10% Lis pendens increased 4% Y-o-Y, and dropped 22% Q-o-Q Despite major foreclosure activity increases in two boroughs, first-time foreclosures in New…
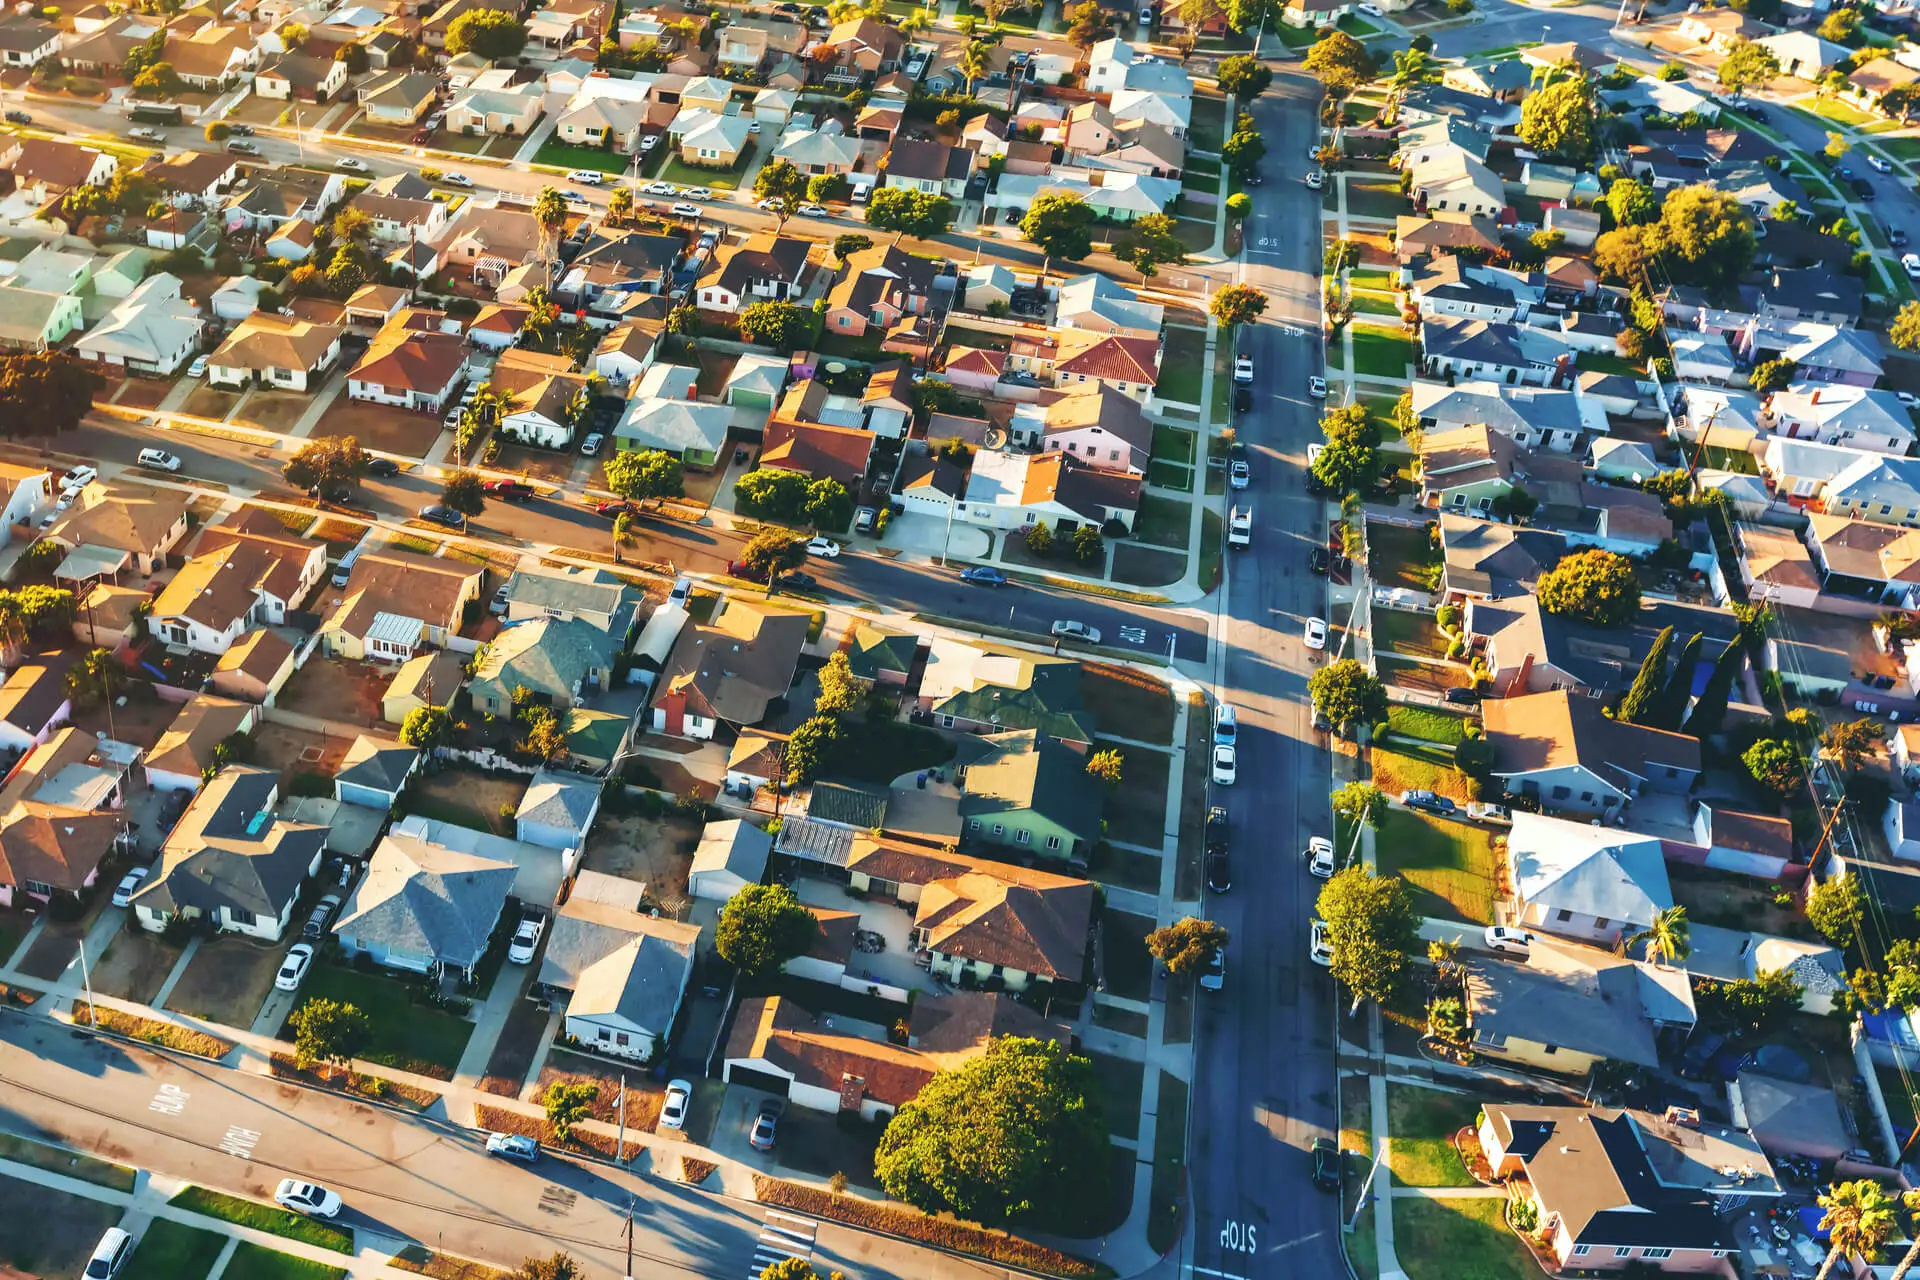
Metro L.A. Residential Price Evolution 2014-2018: Beverly Hills Remains Most Expensive Market at $3M; Inglewood Leads Growth with 60% Median Gain
Metro L.A.’s real estate market remains among the most exclusive nationwide, with two of its neighborhoods posting median sale prices above the $10 million mark last year.
Want to stay on top of the real estate market?
Access comprehensive property data and ownership information with intuitive research tools.